Hello! I am Léo, Product Manager at AB Tasty. I’m in charge, among several things, of our JavaScript tag that is currently running on thousands of websites for our clients. As you can guess, my roadmap is full of topics around data collection, privacy and… performance.
In today’s article, we are going to talk about JavaScript tag performance, open-data monitoring and competition. Let’s go!
Performance investigation
As performance has become a big and hot topic during the past few years, mainly thanks to Google’s initiative to deploy their Core Web Vitals, my team and I have been focused a lot on that. We’ve changed a lot of things, improved many parts of our tag and reached excellent milestones. Many of our users have testified of their satisfaction around that. I have already made a (long) series of blog articles about that here. Sorry though, it’s only in French. 😊🥖
From time to time, we get tickled by competitors about a specific report around performance that seems to show us as underperforming based on some metrics. Some competitors claim that they are up to 4 times faster than us! And that’s true, I mean, that’s what the report shows.
You can easily imagine how devastating this can be for the image of my company and how hard it could be for our sales team when a client draws this card. This is especially demoralizing for me and my team after all the work we’ve pushed through this topic during the last few years.
Though it was the first feeling I got when seeing this report, I know for a fact that our performance is excellent. We’ve reached tremendous improvements after the release of several projects and optimizations. Today all the benchmarks and audits I run over our customers’ websites show very good performance and a small impact on the famous Core Web Vitals.
Also, it’s very rare that a customer complains about our performance. It can happen, that’s for sure, but most of the time all their doubts disappear after a quick chat, some explanations and hints about optimization best practices.
But that report is still there, right? So maybe I’m missing something. Maybe I’m not looking at the correct metric. Maybe I’ve only audited customers where everything is good, but there’s a huge army of customers that don’t complain that our tag is drastically slowing their website down.
One easy way to tackle that would be to say that we are doing more with our tag than our competitors do.
Is CRO the same as analytics?
On the report (I promise I will talk about it in depth below 😄), we are grouped in the Analytics Category. However, Conversion Rate Optimization isn’t the same as Analytics. An analytics tool only collects data while we activate campaigns, run personalizations, implement widgets, add pop-ins and more. In this sense, our impact will be higher.
Let’s talk about our competitors: Even though we have the best solution out there (😇), our competitors do more or less the same things as us by using the same technics with the same limits and issues. Therefore, it’s legit to compare us with the same metrics. It might be true that we do a bit more than they do, but in the end, this shouldn’t explain a 4x difference in our performance.
Back then, and before digging into the details, I took the results of the report with humility. Therefore, my ambition was to crawl the data, analyze websites where their tag is running and try to find what they do better than us. We call that retro-engineering, and I find it healthy as it would help to have a faster website for everyone.
My engagement with my management was to find where we had a performance leak and solve it to be able to decrease our average execution time and get closer to our competitors.
But first, I needed to analyze the data. And, wow, I wasn’t prepared for that.
The report
The report is a dataset that is being monthly generated by The HTTP Archive. Here is a quote from their About Page:
“Successful societies and institutions recognize the need to record their history – this provides a way to review the past, find explanations for current behavior, and spot emerging trends. In 1996, Brewster Kahle realized the cultural significance of the Internet and the need to record its history. As a result he founded the Internet Archive which collects and permanently stores the Web’s digitized content.”
“In addition to the content of web pages, it’s important to record how this digitized content is constructed and served. The HTTP Archive provides this record. It is a permanent repository of web performance information such as size of pages, failed requests, and technologies utilized. This performance information allows us to see trends in how the Web is built and provides a common data set from which to conduct web performance research.”
Every month, they run a Lighthouse audit on millions of websites and generate a dataset containing the raw results.
As it is open-source and legit, it can be used by anyone to draw data visualization and ease access to this type of data.
That’s what the inventor of Google Lighthouse, Patrick Hulce, has done. Through his website, GitHub, he provides a nice visualization of this huge dataset and allows anyone to dig into details through several categories such as Analytics, Ads, Social Media and more. As I said, you’ll find the CRO tools in the Analytics category.
The website is fully open-source. The methodology is known and can be accessed.
So, what’s wrong with the report?
Well, there’s nothing technically wrong with it. We could find it disappointing that the dataset isn’t automatically updated every month, but the repository is open-source, so anyone motivated could do it.
However, this is only displaying the data in a fancy manner and not providing any insights or deep analysis of it. Any flaw or inconsistency will remain hidden and it could lead to a situation where a third party is seen as having bad performance compared to others when it is not necessarily the case.
One issue though, not related to the report itself, is the flaw an average could bring with it. That’s also something we are all aware of but that we tend to forget. If you take 10 people, 9 of them earn 800€ a month but one is earning 12 million euros a month, then we could conclude that everyone earns 1.2 million euros per month. Statistically right, but sounds a bit wrong, doesn’t it? More on that in a minute.
Knowing that, it was time to get my hands a bit dirty. With my team, we downloaded the full dataset from February 2023 to run our own audit and understand where we had performance leaks.
Note that downloading the full dataset is something we have been doing regularly for about one and a half years to monitor our trend. However, this time I decided to dig into the February 2023 report in particular.
The analysis
On this dataset, we could find the full list of websites running AB Tasty that have been crawled and the impact our tag had on them. To be more accurate, we have the exact measured execution time of our tag, in milliseconds.
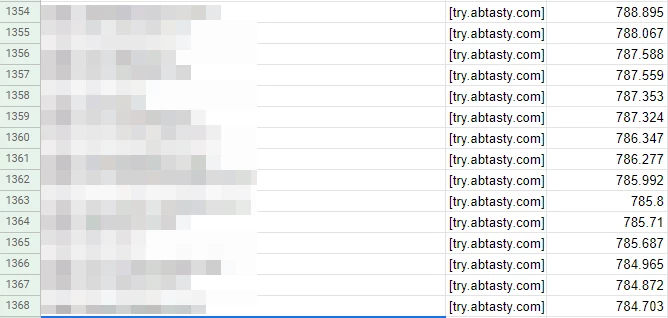
This is what we extracted. The pixellated column is the website URL. The last column is the execution time in milliseconds.
With the raw data, we were able to calculate a lot of useful metrics.
Keep in mind that I am not a mathematician or anything close to a statistics expert. My methodology might sound odd, but it’s adequate for this analysis.
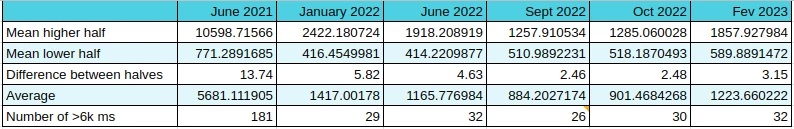
This is the first metric I get — the raw average for all the websites. That’s probably very close, if not equal, to what is used by the thirdpartyweb.today website. We already saw the downside of having an average, however, it’s still an interesting value to monitor.
- Mean higher half and mean lower half
Then, I split the dataset in half. If I have 2000 rows, I create two groups of 1000 rows. The “higher” one and the “lower” one. It helps me have a view of the websites where we perform – the worst compared to the best. Then, I calculate the average of each half.
- The difference between the two halves
The difference between the two halves is important as it shows the disparity within the dataset. The closer it is, the less extreme values we have.
- The number of websites with a value above 6k ms
It’s just an internal metric we follow to give us a mid-term goal of having 0 websites above this value.
- The evolution of the last dataset
I compute the evolution between the last dataset I have and the current. It helps me see if we get better in general, as well as how many websites are leaving or entering the chart.
The results
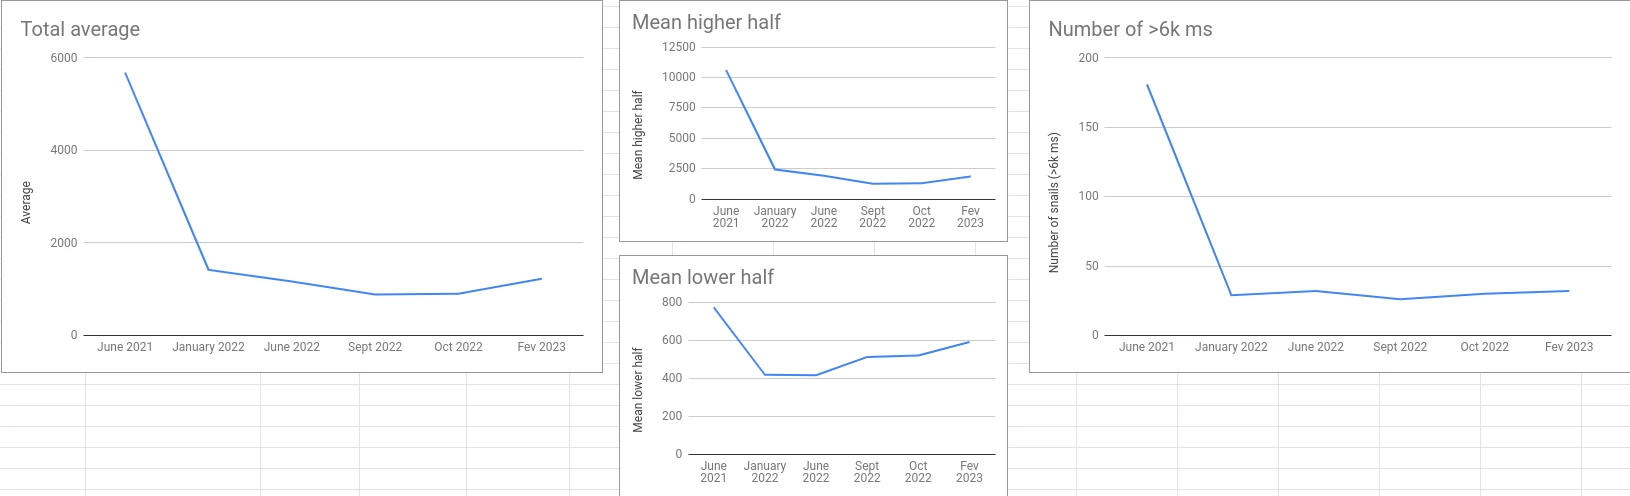
These are the results that we have:
Here are their corresponding graphs:
This is the evolution between October 2022 and February 2023:
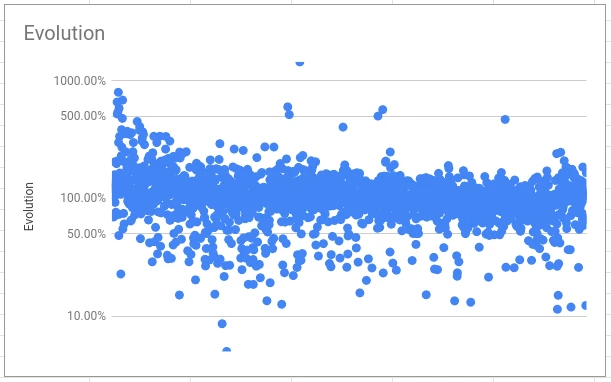
Watch out: Logarithmic scale! Sorted by February 2023 execution time from left to right.
The figures say it all. But, if I can give a global conclusion, it’s that we made tremendous improvements in the first six months and staled a bit after with finer adjustments (the famous 80/20 of Pareto’s).
However, after the initial fall, two key figures are important.
First of all, the difference between the two halves is getting very close. This means that we don’t have a lot of potential performance leaks anymore (features that lead to an abnormal increase in the execution time). This is our first recent win.
Then, the evolution shows that in general, and except for the worst cases, it is steady or going down. Another recent win.
Digging into the details
What I have just shared is the raw results without having a look at the details of each row and each website that is being crawled.
However, as we say, the devil is in the details. Let’s dig in a bit.
Let’s focus on the websites where AB Tasty takes more than six seconds to execute.
Six seconds might sound like a lot (and it is), but don’t forget that the audit simulates a low-end CPU which is not representative of the average device. Instead, it shows the worst-case scenario.
In the February 2023 report, there are 33 of them. This is an average execution time of 19877 ms. I quickly identified that:
- 27 of them are from the same AB Tasty customer
- One of them is abtasty.com and the total execution of resources coming from *abtasty.com on this website is very high 😊
- Two others are also coming from one singular AB Tasty customer
In the end, we have only 5 customers on this list (but still 33 websites, don’t get me wrong).
Let’s now try to group up these two customers with duplicates to see the impact on the average. The customer with 27 duplicates also has websites that are below the 6k ms mark, but I’m going to ignore it for now (and to ease things up).
For each of the two customers with duplicates, I’m going to compute the average of all their duplicates. For the first one, the result is 21671 ms. For the second, the result is 14708 ms.
I’m also going to remove abtasty.com, which is not relevant.
With the new list, I went from 1223 ms for the full list average to 1005 ms. I just improved our average by more than 200 ms! 🎉
Wait, what? But you’re just removing the worst websites. Obviously, you are getting better…
Yep, that’s true. That’s cheating for sure! But, the point of this whole article is to demonstrate that data doesn’t say it all.
Let’s talk first about what is happening with this customer that has 27 duplicates.
The same tag has been deployed on more than 50 very different websites! You might not be very familiar with AB Tasty, so let me explain why this is an issue.
You might have several websites which have the same layout (that’s often the case when you have different languages). It makes sense to have the same tag on these different domains to be able to deploy the same personalizations on all of them at once. That’s not the most optimal way of doing it, but as of today, that’s the easiest way to do it with our tool.
However, if your websites are all different, there is absolutely no point in doing that. You are going to create a lot of campaigns (in this case, hundreds!) that will almost never be executed on the website (because it’s not the correct domain) but are still at least partially included in the tag. So our tag is going to spend its time checking hundreds of campaigns that have no chance to execute as the URL is rarely going to be valid.
Though we are working on a way to block this behavior (as we have alternatives and better options), it will take months before it disappears from the report.
Note: If you start using AB Tasty, you will not be advised to do that. Furthermore, the performance of your tag will be far better than that.
Again, I didn’t take the time to group all the duplicated domains as it is pointless, the goal was to demonstrate that it is easy to show better performance if we exclude anomalies that are not representative. We can imagine that we would improve more than 200+ ms by keeping only one domain.
I took the most obvious case, but a quick look at the rest of the dataset showed me some other examples.
The competitors’ figures
Knowing these facts and how our score might look worse than it is because of one single anomaly, I started looking into our competitors’ figures to see if they have the same type of issue.
I’m going to say it again: I’m not trying to say that we are better (or worse) than any of our competitors here, that’s not my point. I’m just trying to show you why statistics should be deeply analyzed to avoid any interpretation mistakes.
Let’s start by comparing AB Tasty’s figures for February 2023 with the same metrics for one of them.
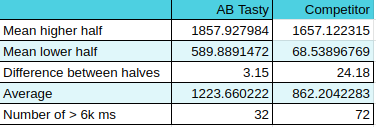
In general, they look a bit better, right? Better average and even the means for each half is better (and the lower half by a lot!).
However, between the two halves, the factor is huge: 24! Does it mean that depending on your usage, the impact of their tag might get multiplied by 24?
If I wanted to tease them a little bit, I would say that when testing the tag on your website, you might find excellent performance but when starting to use it intensely you might face serious performance drops.
But, that would be interpreting a very small part of what the data said.
Also, they have more than twice the number of websites that are above the 6k ms mark (again: this mark is an AB Tasty internal thing). And that is by keeping the duplicates in AB Tasty’s dataset that we discussed just before! They also have duplicates, but not as many as we do.
A first (and premature) conclusion is that they have more websites with a big impact on performance but at the same time, their impact is lower in general.
Now that I know that in our case we have several customers that have duplicates, I wanted to check if our competitors have the same. And this one does – big time.
Among the 2,537 websites that have been crawled, 40% of them belong to the same customer. This represents 1,016 subdomains of the same domain.
How does this impact their score?
Well, their customer wasn’t using the solution at the moment the data was collected (I made sure of it by visiting some of the subdomains). This means that the tag wasn’t doing anything at all. It was there, but inactive.
The average execution time of these 1,016 rows in the dataset is 59 ms!! 😭 It also has a max value of 527 ms and a min value of 25 ms.
I don’t need to explain why this “anomaly” interestingly pulls down their average, right?
The 1,016 subdomains are not fake websites at all. I’m not implying that this competitor cheated on purpose to look better- I’m sure they didn’t. It is just a very nice coincidence for them, whether they are aware of it or not.
To finish, let’s compare the average of our two datasets after removing these 1,016 subdomains.
AB Tasty is at 1223 ms (untouched list) when this competitor is now at… 1471 ms.
They went from 361 ms better to 248 ms worse. I told you that I can let the figures say whatever I want. 🙂
I would have a lot of other things to say about these datasets, but I didn’t run all the analysis that could have been done here. I already spent too much time on it, to be honest.
Hopefully, though, I’ve made my point of showing that the same dataset can be interpreted in a lot of different manners.
What can we conclude from all of this?
The first thing I want to say is: TEST IT.
Our solution is very easy to implement. You simply put the tag on your website and run an audit. To compare, you can put another tool’s tag on your website and run the same audit. Run it several times with the same conditions and compare. Is the second tool better on your website? Fine, then it will probably perform better for your specific case.
Does a random report on the web says that one solution is better than another? Alright, that’s one insight, but you should either crunch the data to challenge it or avoid paying too much attention to it. Just accepting the numbers as it is displayed (or worse: advertised…) might make you miss a big part of the story.
Does AB Tasty have a bad performance?
No, it doesn’t. Most of our customers never complained about performance and some are very grateful for the latest improvements we’ve released on this topic.
So, some customers are complaining?
Yes. This is because sometimes AB Tasty can have a lower performance depending on your usage. But, we provide tools to help you optimize everything directly from our platform. We call this the Performance Center. It is a full section inside the platform and is dedicated to showing you which campaign is impacting your performance and what you can do to improve it. Just follow the guidelines and you’ll be good. It’s a very innovative and unique feature in the market, and we are very proud of it.
Though, I must admit that a few customers (only a few) have unrealistic expectations about performance. AB Tasty is a JS tag that is doing DOM manipulations, asynchronous checks, data collection and a lot of fancy stuff. Of course, it will impact your website more than a simple analytics tool will. The goal for you is to make sure that the effect of optimizing your conversions is higher than what it costs you in terms of performance. And it will be the same, whatever the CRO tool you are using, except if you use a server-side tool like Flagship by AB Tasty, for example.
I am convinced that we should aim towards a faster web. I am very concerned about my impact on the environment, and I’m trying to keep my devices as long as possible. My smartphone is 7 years old (and I’m currently switching to another one that is 10 years old) and my laptop isn’t very recent either. So, I know that a slow website can be a pain.
Final Remarks
Let me assure you that at AB Tasty we are fully committed to improving our performance because our customers are expecting us to do it, because I am personally motivated to do it, and because that is a very fun and interesting challenge for the team (and also because my management asks me to do it 😅 ).
Also, kudos to HTTP Archive which does very important work in gathering all this data and especially sharing it with everyone. Kudos to Patrick Hulce who took the time to build a very interesting website that helps people have a visual representation of HTTP Archive’s data. Kudos to anyone that works to build a better, faster and more secure web, often for free and because that’s what they believe in.
Want to test our tool for yourself? AB Tasty is the complete platform for experimentation, content personalization, and AI-powered recommendations equipped with the tools you need to create a richer digital experience for your customers — fast. With embedded AI and automation, this platform can help you achieve omnichannel personalization and revolutionize your brand and product experiences.