The use of feature flags has evolved and expanded as teams now recognize the value they can bring to their releases.
First, let’s start with a simple definition of feature flags. A feature flag is a software development technique that lets you turn functionalities on and off to test new features in production without changing code.
This means that feature flags significantly accelerate software development processes while giving teams greater control and autonomy over releases.
Keep reading: Our complete guide to feature flagging
This is a technique that can be employed by all teams in an organization across a wide range of use cases, from the most simple to more advanced uses to improve their daily workflows.
In this article, we will explore these different uses to illustrate what feature flags can do across different contexts depending on your pain points and objectives.
Feature flags examples and use cases
Many of the use cases outlined below allow teams to take back control of releases and enable them to deliver new features quickly and safely. There may be a bug in production and you want to turn it off without delaying the release or you have second thoughts about a feature and you’re not ready for all your users to see it so you’d rather test this feature on a subset of users.
Feature flags also increase productivity and speed of teams. You’re no longer waiting to merge your code if other changes are incomplete; you just put it behind a flag until it’s ready. With this, you get more predictability to your releases. There’s no need to delay your release cycle for any last-minute bugs detected.
Therefore, we will see how the use cases outlined below bring these benefits to your team.
- Prepare for launch
- Hassle-free deployments: Release anytime by decoupling release from deployment
- Experience rollouts and progressive delivery
- Time your launch
- Running experiments and A/B testing
- Continuous integration and continuous delivery
- Managing access: User targeting
- Risk mitigation
- Test in production
- Feature flags and mobile app deployment: Bypass app store validation
- Kill Switch: Feature rollback
- Sunsetting features
- Managing migrations
- Feature flags as circuit breakers
- Bottomline: Use feature flags often but proceed with caution
Prepare for launch
Hassle-free deployments: Release anytime by decoupling release from deployment
Feature flags allow you to deploy whenever you and your team sees fit. You no longer need to delay your releases. Any changes to a feature that are not yet ready can be toggled off with a switch.
What feature flags do in this scenario is separate code deployment from release. This is done through a release toggle, which allows specific parts of a feature to be activated or deactivated so any unfinished features will remain invisible to users until they are ready to be released.
Why is the distinction between deployment and release significant? To answer this question, it is worth noting the difference between the two terms:
- Deployment is the process of putting code in its final destination on a server or any other place in your infrastructure where your code will run.
- Release is exposing your code to your end-users and so it is the moment when they get access to your new features.
This difference is why we talk about decoupling deployment from release because once you do that, you can push code anywhere, anytime, without impacting your users. Then, you can release gradually and selectively whenever you’re ready through progressive and controlled rollouts as we will see below.
Experience rollouts and progressive delivery
With feature flags, you are in complete control. This means once you have a feature ready for release, you can control which subset of users will see this feature through phased rollout of releases.
When we talk about experience rollouts, we’re referring to the risk-free deployment of features that improve and optimize the customer experience.
This is usually achieved through progressive rollouts, which builds on continuous delivery to include the use of feature flags to gradually introduce features to your users.
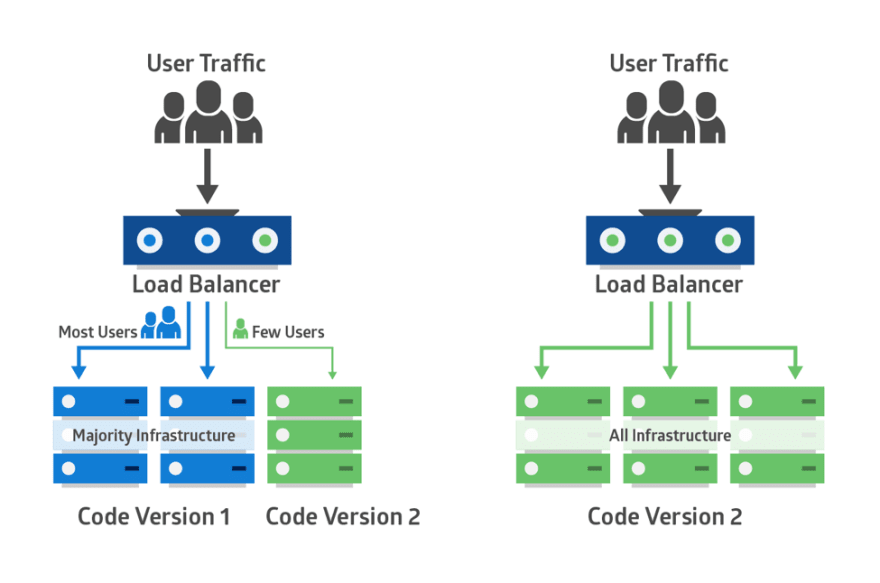
Rather than releasing to all your users, which is often risky, you may want to release to just 5% or 10% of your users. These users should represent your overall users. Meanwhile, the team observes how these users respond to the new feature before rolling out to everyone else.
One progressive rollout technique is known as canary deployment. This is where you test how good your feature is on a small group of users and if there’s any issue, you can immediately fix it before it’s exposed to a larger number of users. This sort of gradual rollout helps mitigate the risk of a so-called big bang release. It also helps ease the pressure on your server in case it cannot handle the load.
You may also carry out what is known as ‘ring deployments.’ This technique is used to limit the impact on end-users by gradually rolling out new features to different groups. These groups are represented by an expanding series of rings, hence the name, where you start with a small group and keep expanding this group to eventually encompass all users.
In a ring deployment, you choose a group of users based on similar attributes and then make the features available to this group.
Rings and feature flags work together where feature flags can help you hide certain parts of your feature if they’re not ready in any of the deployment rings.
The advantage of such controlled rollouts is the feedback you would generate from users, especially for releases you’re less than confident about and so with the feedback received, you can improve your product accordingly.
Time your launch
We know at this point that feature flags give you the control to release at any time you deem suitable. Feature flags, then, are important because you always decide the ‘when.’ As such, with feature flags, you can aim for a timed launch where you push your feature for people in your trusted circle, such as your QA team, to test in production.
Afterwards, when it’s time to launch, you simply turn on the feature for everyone else without any fuss with the added advantage that you’re feeling much more confident when it comes to the actual release to everyone else.
This significantly reduces stress among your team because you’ve tested the feature before the official launch and you’ve made sure it’s working as it should before going ahead with a wider release.
Running experiments and A/B testing
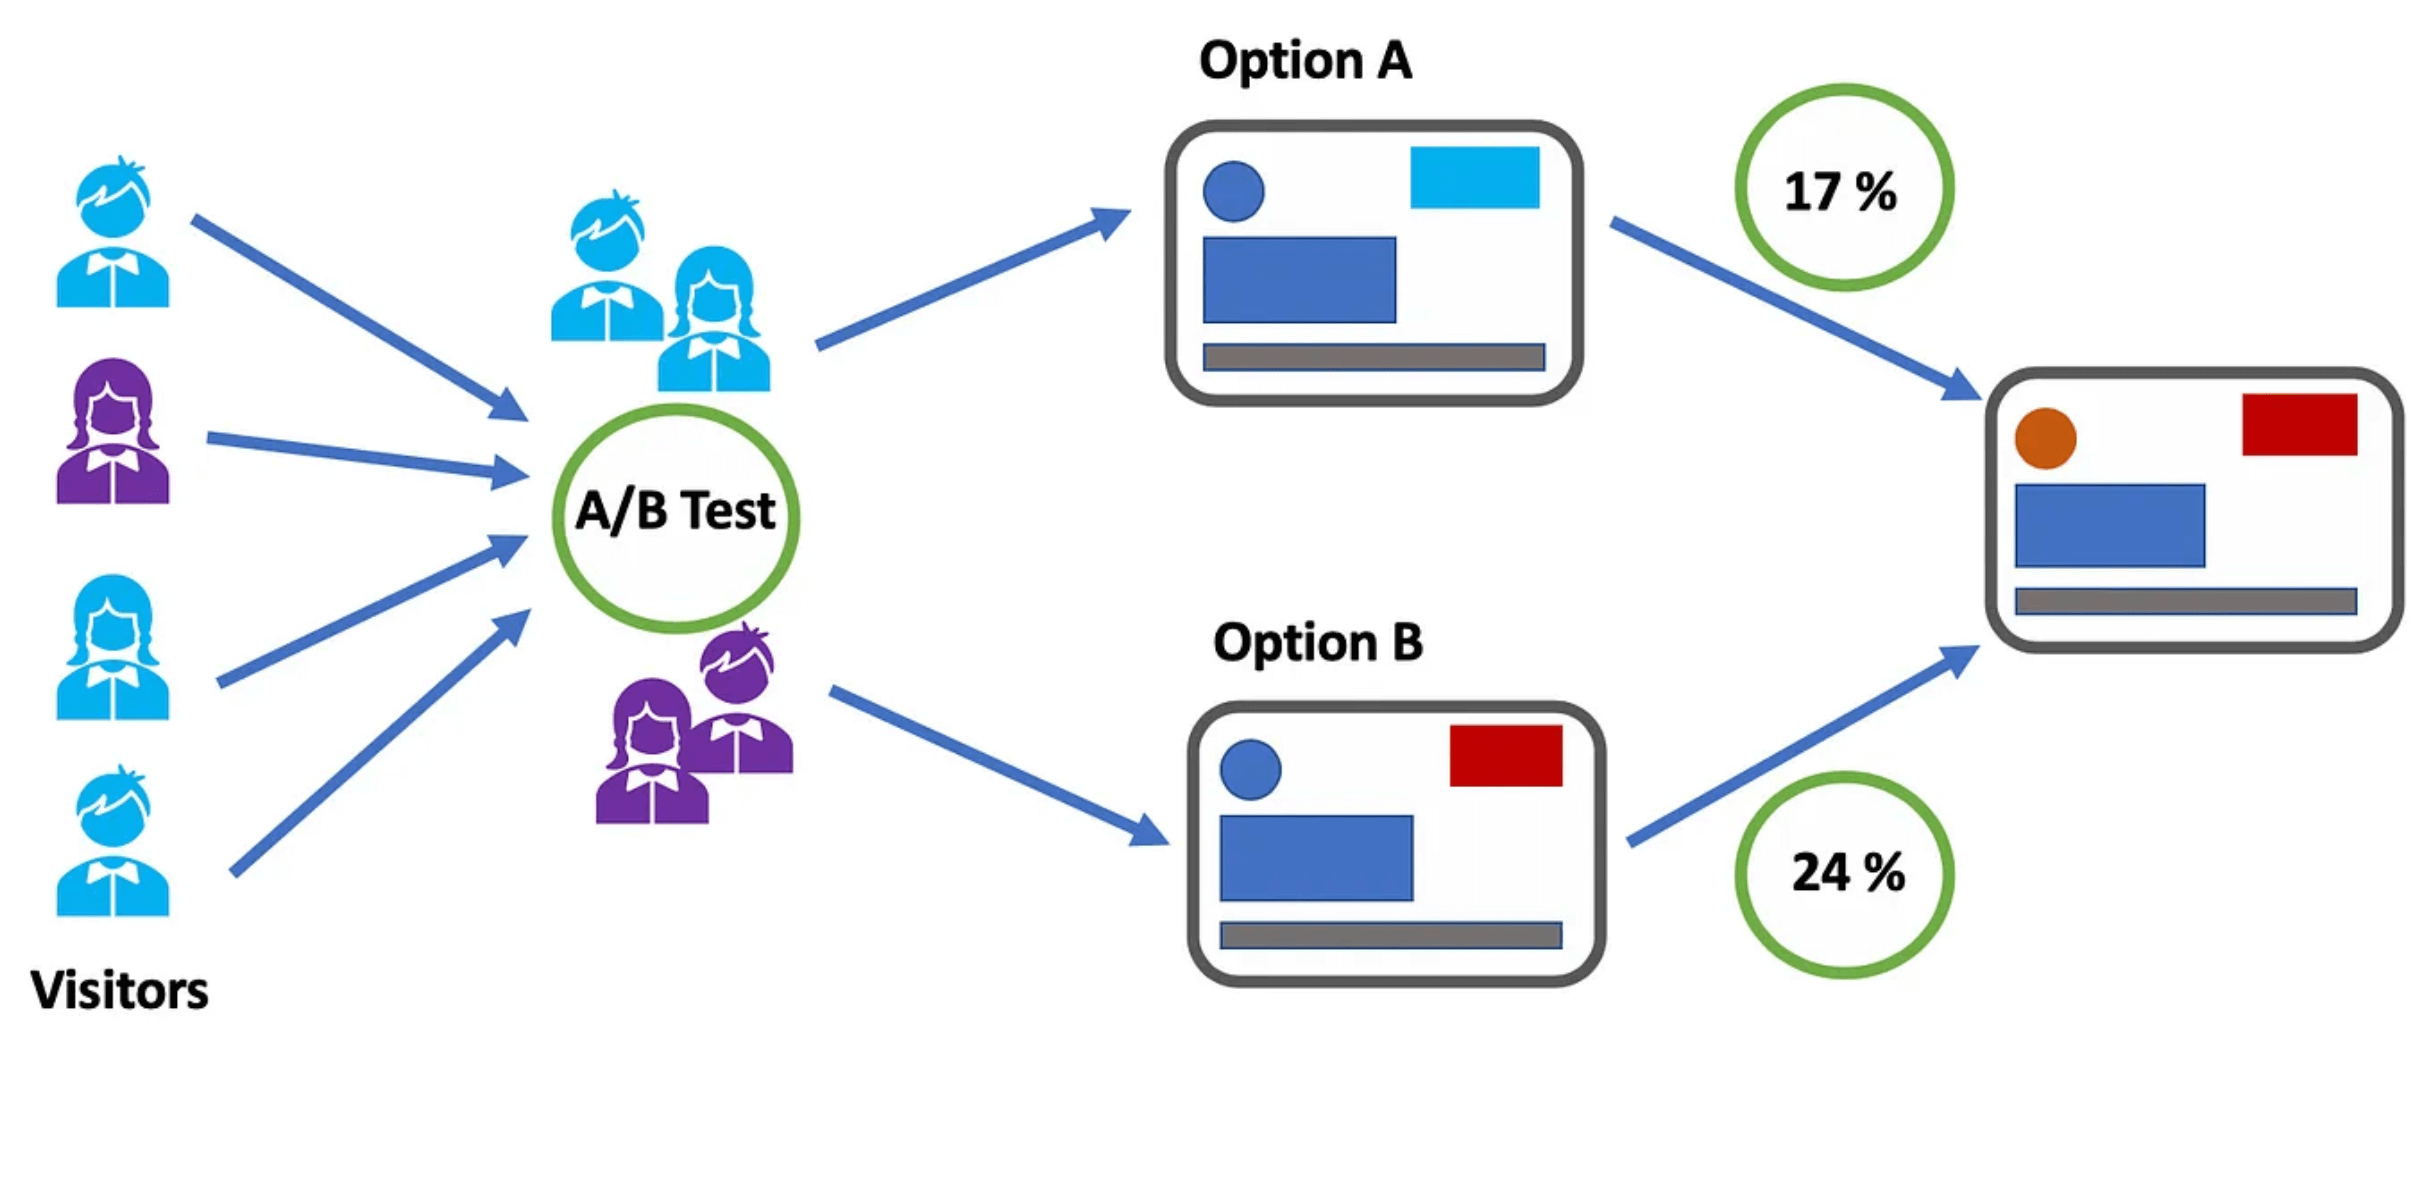
Feature flags are great for A/B tests, where you can assign a subset of users to a feature variation and see which performs better.
This is a great use for product and marketing teams who can easily test new ideas and eliminate them if they don’t fulfil the hypothesis defined upon creation of the test.
For example, feature flags would allow your product and marketing teams to send 50% of users to the new variation of a feature and the other 50% to the original one to compare performance according to the goals set and see which variation runs better according to the KPIs set.
Using feature flags to run A/B tests is particularly useful when a feature receives enough traffic to generate efficient results. So, as a cautionary note, keep in mind that not everything can be an A/B test when it comes to feature flags.
In this sense, you can look at feature flags like a light switch. You decide when you want to turn on the feature, when to turn it off and which users have access to it. This allows you to continuously test in production until you’re satisfied with the end-result which you can then roll out to the rest of your users.
Continuous integration and continuous delivery
Feature flags means developers no longer need multiple long-lived feature branches which more often than not lead to merge conflicts.
Let’s imagine you are all set to release but then one developer’s changes have not yet been integrated into the main feature branch. Does this mean you need to wait especially when you know time is precious when it comes to releasing to impatient customers in this day and age?
With this method, developers can integrate their changes, or commit code in small increments, much more frequently, perhaps even several times a day. Through trunk-based development, a key enabler of continuous integration, developers can merge their changes directly into the master trunk helping them move faster to ensure that code is always in a ready-to-be-released state.
Consequently, we can deduce that feature flags also facilitate the process of continuous delivery.
Feature flags are essential to maintain the momentum of CI/CD processes because as mentioned, feature flags decouple deployment from release so even unfinished features can be merged but can easily be hidden behind a flag so users don’t see it while other changes can still be delivered to users without waiting on those unfinished features.
In other words, feature flags will still allow you to still continuously deploy your code so even if there is an incomplete feature, users won’t be able to access the functionality as it would be hidden behind a flag.
Read more: Feature flags and CI/CD: Increased velocity and less risk
Managing access: User targeting
You don’t just choose the when, you also choose to whom.
Feature flags, as we’ve seen, gives you a lot of control over the release process by putting the power of when to release in your hands.
It‘s worth mentioning yet another form of power feature flags can give you, which is the ability to choose which users can access the feature. When you are testing in production, having the option to choose who you want to test on is extremely valuable depending on the kind of feedback you’re seeking.
Giving early access
We’ve seen in canary deployment that sometimes the sample you pick can be completely random. Other times, however, you might decide to carefully handpick a select group of users to give them early access to your new feature.
Why is this important? Because these are the users that are considered to be ‘early adopters.’ They are users you trust and whose feedback is top priority and who are most interested in this particular feature. These users are also the most forgiving should anything go wrong with the release.
With feature flags, you can release the feature to these early adopters who are more than willing to provide the kind of feedback you need to improve your product. This technique works well if you have a very risky release that you’re hesitant to release to a wider audience.
Power to the users: beta testing
Beta testing is another side to early access where in this scenario users willingly opt-in to test out your new features before they are released to the rest of your users.
As a result, the customers who opt-in get to see and test the feature by turning it on in their accounts and should they wish to back out they can easily disable the feature, which makes these users more inclined to opt-in in the first place as it makes them feel more in control.
This is an important use-case because it shows your customers that you’re really listening to their feedback by asking them to test your release.
The users who opt-in are those who you’re targeting with this feature so how they react to the feature will be of extreme use to you. Hence, you get to test out your new feature and you deliver value to your customers by responding to their feedback; it’s a win-win situation!
Dogfooding
This term refers to eating your own dog food, or in this case refers to an organization using its own product or service. You can, therefore, look at it as a way to test in production on internal teams.
It’s a form of alpha testing that you can run on internal users (within the organization) to make sure that the software meets all expectations and is working as it should. Thus, it represents an opportunity to evaluate the performance and functionality of a product release as well as obtain feedback from technical users.
This is a great way of testing to obtain meaningful feedback especially when you’re introducing new features or major changes that you’re not fully confident about.
This way, you are taking less risks because it’s only people within your organization who can see the releases as opposed to your actual, external users who may be more unforgiving in case things take a bad turn during a release.
No trespassing allowed: blocking users
Just as you can pick users who you want to access your feature, you can also block users from seeing it. For example, you can block certain users from a particular country or organization.
What feature flags would allow you to do is hide some features from users who might not give you the right sort of feedback while giving access to the relevant target consumers who would be most impacted by the new feature. You can also target certain features for a certain type of user to provide a more personalized experience for them.
Managing entitlements
With feature flags, you can manage which groups of users get access to different features. This is especially common in SaaS companies that offer various membership plans and so with entitlements, you can dictate which features each plan can access. This way, you would be offering different experiences to your users.
Let’s take the example of Spotify. Spotify offers free and paid plans. With the free membership, you can stream music but with advertisements while with the premium membership, you can stream unlimited music with no ads. You also get unlimited skips and you can download music to listen to offline. There are also different levels of premium to choose from including student and family plans. Consequently, with each plan, you are entitled to different content and features.
With feature flags, you can wrap a flag around a feature and release it to a particular customer depending on their subscription plan. These types of flags are usually referred to as permission toggles. They also allow you to move features easily between the different plans i.e. paid and free versions, for example.
Managing entitlements is considered to be an advanced use case as it requires careful coordination across teams and involves working with multiple flags to control permissions for the features. The person who manages entitlements is usually on the product team so careful planning and monitoring of each change performed by which person is required.
There should also be a seamless process in place to move users from one plan to another. Thus, this use case requires vigilant implementation.
Product demos and free trials
On a similar note, product and sales teams may be looking for a way to offer prospective customers a demo or a free trial or specialized demo of a feature.
Feature flags are a great way to give prospects temporary access to certain features under various pricing plans to give them a taste of through a live demo of the features among the higher plans so they can decide if an upgrade is worth it by simply toggling these features on with a flag then turning it off once the demo is complete.
Risk mitigation
Test in production
Through the use of Feature flags, teams can confidently ship their releases by testing code directly in production to validate new features on a subset of users.
Unlike testing in a staging environment, when you test in a production environment, you can collect real-world feedback from live users to ensure that teams are building a viable pipeline of products.
Testing in production also allows you to uncover any bugs that you may have missed in the development stages and discern whether your new feature can handle a high volume of real-world usage and then optimize your features accordingly.
Feature flags and mobile app deployment: Bypass app store validation
This is when we use A/B testing to test different experiences within mobile apps. Imagine you’ve just released a brand new app or introduced a new shiny update to your app.
How can you make sure your app or this update is running smoothly or that you haven’t unintentionally introduced an update full of bugs that crashes on your users? Anything that goes wrong will involve a lengthy review process that will setback your entire release as you attempt to locate and resolve the issue.
You no longer need to wait for app store approval, which could take some time and the changes are released to all users instead of smaller segments.
Instead, with remote config implemented through feature flags, any changes can be made instantly and remotely and then released to a small subset of users to get feedback before releasing it to everyone else. Therefore, you can upgrade your app continuously in real-time based on feedback from your users without waiting on app store approval.
It’s also a good way to personalize experiences for different types of users rather than creating a unified experience for all users depending on the demographics you set forth.
As a result, with feature flags, you can roll out different versions of your mobile app to monitor their impact by releasing different features to different groups of users. Afterwards, you can decide on what features will be incorporated in the final release of your app.
Using feature flags to test out your mobile app is an excellent way to generate buzz around your release by giving exclusive access to a select number of users.
Kill Switch: Feature rollback
Using feature flags will allow you to disable a feature if it’s not working as it should. This is done by using a kill switch. Thus, whenever anything goes wrong in production, you can turn it off immediately while your team fixes the issue. This would prevent you from having to roll back the entire release so other changes can be deployed and released without worrying about delaying the whole release.
With a kill switch, you can switch off a specific, troublesome feature so you can decrease the number of users who can see it, including turning it off for all users if necessary until the issue is analyzed and resolved by your team. This way, you won’t have to go through the entire code review process to locate the issue.
Kill switches therefore give you even more control over the release process. This not only empowers your team of developers but also marketing and production teams with no software development experience who can now easily test in production and kill a feature without having to rely on engineering support.
AB Tasty offers an automatic rollback option that enables you to stop the deployment of a feature and to revert all the changes that have been made in order to ensure that your feature isn’t breaking your customer experience. This is done by defining the business KPI you want to track that would indicate the performance of your feature. If it reaches a certain value, the rollback is automatically triggered.
Sunsetting features
Feature flags can also enable the ‘sunsetting’ of features. For example, with time, you might see your usage of feature flags increasing and widening to encompass a number of features. However, this accumulation of features may eventually turn into a heavy debt.
This is why it is important to continuously keep track of which features you are using and which features have run their time and need to be retired from your system.
Sunsetting, then, enables you to kill off features that are no longer being used. Feature flags would give you an idea of the usage of certain features which would help you determine whether it’s time to kill it off, lest you end up with the dreaded technical debt.
Removing unused features and clearing up old flags is the best way to keep such hidden costs in check. Thus, you should have a careful plan in mind to remove some flags once they have served their purpose or otherwise you end up with the aforementioned technical debt. This will require you to have an efficient feature flag management system in place to track down ‘stale’ flags.
Managing migrations
Feature flags can be used to safely and effectively migrate to a new database as business requirements change and evolve. What organizations would normally do before feature flags is a one-time migration then hope for the best as rollbacks are usually a painful process.
Obviously, the biggest risk that comes with switching databases is loss of data. Therefore, developers need a way to test that the data will remain intact during the migration process.
Enter feature flags. They allow you to facilitate migration and should something go wrong, you can disable the migration by simply toggling the flag off.
A percentage rollout can then be implemented using feature flags to validate the new database and any changes can be reversed by using feature flags as a kill switch.
Read more: How to migrate from monolith to microservices architecture using feature flags
Feature flags as circuit breakers
Feature flags are particularly useful when your system is experiencing heavy load during times of exceptionally high traffic.
In particular, the on/off switch of feature flags (operational toggles) can be used as circuit breakers to disable non-critical features that add stress to the system to help your website run better and avoid any backlash from any potential downtime caused by a heavy load.
For example, many e-commerce websites experience heavy traffic during Black Friday. To avoid a potential system outage or failure, development teams can use feature flags to turn on critical features and turn off the rest until this period of heavy traffic passes to shed some of the load from a system.
Bottomline: Use feature flags often but proceed with caution
As we’ve seen so far, many of the use cases can be easily implemented. However, others will require the ability to make detailed, complex and context-specific decisions so a more advanced feature flagging system that enables such functionalities would be needed.
Regardless of what you decide to use feature flags for, one thing is clear: feature flags put you in the driver seat when it comes to releases. You are in complete control of the when and to whom you release. It also allows you to experiment to your heart’s content but without the risks, especially when the release doesn’t go as expected.
Working with feature flags also increases productivity among teams. As we’ve seen in the use cases outlined above, it’s not only developers who have complete control over and access to the release process but product and operations teams can also release and roll back as needed.
Read more: Feature flags use cases for product teams
You can use features for many things across different contexts. Some may remain for a long period of time while others need to be extracted as soon as possible so as not to accumulate technical debt.
Thus, the general advice would be to use feature flags often but keep in mind that proactive flag management and implementation will be needed to maximize the benefits while minimizing the costs.
Don’t just take our word for it. Start your feature flag journey and see for yourself what feature flags can do for you by signing up for a free trial at AB Tasty.