

We’re continuously improving Feature Experimentation & Rollouts (FE&R) to make your experience smoother, faster, and more reliable. Here are the latest updates now available:
Data Explorer: Now available in FE&R
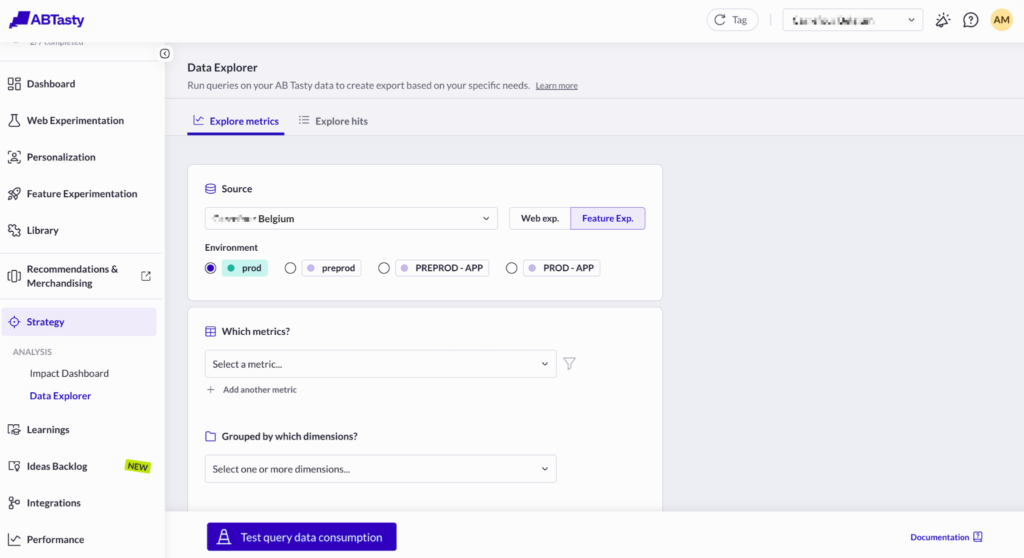
The Data Explorer, already available for Web Experimentation, is now accessible in Feature Experimentation & Rollouts. You can now explore and export your server-side data directly from the platform, without relying on external or technical tools like Postman.
With FE&R Data Explorer, you can:
- Query and export metrics (conversion rate, revenue, custom goals, NPS, action counts, etc.)
- Access and export raw hits (SDK events, API calls)
- Apply filters and dimensions (campaign, environment, feature, user properties, time range, etc.)
- Define custom date ranges and result limits
- Generate API payloads directly from the UI
This feature was one of the most requested improvements by our clients. It increases transparency, improves trust in data collection, and brings stronger consistency between client-side and server-side capabilities within One Platform.
👉 Access Data Explorer directly from your FE&R interface.
Live Hits: Real-Time QA for Server-Side
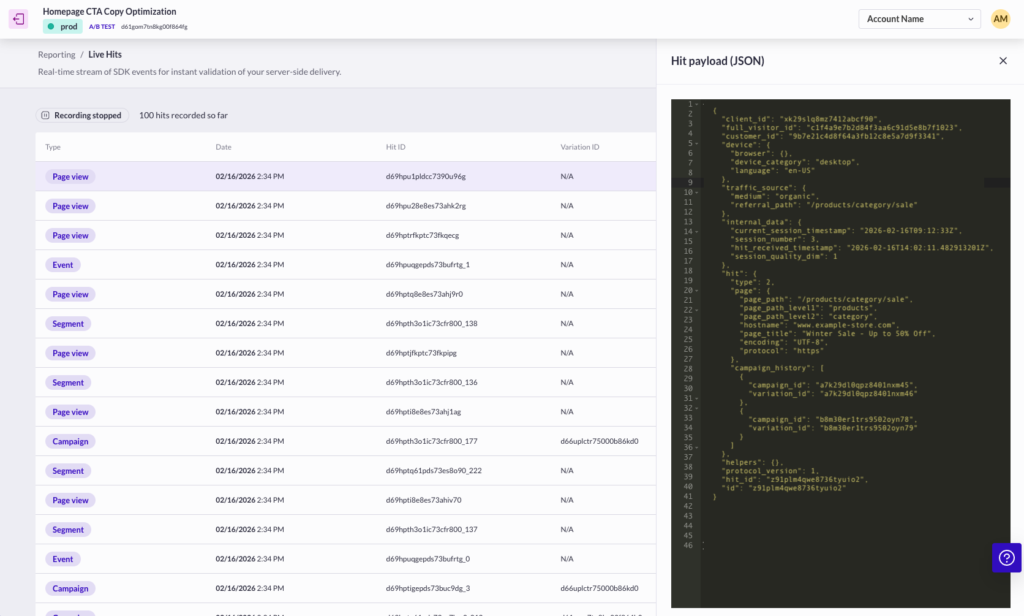
When implementing or debugging a campaign, waiting for aggregated reports can slow you down. With Live Hits, you can now visualize incoming SDK events in real time and instantly verify that your implementation is working as expected.
No more guesswork. No more waiting.
Live Hits significantly improves QA workflows and reduces implementation friction for technical teams.
You can quickly confirm:
- That events are properly triggered
- That traffic is correctly allocated
- That variations are being served as expected
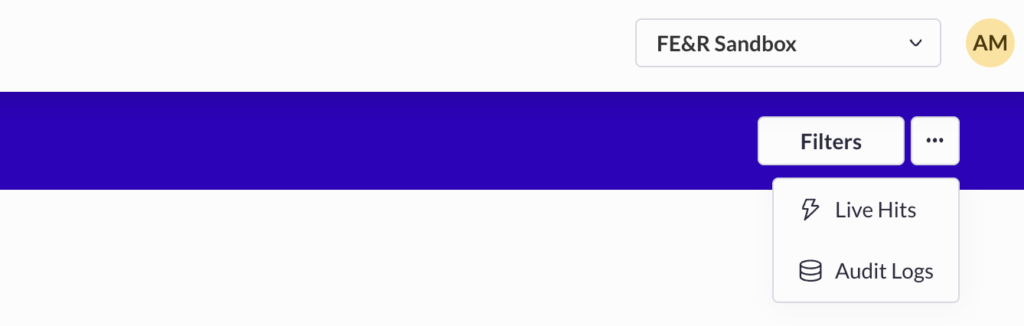
👉 Access in Reporting → Button next to the filter.
Server-Side Reporting: Evolution
AND / OR filter operators
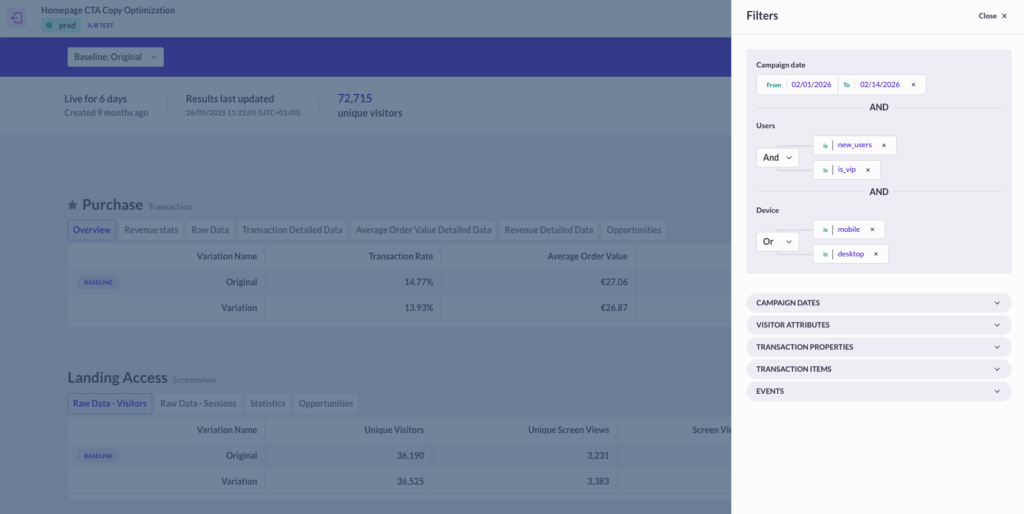
You can now switch between AND / OR operators for multiple values within the same filter type.
This gives you much more flexibility when segmenting your data and running deeper analysis directly inside your reports.
More precise segmentation means more accurate insights.
RevenueIQ*: now available for Server-Side 💰
*RevenueIQ is AB Tasty’s patented statistical engine that transforms experiment results into clear, reliable revenue projections — helping teams move from CRO to true Revenue Optimization by confidently quantifying uplift and ROI for every variation.
RevenueIQ, already available and widely adopted on client-side experimentation, is now live for server-side reports.
You can now project the financial impact of your experiments directly from your server-side reporting.
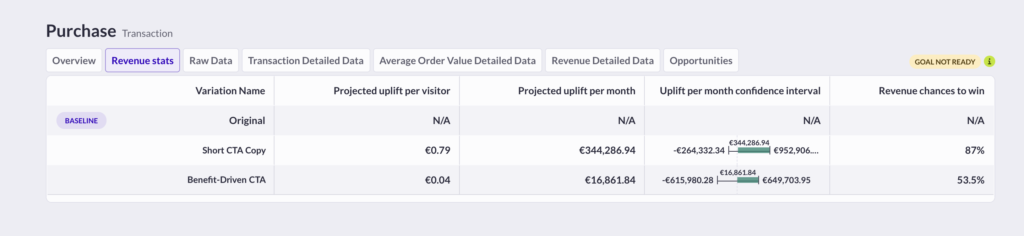
Available in any report with a transaction goal under the “Revenue stats” tab, RevenueIQ provides:
- Uplift per visitor: estimated revenue increase per visitor once deployed
- Uplift per month: projected monthly revenue impact
- Confidence intervals: lower, median, and upper revenue scenarios
- Revenue chances to win: probability that the variation will increase revenue
This means clearer decisions, fewer inconclusive experiments, and a direct view of real business impact.
You can confidently quantify and share the ROI of every server-side experiment.
Conclusion
These latest enhancements to Feature Experimentation & Rollouts are designed to empower your teams with greater transparency, flexibility, and actionable insights. With real-time data access, advanced reporting options, and robust revenue projections, you can confidently optimize your experiments and drive measurable business impact.


