

Revenue is the cornerstone of any e-commerce business, yet most optimization efforts focus only on improving conversion rates.
Average Order Value (AOV), an equally important driver of revenue, is often overlooked because it’s difficult to measure accurately with standard statistical tools. This gap can lead to missed opportunities and slow decision-making.
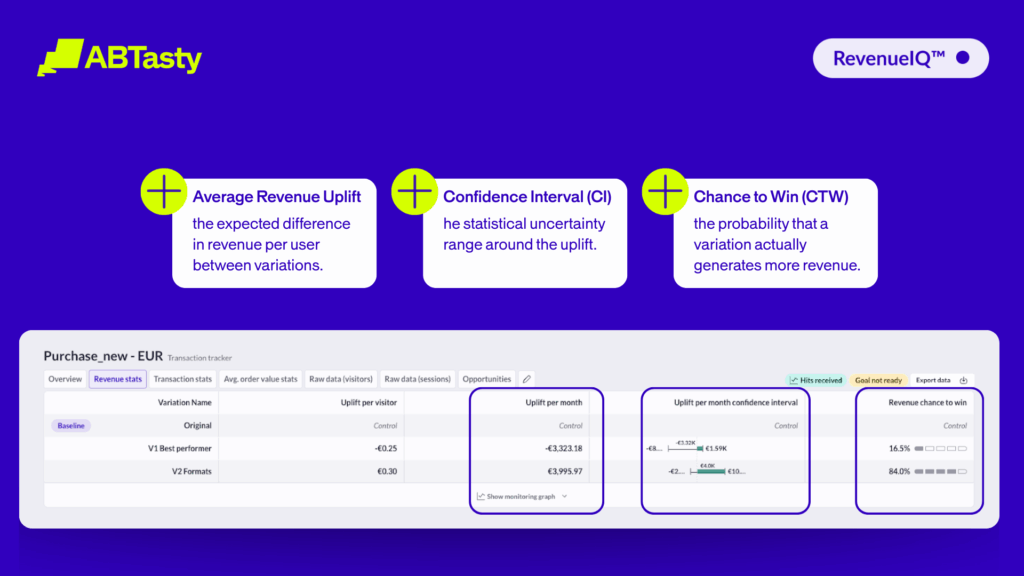
RevenueIQ addresses this challenge by providing a robust, reliable way to measure and optimize revenue directly—combining conversion and AOV into a single, actionable metric.
Here’s how RevenueIQ changes the way you approach experimentation and business growth.
Discover how to accurately measure and optimize revenue in your experiments with our patented feature.
The most important KPI in e-commerce is revenue. In an optimization context, this means focusing on two key areas:
- Conversion Rate (CR): Turning as many visitors as possible into customers.
- Average Order Value (AOV): Generating as much value as possible per customer.
However, Conversion Rate Optimization (CRO) often remains focused on conversion, while AOV is frequently neglected due to its statistical complexity. Accurately estimating AOV with classic tests (such as the t-test or Mann-Whitney) is challenging because purchase distributions are highly skewed and have no upper bound.
RevenueIQ offers a robust test that directly estimates the distribution of the effect on revenue (through a refined estimation of AOV), providing both the probability of gain (“chance to win”) and consistent confidence intervals.
In benchmarks, RevenueIQ maintains a correct false positive rate, has power close to Mann-Whitney, and produces confidence intervals four times narrower than the t-test. By combining the effects of AOV and CR, it delivers an RPV (Revenue Per Visitor) impact and then an actionable revenue projection.
Curious to learn more details? Please read our RevenueIQ Whitepaper for a full scientific explanation written by our Data Scientist, Hubert Wassner.
Context & Problem
In CRO, we often optimize CR due to a lack of suitable tools for revenue. Yet, Revenue = Visitors × CR × AOV; ignoring AOV distorts the view.
AOV is misleading because:
- It is unbounded (someone can buy many items).
- It is highly right-skewed (many small orders, a few very large ones).
- A few “large and rare” values can dominate the average.
- In random A/B splits, these large orders can be unevenly distributed, leading to huge variance in observed AOV.
Limitations of Classic Tests
t-test
Assumes normality (or relies on the Central Limit Theorem for the mean). On highly skewed e-commerce data, the CLT variance formula is unreliable at realistic volumes. The result: very low power (detects ~15% of true winners in the benchmark) and very wide confidence intervals, leading to slow and imprecise decisions.
Mann-Whitney (MW):
Robust to non-normality (works on ranks), so much more powerful (~80% detection in the benchmark). But it only provides a p-value (thus only trend information), not an estimate of effect size (no confidence interval), making it impossible to quantify the business case.
RevenueIQ: Principle
It uses and combines two innovative approaches:
- Bootstrap Technique: Studies the variability of a measure with unknown statistical behavior.
- Basket Difference Measurement: Instead of measuring the difference in average baskets, it measures the average of basket differences. It compares sorted order differences between variants (A and B), with weighting by density (approx. log-normal) to favor “comparable” pairs. This bypasses the problem of very large observed value differences in such data.
RevenueIQ then provides:
- The Chance to Win (probability that the effect is > 0), which is easy for decision-makers to interpret.
- Narrow and reliable confidence intervals on the AOV effect as well as on revenue.
Benchmarks (AOV)
- Alpha validity (on AA tests): Good control of false positives. Using a typical 95% threshold exposes only a 5% false positive risk.
- Statistical power measurement: 1000 AB tests with a known effect of +€5
- MW Test: 796/1000 winners, ~80% power.
- t-test: 146/1000, only 15% power.
- RevenueIQ: 793/1000 (≈ equivalent to MW). ~80% power.
- Confidence interval (CI): RevenueIQ produces CIs of €8 width, which is reasonable and functional in the context of a real effect of €5. With an average CI width of €34, the t-test is totally ineffective.
- CI coverage: The validity of the confidence intervals was verified. A 95% CI indeed has a 95% chance of containing the true effect value (i.e., €0 for AA tests and €5 for AB tests).
From AOV KPI to Revenue
Beyond techniques and formulas, the key point is that RevenueIQ uses a Bayesian method for AOV analysis, allowing this metric to be merged with conversion. Competitors use frequentist methods, at least for AOV, making any combination of results impossible. Under the hood, RevenueIQ combines conversion and AOV results into a central metric: visitor value (RPV). With precise knowledge of RPV, revenue (in € or other currency) is then projected by multiplying by the targeted traffic for a given period.
Real Case (excerpt) Here is a textbook case for RevenueIQ:
- Conversion gain is 92% CTW, encouraging but not “significant” by standard threshold.
- AOV gain is at 80% CTW. Similarly, taken separately, this is not enough to declare a winner.
- The combination of these two metrics gives a CTW of 95.9% for revenue, enabling a simple and immediate decision, where a classic approach would have required additional data collection while waiting for one of the two KPIs (CR or AOV) to become significant.
- For an advanced business decision, RevenueIQ provides an estimated average gain of +€50k, with a confidence interval [-€6,514; +€107,027], allowing identification of minimal risk and substantial gain.
What This Changes for Experimentation
- Without RevenueIQ: “inconclusive” results (or endless tests) lead to missed opportunities.
- With RevenueIQ: Faster, quantified decisions (probability, effect, CI), at the revenue level (RPV then projected revenue).
Practical Recommendations
- Stop interpreting observed AOV without safeguards: it is highly volatile.
- Avoid filtering/Winsorizing “extreme values”: arbitrary thresholds ⇒ bias.
- Measure CR & AOV jointly and reason in RPV to reflect business reality.
- Use RevenueIQ to obtain chance to win + CI on AOV, RPV, and revenue projection.
- Decide via projected revenue (average gain, lower CI bound) rather than isolated p-values.
Curious to learn more details? Please read our RevenueIQ Whitepaper for a full scientific explanation written by our Data Scientist, Hubert Wassner.
Conclusion
RevenueIQ brings a robust and quantitative statistical test to monetary metrics (AOV, RPV, revenue), where:
- t-test is weak and imprecise on e-commerce data,
- Mann-Whitney is powerful but not quantitative.
RevenueIQ enables faster detection, quantification of business impact, and prioritization of deployments with explicit confidence levels.
**Original information can be found by following this link to AB Tasty’s documentation, “Understanding the practical use of RevenueIQ.”


