The world of data collection has grown exponentially over the years, providing companies with crucial information to make informed decisions. However, within this complex ecosystem, a major challenge arises: data divergence.
Two analytics tools, even if they seem to be following the same guidelines, can at times produce different results. Why do they differ? How do you leverage both sets of data for your digital strategy?
In this article, we’ll use a concrete example of a user journey to illustrate differences in attribution between AB Tasty and Google Analytics. GA is a powerful tool for gathering and measuring data across the entire user journey. AB Tasty lets you easily make changes to your site and measure the impact on specific goals.
Navigating these differences in attribution strategies will explain why there can be different figures across different types of reports. Both are important to look at and which one you focus on will depend on your objectives:
- Specific improvements in cross-session user experiences
- Holistic analysis of user behavior
Let’s dive in!
Breaking it down with a simple use case
We’re going to base our analysis on a deliberately very basic use case, based on the user journey of a single visitor.
Campaign A is launched before the first session of the visitor and remains live until the end which occurs after the 3rd session of the visitor.
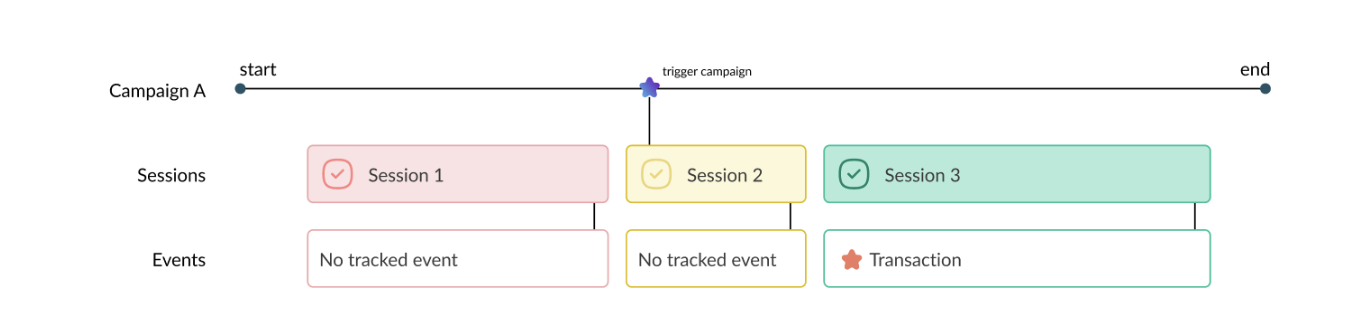
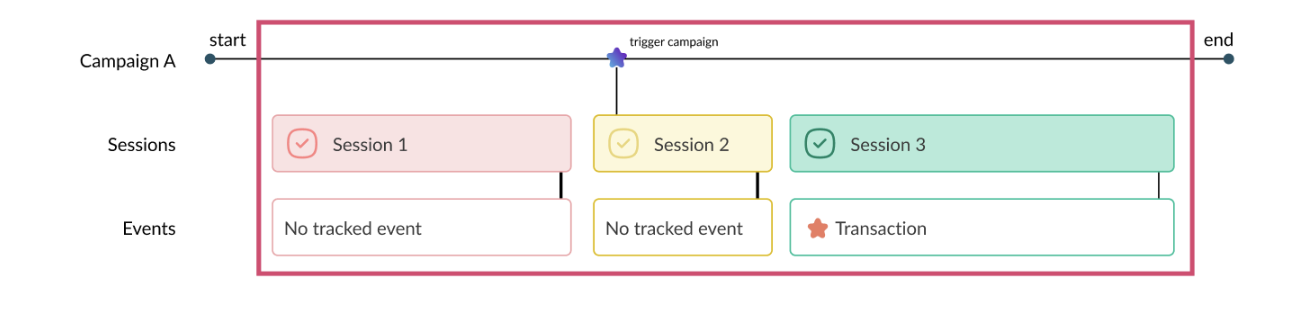
Here’s an example of the user journey we’ll be looking at in the rest of this article:
- Session 1: first visit, Campaign A is not triggered (the visitor didn’t match all of the targeting conditions)
- Session 2: second visit, Campaign A is triggered (the visitor matched all of the targeting conditions)
- Session 3: third visit, no re-triggering of Campaign A which is still live, and the user carries out a transaction.
NB A visitor triggers a campaign as soon as they meet all the targeting conditions:
- They meet the segmentation conditions
- During their session, they visit at least one of the targeted pages
- They meet the session trigger condition.
In A/B testing, a visitor exposed to a variation of a specific test will continue to see the same variation in future sessions, as long as the test campaign is live. This guarantees reliable measurement of potential changes in behavior across all sessions.
We will now describe how this user journey will be taken into account in the various AB Tasty and GA reports.
Analysis in AB Tasty
In AB Tasty, there is only one report and therefore only one attribution per campaign.
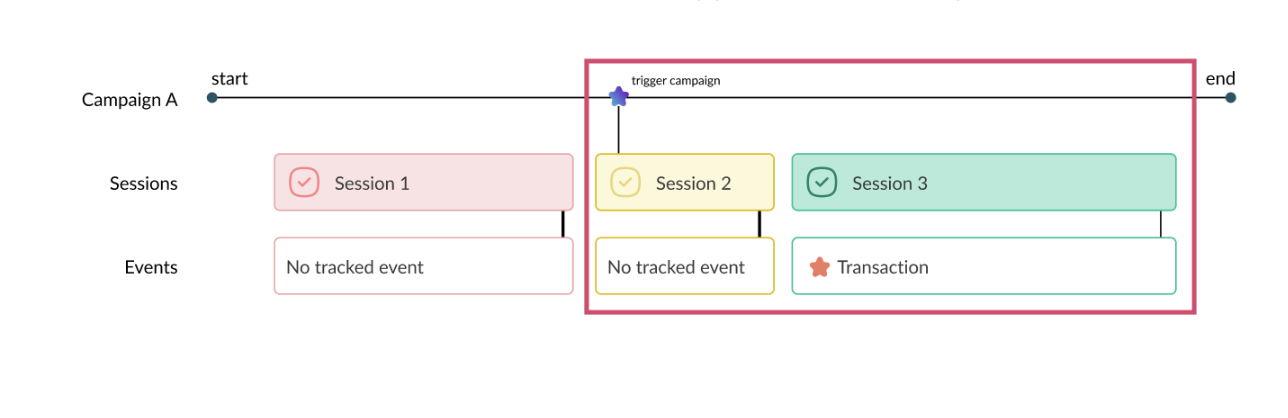
The user journey above will be reported as follows for Campaign A:
- Total Users (Unique visitors) = 1, based on a unique user ID contained in a cookie; here there is only one user in our example.
- Total Session = 2, s2 and s3, which are the sessions that took place during and after the display of Campaign A, are taken into account even if s3 didn’t re-trigger campaign A
- Total Transaction = 1, the s3 transaction will be counted even if s3 has not re-triggered Campaign A.
In short, AB Tasty will collect and display in Campaign A reporting all the visitor’s sessions and events from the moment the visitor first triggered the campaign.
Analysis in Google Analytics
The classic way to analyze A/B test results in GA is to create an analysis segment and apply it to your reports.
However, this segment can be designed using 2 different methods, 2 different scopes, and depending on the scope chosen, the reports will not present the same data.
Method 1: On a user segment/user scope
Here we detail the user scope, which will include all user data corresponding to the segment settings.
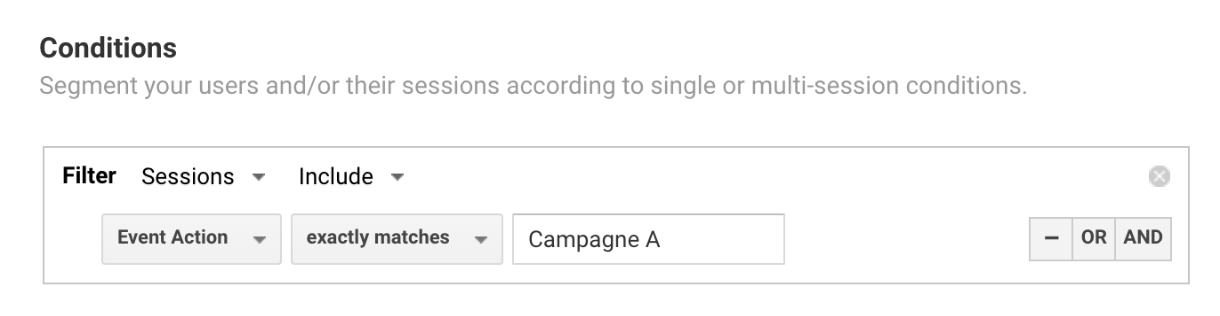
In our case, the segment setup might look something like this:
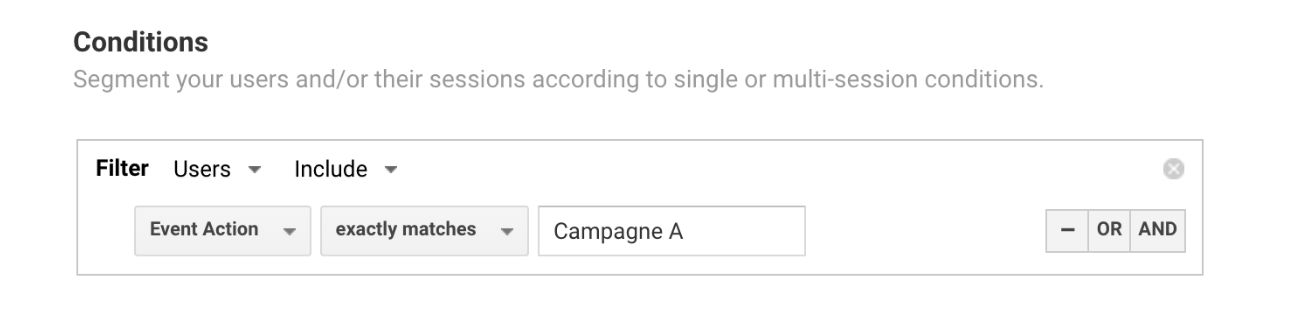
This segment will therefore include all data from all sessions of all users who, at some point during the analysis date range, have received an event with the parameter event action = Campaign A.
We can then see in the GA report for our user journey example:
- Total User = 1, based on a user ID contained in a cookie (like AB Tasty); here there is only one user in our example
- Total Session = 3, s1, s2 and s3 which are the sessions created by the same user entering the segment and therefore includes all their sessions
- Total Transaction = 1, transaction s3 will be counted as it took place in session s3 after the triggering of the campaign.
In short, in this scenario, Google Analytics will count and display all the sessions and events linked to this single visitor (over the selected date range), even those prior to the launch of Campaign A.
Method 2: On a session segment/session scope
The second segment scope detailed below is the session scope. This includes only the sessions that correspond to the settings.
In this second case, the segment setup could look like this:
This segment will include all data from sessions that have, at some point during the analysis date range, received an event with the parameter event action = Campaign A.
As you can see, this setting will include fewer sessions than the previous one.
In the context of our example:
- Total User = 1, based on a user ID contained in a cookie (like AB Tasty), here there’s only one user in our example
- Total Session = 1, only s2 triggers campaign A and therefore sends the campaign event
- Total Transaction = 0, the s3 transaction took place in the s3 session, which does not trigger campaign A and therefore does not send an event, so it is not taken into account.
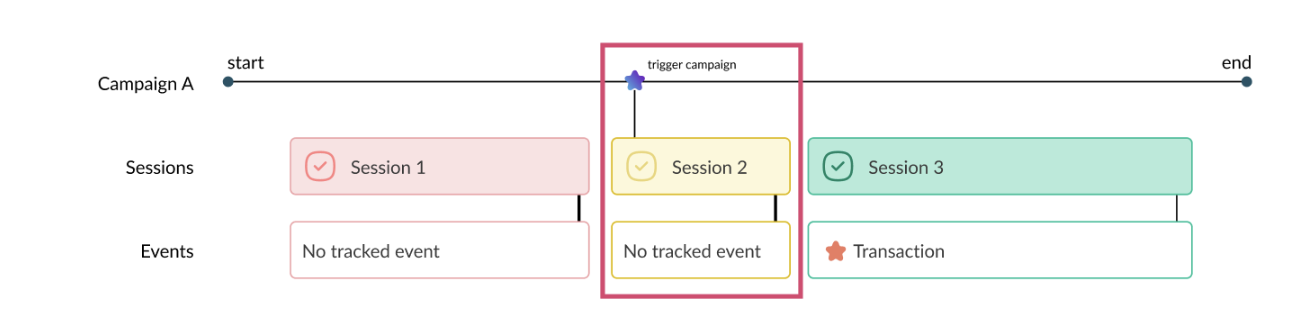
In short, in this case, Google Analytics will count and display all the sessions – and the events linked to these sessions – that triggered campaign A, and only these.
Attribution model
| Tool – scope |
Counted in the selected timeframe |
| AB Tasty |
All sessions and events that took place after the visitor first triggered campaign A |
| Google Analytics – user scope |
All sessions and events of a user that triggered campaign A at least once during one their sessions |
| Google Analytics – session scope |
Only sessions that have triggered campaign A |
Different attribution for different objectives
Depending on the different attributions of the various reports, we can observe different figures without the type of tracking being different.
The only metric that always remains constant is the sum of Users (Unique visitors in AB Tasty). This is calculated in a similar (but not identical) way between the 2 tools. It’s therefore the benchmark metric, and also the most reliable for detecting malfunctions between A/B testing tools and analytics tools with different calculations.
On the other hand, the attribution of sessions or events (e.g. a transaction) can be very different from one report to another. All the more so as it’s not possible in GA to recreate a report with an attribution model similar to that of AB Tasty.
Ultimately, A/B test performance analysis relies heavily on data attribution, and our exploration of the differences between AB Tasty and Google Analytics highlighted significant distinctions in the way these tools attribute user interactions. These divergences are the result of different designs and distinct objectives.
From campaign performance to holistic analysis: Which is the right solution for you?
AB Tasty, as a solution dedicated to the experimentation and optimization of user experiences, stands out for its more specialized approach to attribution. It offers a clear and specific view of A/B test performance, by grouping attribution data according to campaign objectives.
Making a modification on a platform and testing it aims to measure the impact of this modification on the performance of the platform and its metrics, during the current session and during future sessions of the same user.
On the other hand, Google Analytics focuses on the overall analysis of site activity. It’s a powerful tool for gathering data on the entire user journey, from traffic sources to conversions. However, its approach to attribution is broader, encompassing all session data, which can lead to different data cross-referencing and analysis than AB Tasty, as we have seen in our example.
It’s essential to note that one is not necessarily better than the other, but rather adapted to different needs.
- Teams focusing on the targeted improvement of cross-session user experiences will find significant value in the attribution offered by AB Tasty.
- On the other hand, Google Analytics remains indispensable for the holistic analysis of user behavior on a site.
The key to effective use of these solutions lies in understanding their differences in attribution, and the ability to exploit them in complementary ways. Ultimately, the choice will depend on the specific objectives of your analysis, and the alignment of these tools with your needs will determine the quality of your insights.