Average Order Value (AOV) is a widely used metric in Conversion Rate Optimization (CRO), but it can be surprisingly deceptive. While the formula itself is simple—summing all order values and dividing by the number of orders—the real challenge lies within the data itself.
The problem with averaging
AOV is not a “democratic” measure. A single high-spending customer can easily spend 10 or even 100 times more than your average customer. These few extreme buyers can heavily skew the average, giving a limited number of visitors disproportionate impact compared to hundreds or thousands of others. This is problematic because you can’t truly trust the significance of an observed AOV effect if it’s tied to just a tiny fraction of your audience.
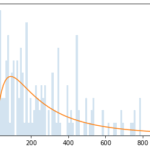
Let’s look at a real dataset to see just how strong this effect can be. Consider the order value distribution:
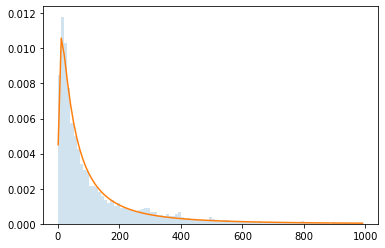
- The horizontal axis represents the order value.
- The vertical axis represents the frequency of that order value.
- The blue surface is a histogram, while the orange outline is a log-normal distribution approximation.
This graph shows that the most frequent order values are small, around €20. As the order value increases, the frequency of such orders decreases. This is a “long/heavy tail distribution,” meaning very large values can occur, albeit rarely.
A single strong buyer with an €800 order value is worth 40 times more than a frequent buyer when looking at AOV. This is an issue because a slight change in the behavior of 40 visitors is a stronger indicator than a large change from one unique visitor. While not fully visible on this scale, even more extreme buyers exist.
The next graph, using the same dataset, illustrates this better:
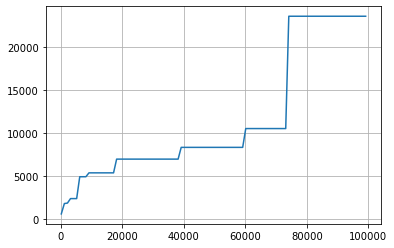
- The horizontal axis represents the size of the growing dataset of order values (roughly indicating time).
- The vertical axis represents the maximum order value in the growing dataset in €
At the beginning of data collection, the maximum order value is quite small (close to the most frequent value of ~€20). However, we see that it grows larger as time passes and the dataset expands. With a dataset of 10,000 orders, the maximum order value can exceed €5,000. This means any buyer with an order above €5,000 (they might have multiple) holds 250 times the power of a frequent buyer at €20. At the maximum dataset size, a single customer with an order over €20,000 can influence the AOV more than 2,000 other customers combined.
When looking at your e-commerce metrics, AOV should not be used as a standalone decision-making data.
E-commerce moves fast. Get the insights that help you move faster. Download the 2025 report now.
The challenge of AB Test splitting
The problem intensifies when considering the random splits used in A/B tests.
Imagine you have only 10 very large spenders whose collective impact equals that of 10,000 medium buyers. There’s a high probability that the random split for such a small group of users will be uneven. While the overall dataset split is statistically even, the disproportionate impact of these high spenders on AOV requires specific consideration for this small segment. Since you can’t predict which visitor will become a customer or how much they will spend, you cannot guarantee an even split of these high-value users.
This phenomenon can artificially inflate or deflate AOV in either direction, even without a true underlying effect, simply depending on which variation these few high spenders land on.
What’s the solution?
AOV is an unreliable metric, how can we effectively work with it? The answer is similar to how you approach conversion rates and experimentation.
You don’t trust raw conversion data—one more conversion on variation B doesn’t automatically make it a winner, nor do 10 or 100. Instead, you rely on a statistical test to determine when a difference is significant. The same principle applies to AOV. Tools like AB Tasty offer the Mann-Whitney test, a statistical method robust against extreme values and well-suited for long-tail distributions.
AOV behavior can be confusing because you’re likely accustomed to the more intuitive statistics of conversion rates. Conversion data and their corresponding statistics usually align; a statistically significant increase in conversion rate typically means a visibly large difference in the number of conversions, consistent with the statistical test. However, this isn’t always the case with AOV. It’s not uncommon to see the AOV trend and the statistical results pointing in different directions. Your trust should always be placed in the statistical test.
The root cause: Heavy tail distributions
You now understand that the core issue stems from the unique shape of order value distributions: long-tail distributions that produce rare, extreme values.
It’s important to note that the problem isn’t just the existence of extreme values. If these extreme values were frequent, the AOV would naturally be higher, and their impact would be less dramatic because the difference between the AOV and these values would be smaller. Similarly, for the splitting problem, a larger number of extreme values would ensure a more even split.
At this point, you might think your business has a different order distribution shape and isn’t affected. However, this shape emerges whenever these two conditions are met:
- You have a price list with more than several dozen different values.
- Visitors can purchase multiple products at once.
Needless to say, these conditions are ubiquitous and apply to nearly every e-commerce business. The e-commerce revolution itself was fueled by the ability to offer vast catalogues.
Furthermore, the presence of shipping costs naturally encourages users to group their purchases to minimize those costs. It means that nearly all e-commerce businesses are affected. The only exceptions are subscription-based businesses with limited pricing options, where most purchases are for a single service.
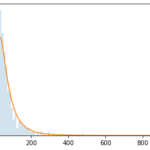
Here’s a glimpse into the order value distribution across various industries, demonstrating the pervasive nature of the “long tail distribution”:
Cosmetic
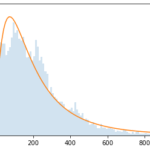
Transportation
B2B packaging (selling packaging for e-commerce)
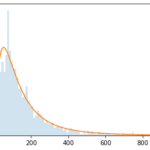
Fashion
online flash sales
AOV, despite its simple definition and apparent ease of understanding, is a misleading metric. Its magnitude is easy to grasp, leading people to confidently make intuitive decisions based on its fluctuations. However, the reality is far more complex; AOV can show dramatic changes even when there’s no real underlying effect.
Conversely, significant changes can go unnoticed. A strong negative effect could be masked by just a few high-spending customers landing in a poorly performing variation. So, now you know: just as you do for conversion rates, rely on statistical tests for your AOV decisions.


