

When it comes to CRO, or Conversion Rate Optimization, it would be natural to assume that conversion is all that matters. At least, we can argue that conversion rate is at the heart of most experiments. However, the ultimate goal is to raise revenue, so why does the CRO world put so much emphasis on conversion rates?
In this article, we’ll shed some light on the reason why conversion rate is important and why it’s not just conversions that should be considered.
Why is conversion rate so important?
Let’s start off with the three technical reasons why CRO places such importance on conversion rates:
- Conversion is a generic term. It covers the fact that an e-commerce visitor becomes a customer by buying something, or simply the fact that this visitor went farther than just the homepage, or clicks on a product page, or adds this product to the cart. In that sense, it’s the Swiss Army Knife of CRO.
- Conversion statistics are far easier than other KPI statistics, and they’re the simplest from a maths point of view. In terms of measurement, it’s pretty straightforward: success or failure.
This means off-the-shelf code or simple spreadsheet formulas can compute statistics indices for decision, like the chance to win or confidence intervals about the expected gain. This is not that easy for other metrics as we will see later with Average Order Value (AOV). - Conversion analysis is also the simplest when it comes to decision-making. There’s (almost) no scenario where raising the number of conversions is a bad thing. Therefore, deciding whether or not to put a variation in production is an easy task when you know that the conversion rate will rise. The same can’t be said about the “multiple conversions” metric where, unlike the conversion rate metric that counts one conversion per visitor even if this visitor made 2 purchases, every conversion counts and so is often more complex to analyze. For example, the number of product pages seen by an e-commerce visitor is harder to interpret. A variation increasing this number could have several meanings: the catalog can be seen as more engaging or it could mean that visitors are struggling to find what they’re looking for.
Due to the aforementioned reasons, the conversion rate is the starting point of all CRO journeys. However, conversion rate on its own is not enough. It’s also important to pay attention to other factors other than conversions to optimize revenue.
Beyond conversion rate
Before we delve into a more complex analysis, we’ll take a look at some simpler metrics. This includes ones that are not directly linked to transactions such as “add to cart” or “viewed at least one product page”.
If it’s statistically assured to win, then it’s a good choice to put the variation into production, with one exception. If the variation is very costly, then you will need to dig deeper to ensure that the gains will cover the costs. This can occur, for example, if the variation holds a product recommender system that comes with its cost.
The bounce rate is also simple and straightforward in that the aim is to keep the figure down unlike the conversion rate. In this case, the only thing to be aware of is that you want to lower the bounce rate unlike the conversion rate. But the main idea is the same: if you change your homepage image and you see the bounce rate statistically drop, then it’s a good idea to put it in production.
We will now move onto a more complex metric, the transaction rate, which is directly linked to the revenue.
Let’s start with a scenario where the transaction rate goes up. You assume that you will get more transactions with the same traffic, so the only way it could be a bad thing is that you earn less in the end. This means your average cart value (AOV) has plummeted. The basic revenue formula shows it explicitly:
Total revenue = traffic * transaction rate * AOV
Since we consider traffic as an external factor, then the only way to have a higher total revenue is to have an increase in both transaction rate and AOV or have at least one of them increase while the other remains stable. This means we also need to check the AOV evolution, which is much more complicated.
On the surface, it looks simple: take the sum of all transactions and divide that by the number of transactions and you have the AOV. While the formula seems basic, the data isn’t. In this case, it’s not just either success or failure; it’s different values that can widely vary.
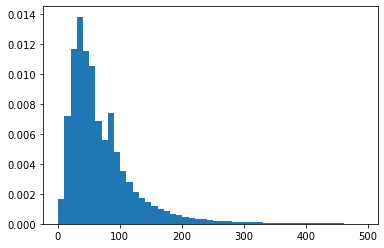
Below is a histogram of transaction values from a retail ecommerce website. The horizontal axis represents values (in €), the vertical axis is the proportion of transactions with this value. Here we can see that most values are spread between 0 and €200, with a peak at ~€50.
The right part of this curve shows a “long/fat tail”. Now let’s try to see how the difference within this kind of data is hard to spot. See the same graph below but with higher values, from €400 to €1000. You will also notice another histogram (in orange) of the same values but offset by €10.

We see that the €10 offset which corresponds to a 10-unit shift to the right is hard to distinguish. And since it corresponds to the highest values this part has a huge influence when averaging samples. Due to the shape of this transaction value distribution, any measure of the average value is somewhat blurred, which makes it very difficult to have clear statistical indices. For this reason, changes in AOV need to be very drastic or measured over a huge dataset to be statistically asserted, making it difficult to use in CRO.
Another important feature is hidden even further on the right of the horizontal axis. Here’s another zoom on the same graph, with the horizontal axis ranging from €1000 to €4500. This time only one curve is shown.
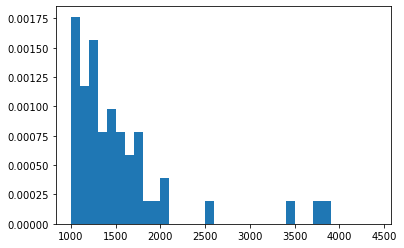
From the previous graph, we could have easily assumed that €1000 was the end, but it’s not. Even with a most common transaction value at €50, there are still some transactions above €1000, and even some over €3000. We call these extreme values.
As a result, whether these high values exist or not makes a big difference. Since these values exist but with some scarcity, they will not be evenly spread across a variation, which can artificially create difference when computing AOV. By artificially, we mean the difference comes from a small number of visitors and so doesn’t really count as “statistically significant”. Also, keep in mind that customer behavior will not be the same when buying for €50 as when making a purchase of more than €3000.
There’s not much to do about this except know it exists. One good thing though is to separate B2B and B2C visitors if you can, since B2C transaction values are statistically bigger and less frequent. Setting them apart will limit these problems.
What does this mean for AOV?
There are three important things to keep in mind when it comes to AOV:
- Don’t trust the basic AOV calculation; the difference you are seeing probably does not exist, and is quite often not even in the same observed direction! It’s only displayed to give an order of magnitude to interpret changes in conversion rates but shouldn’t be used to state a difference between variations’ AOV. That’s why we use a specific test, the Mann-Whitney U test, that’s adapted for this kind of data.
- You should only believe the statistical index on AOV, which is only valid to assess the direction of the difference between AOV, not its size. For example, you notice a +€5 AOV difference and the statistical index is 95%; this only means that you can be 95% sure that you will have an AOV gain, but not that it will be €5.
- Since transaction data is far more wild than conversion data, it will need stronger differences or bigger datasets to reach statistical significance. But since there are always fewer transactions than visitors, reaching significance on the conversion rate doesn’t imply being significant on AOV.
This means that a decision on a variation that has a conversion rate gain can still be complex because we rarely have a clear answer about the variation effect on the AOV.
This is yet another reason to have a clear experimentation protocol including an explicit hypothesis.
For example, if the test is about showing an alternate product page layout based on the hypothesis that visitors have trouble reading the product page, then the AOV should not be impacted. Afterwards, if the conversion rate rises, we can validate the winner if the AOV has no strong statistical downward trend. However, if the changes are in the product recommender system, which might have an impact on the AOV, then one should be more strict on measuring a statistical innocuity on the AOV before calling a winner. For example, the recommender might bias visitors toward cheaper products, boosting sales numbers but not the overall revenue.
The real driving force behind CRO
We’ve seen that the conversion rate is at the base of CRO practice because of its simplicity and versatility compared to all other KPIs. Nonetheless, this simplicity must not be taken for granted. It sometimes hides more complexity that needs to be understood in order to make profitable business decisions, which is why it’s a good idea to have expert resources during your CRO journey.
That’s why at AB Tasty, our philosophy is not only about providing top-notch software but also Customer Success accompaniment.


