Optimization starts with analyzing, not guessing.
Find out how users actually navigate your website or app. Behavioral analytics is built for teams who want to fix friction, not just report it.
What teams discover when they start looking
Behavioral data changes the questions teams ask. These are the kinds of decisions it enables.

Generate informed experiment ideas
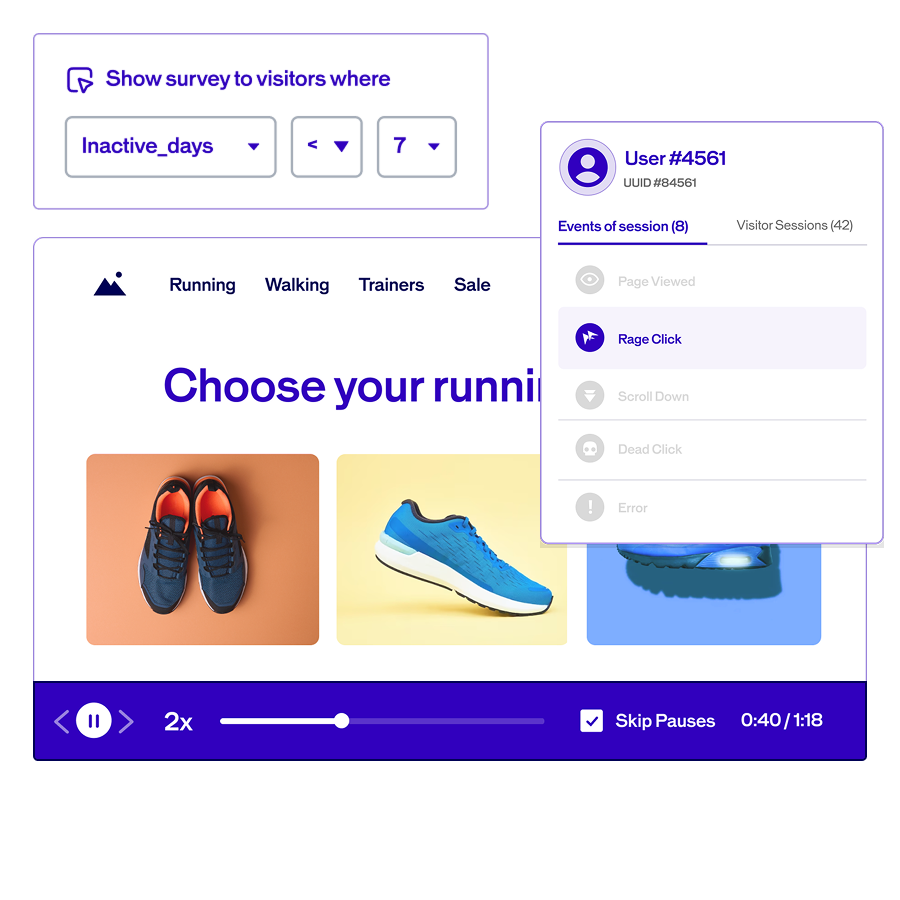
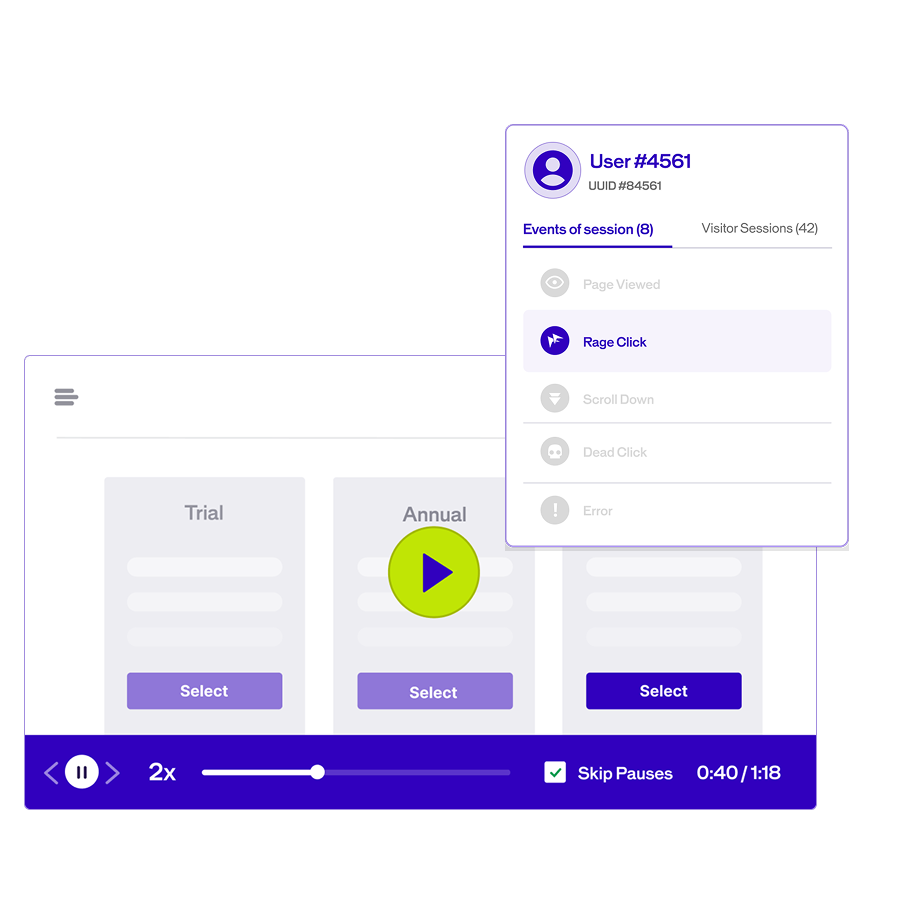
Session recordings and scrollmaps surface exactly which pages are losing users and where. Teams stop guessing what to test and start prioritizing based on evidence.
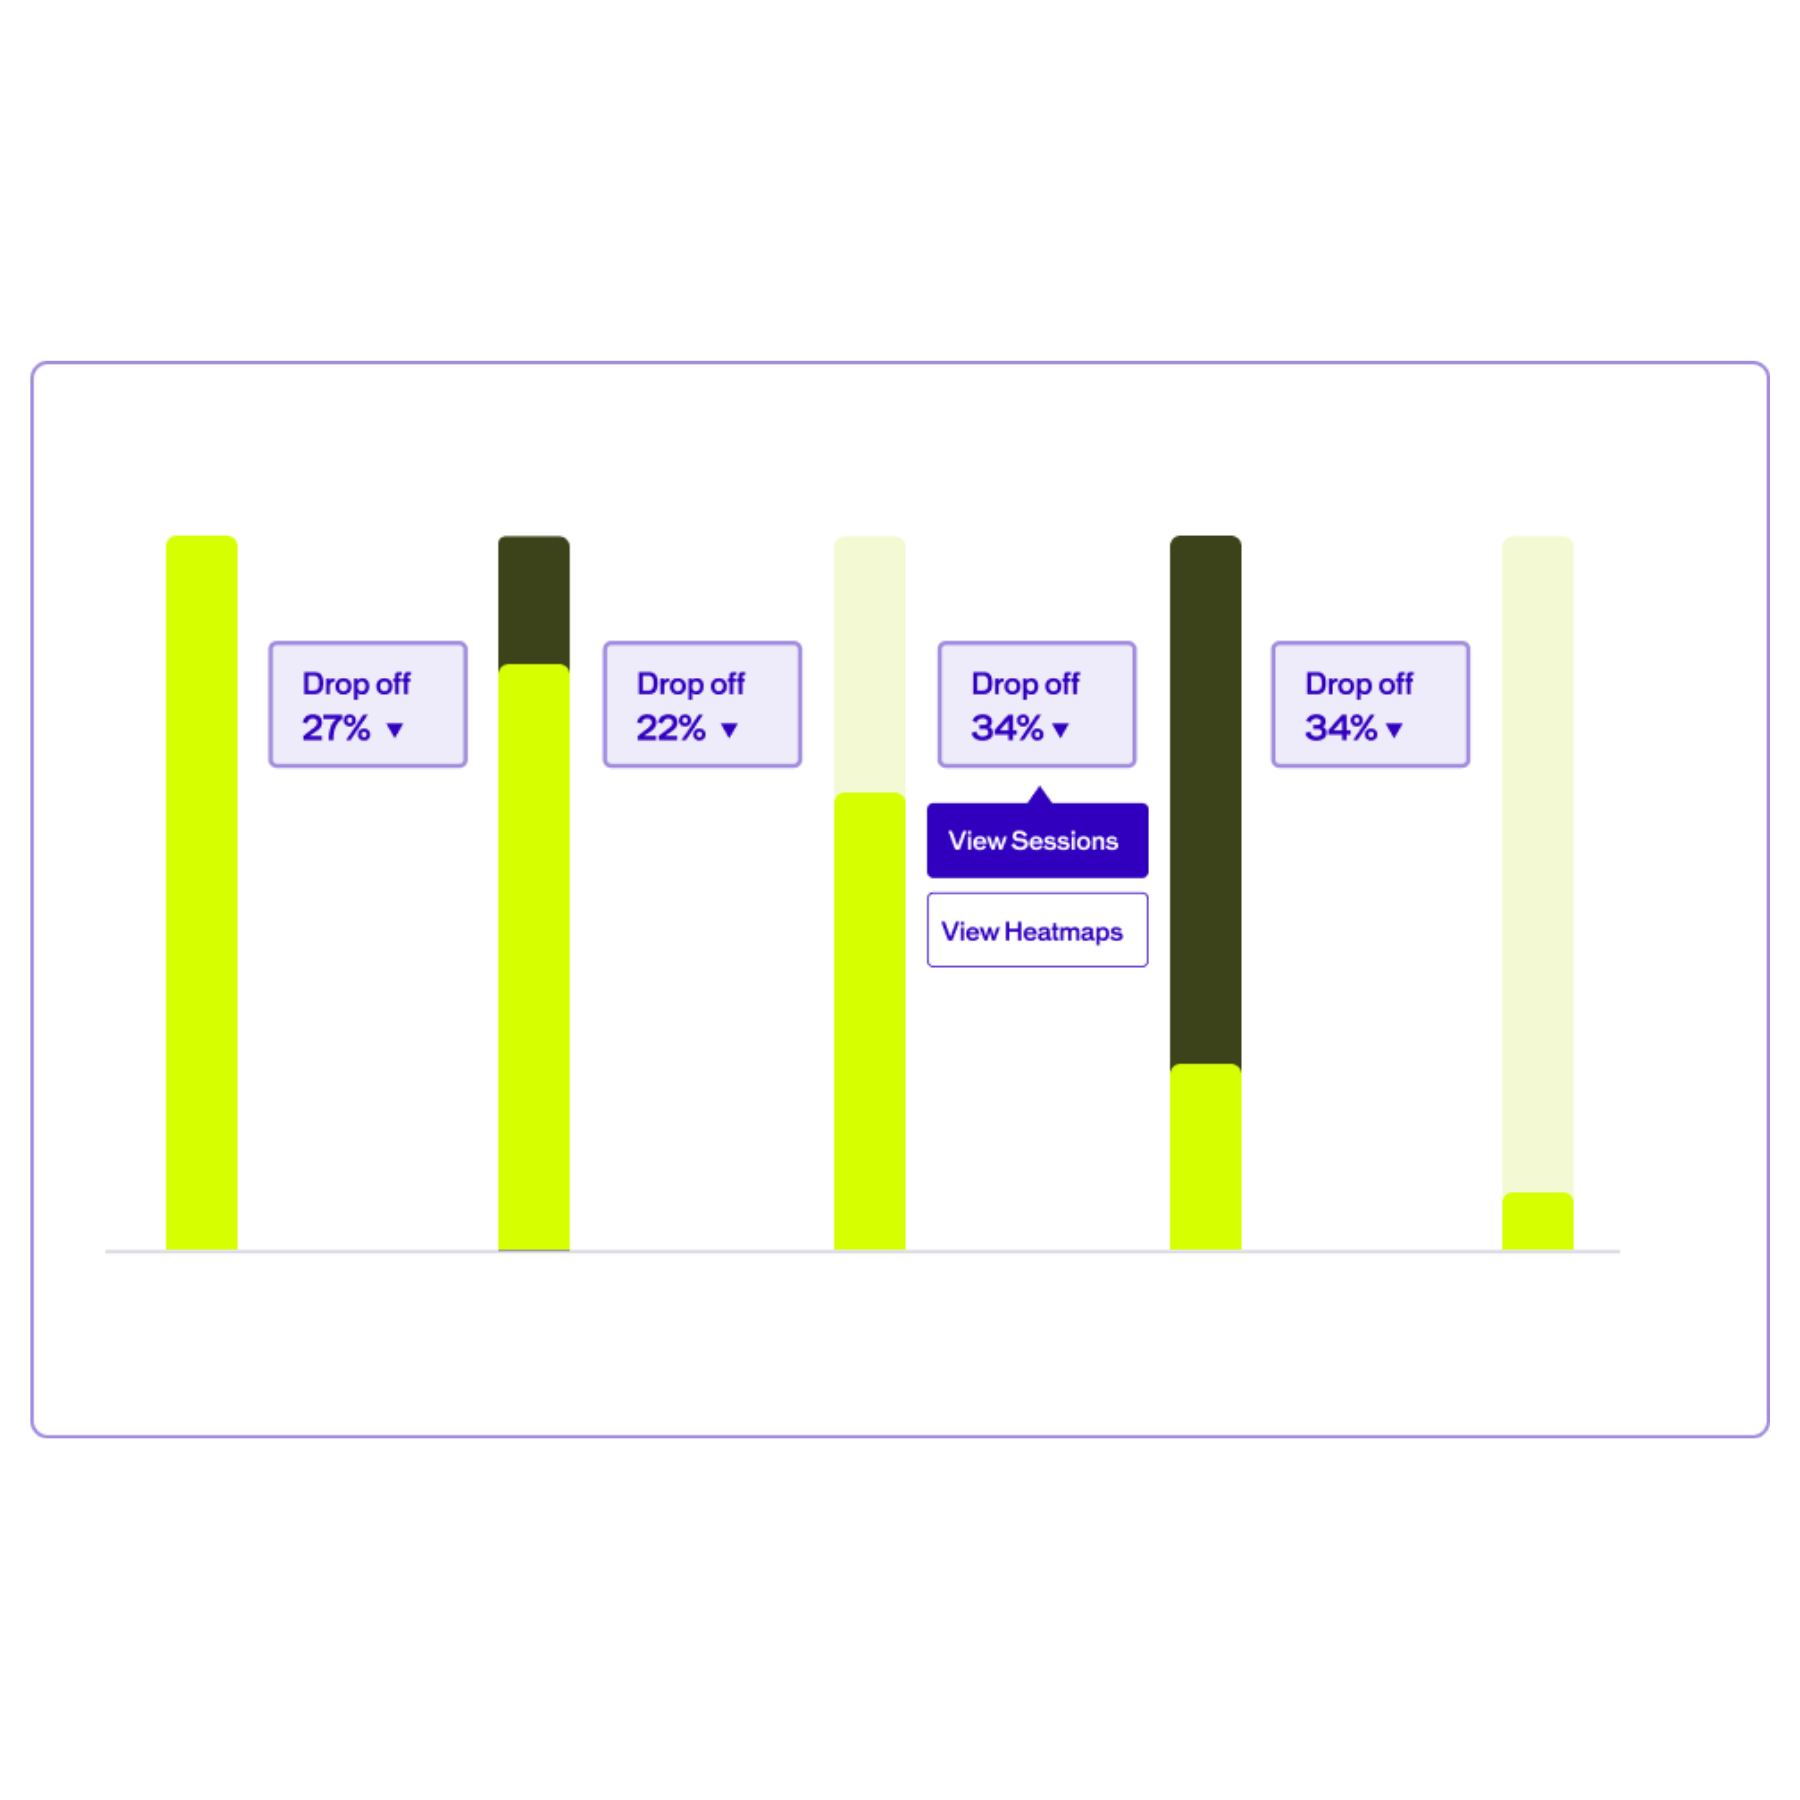
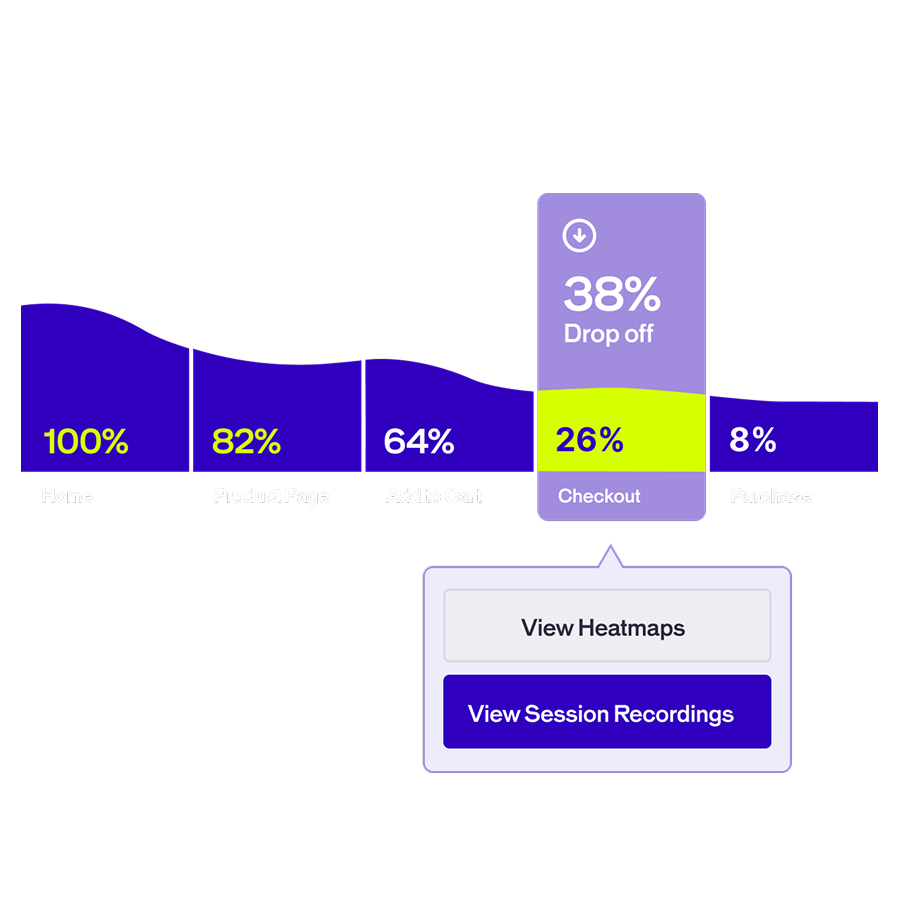
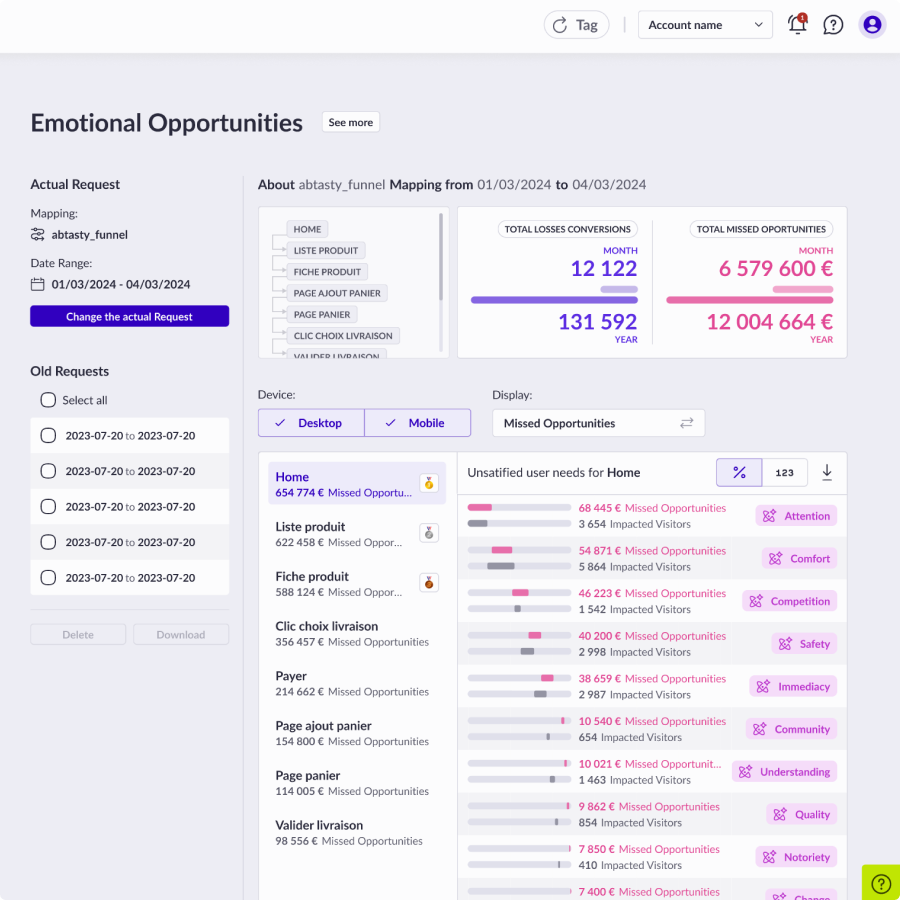
Find where your funnel loses people and why
Funnel drop-off data paired with session replay means you stop guessing which step has a problem and start watching it happen.

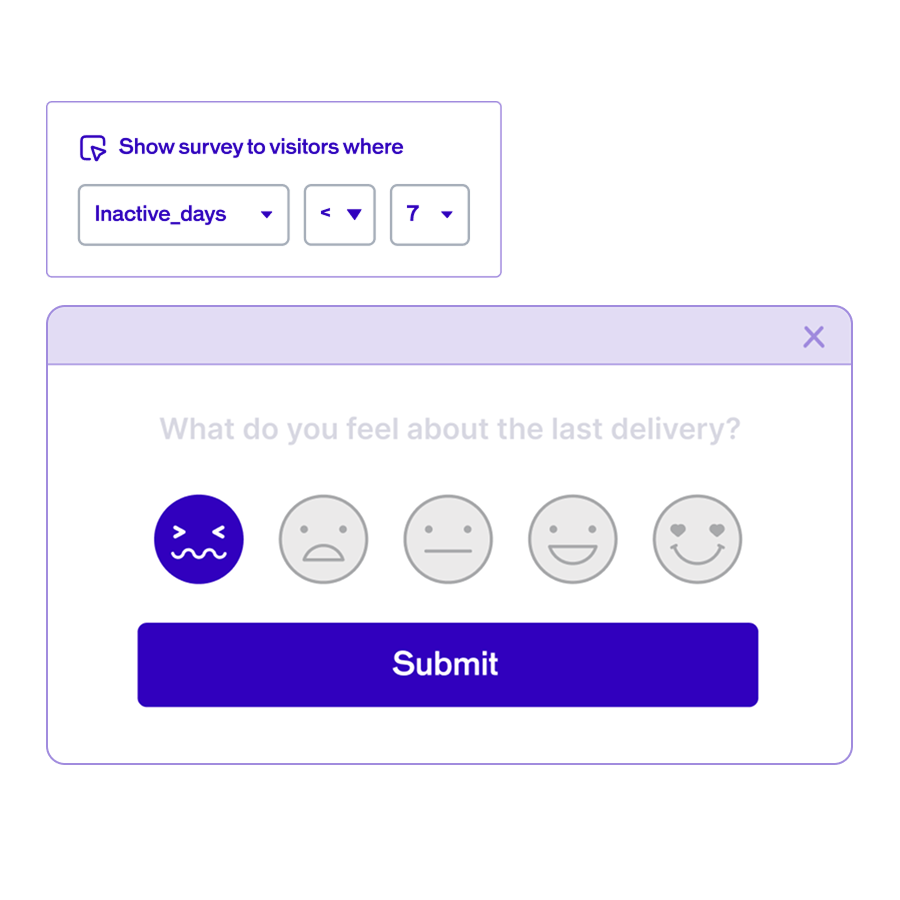
Resolve UX friction before it becomes churn
Experience scores automatically flag high-friction sessions. Fix the issues your support tickets haven’t caught yet.
Insights for your whole team
Easy enough for every team to use, yet powerful enough to solve complex conversion challenges for building better experiences.

Marketing Teams
Turn traffic into evidence, not just numbers
- Identify engagement gaps across pages and campaigns
- Build data-backed hypotheses for A/B test ideation
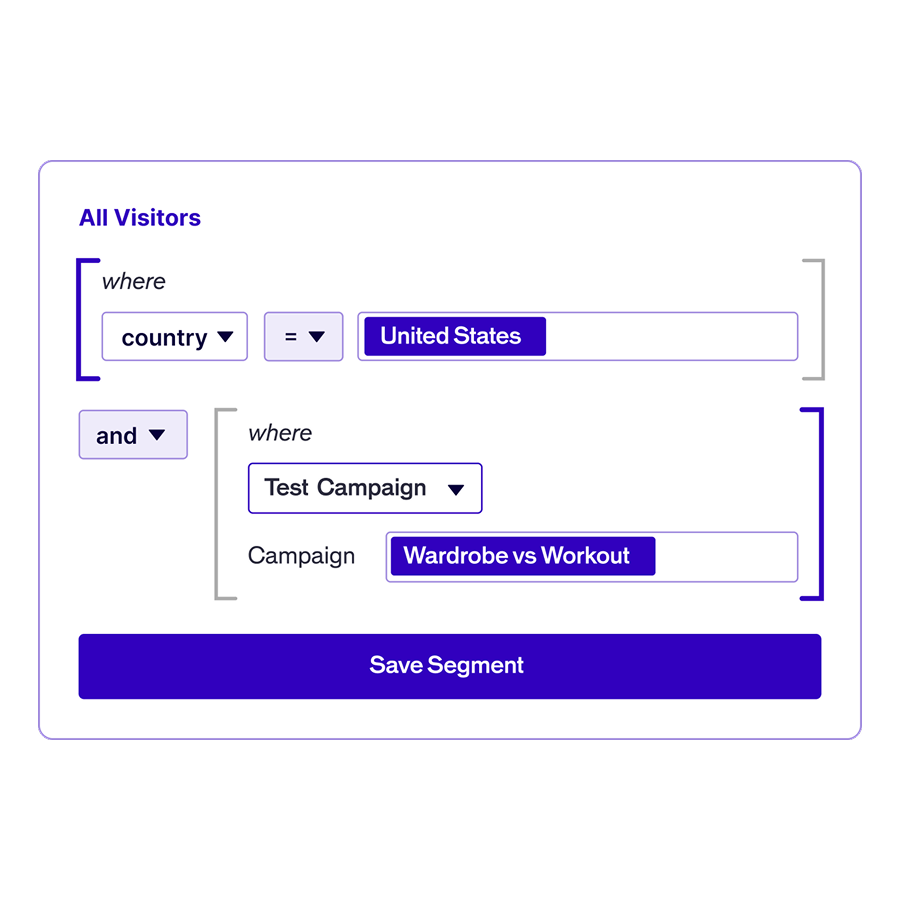
- Understand how different audience segments behave
- Track drop-offs across acquisition sources

Product Teams
Put user behavior at the center of every release decision
- Prioritize features by observed user need, not assumption
- Detect UX issues before support tickets arrive
- Validate design decisions with real interaction data
- Surface friction by segment and device type

UX Research
Accelerate research with visual behavioral data
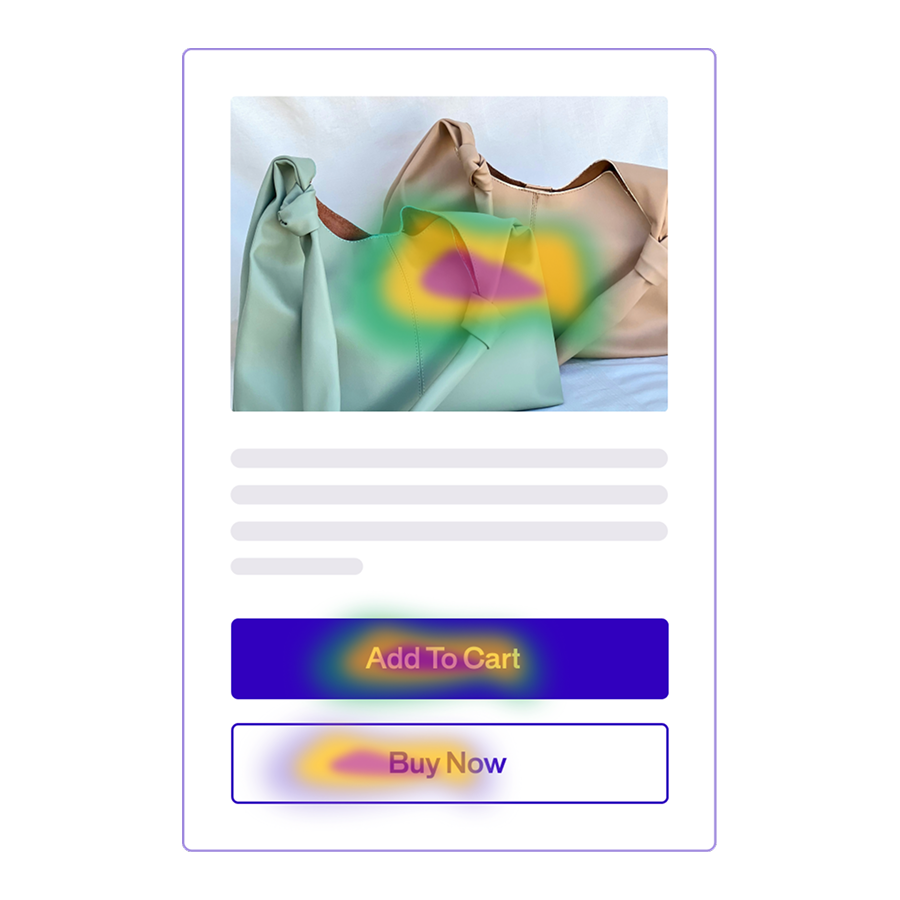
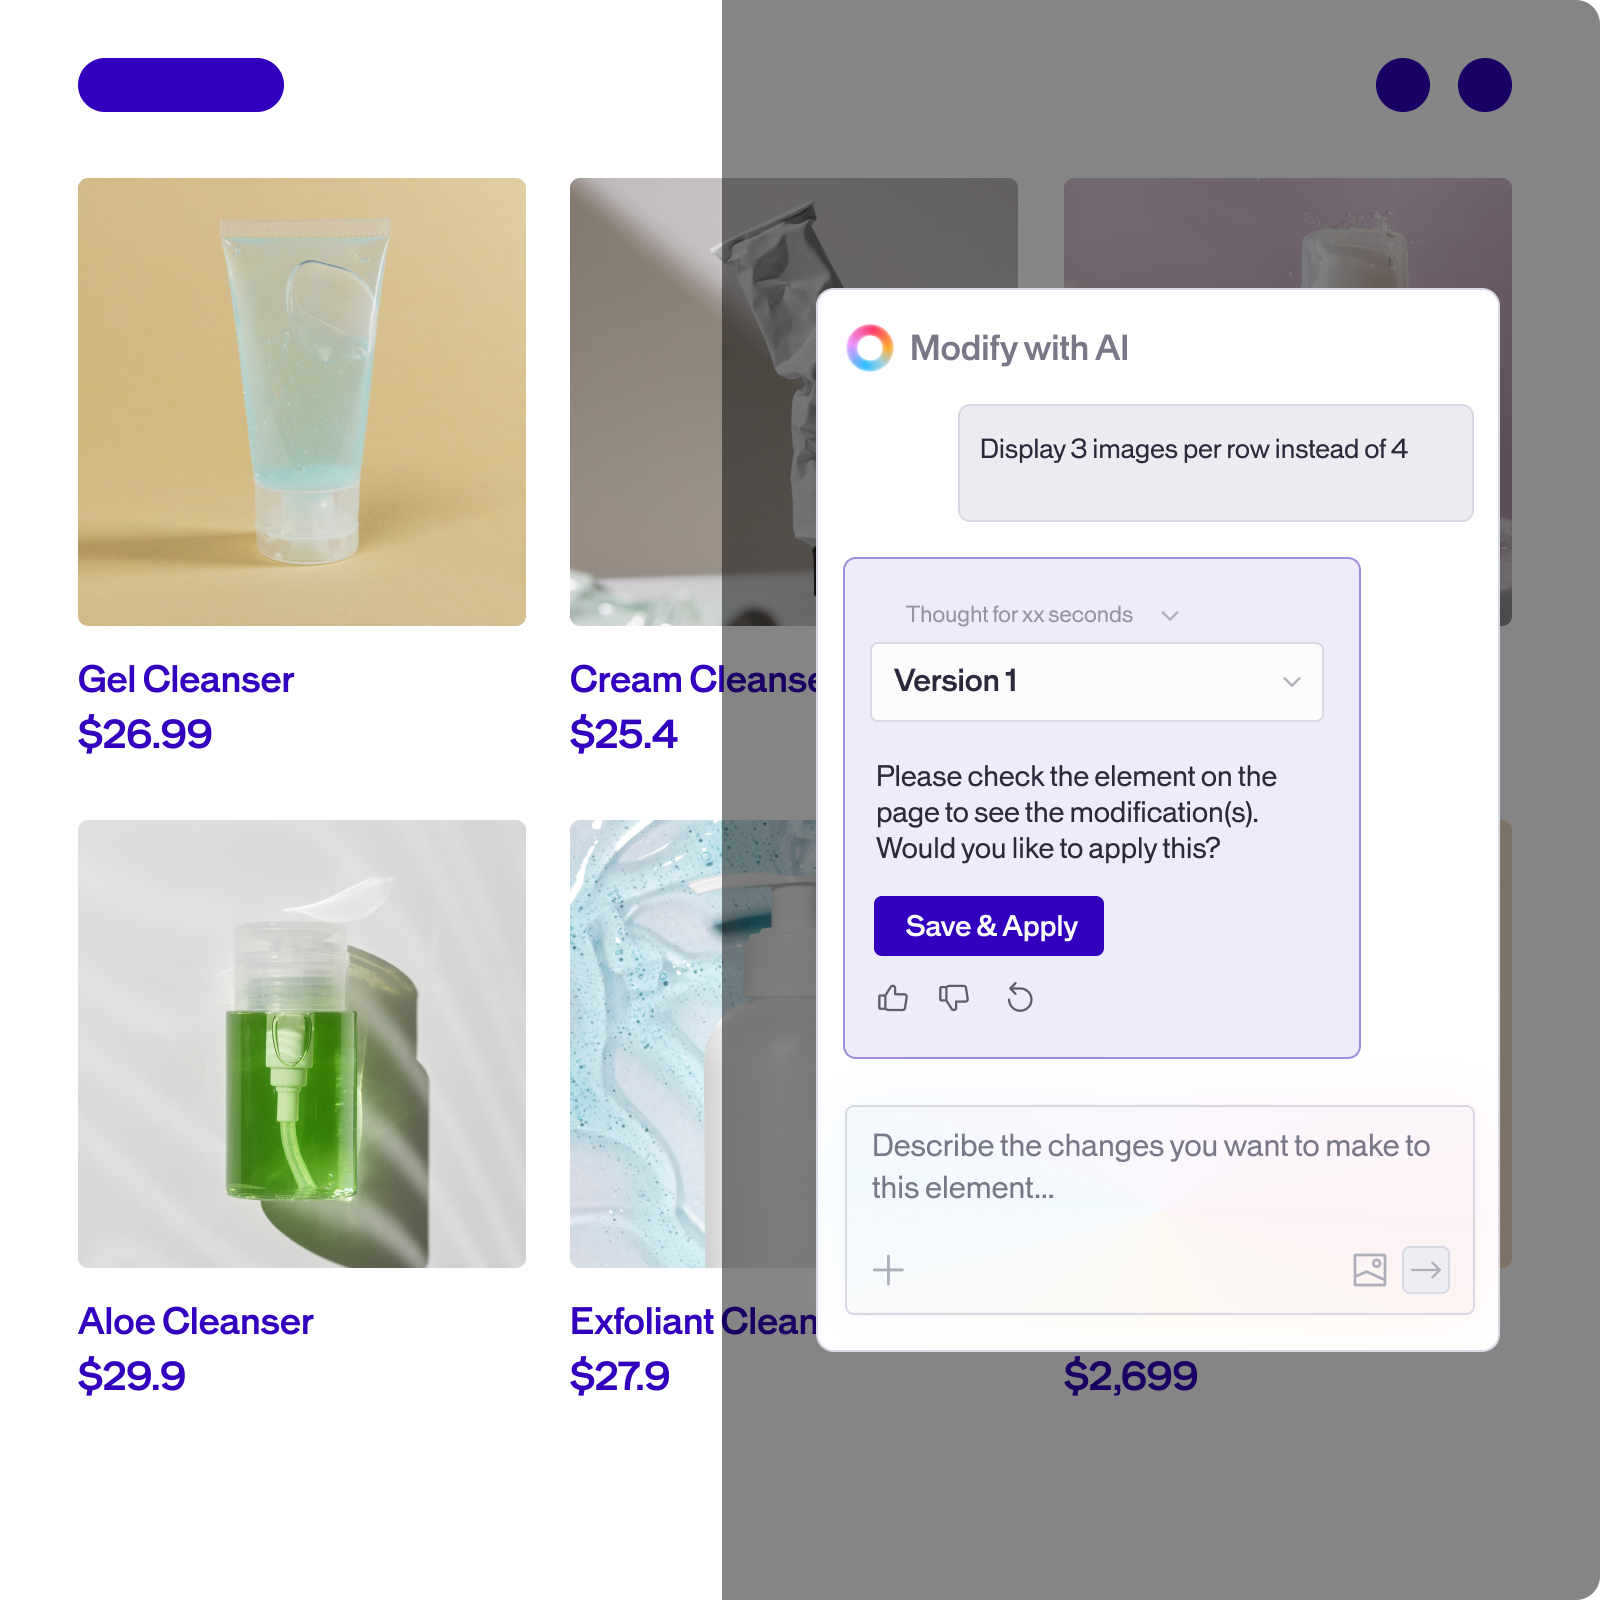
- Use heatmaps and scrollmaps as primary research evidence
- Uncover navigation bottlenecks across user flows
- Share session recordings directly with design teams
- Validate redesign concepts before full rollout

FAQ
Questions about Insights?
Your paragraph text here
What is behavioral analytics and why does it matter?
Standard analytics tools tell you what happened in aggregate. Behavioral analytics shows you how individual users experienced your site, the clicks, the hesitations, the dead ends. Both are necessary. Only one explains the other.
Does Analyze cover mobile apps as well as websites?
Yes. Session recordings, heatmaps, funnel analysis, and segment filtering all work across web and native mobile app environments via our SDK.
Can I sample sessions or do I have to capture everything?
Both options are available. You can capture all sessions or define a sampling rate, useful for very high-traffic properties where full recording would generate more data than the team can use.
How does this handle user privacy in session recordings?
Personally identifiable information is masked by default. We are GDPR and CCPA compliant, and you have granular control over what is and isn’t captured within each session.
Can I connect Analyze to external data tools?
Yes. Audience data from CRMs, CDPs, and analytics platforms including GA4 can be synced into the platform to enrich segment filters within Analyze.


Turn user behavior into better experiences
Discover the platform with a personalised demo