

What are heatmaps? (and why your team needs them)
Think of heatmaps as your website’s truth-teller. They’re visual snapshots showing exactly where visitors click, scroll, and linger. No guesswork required.
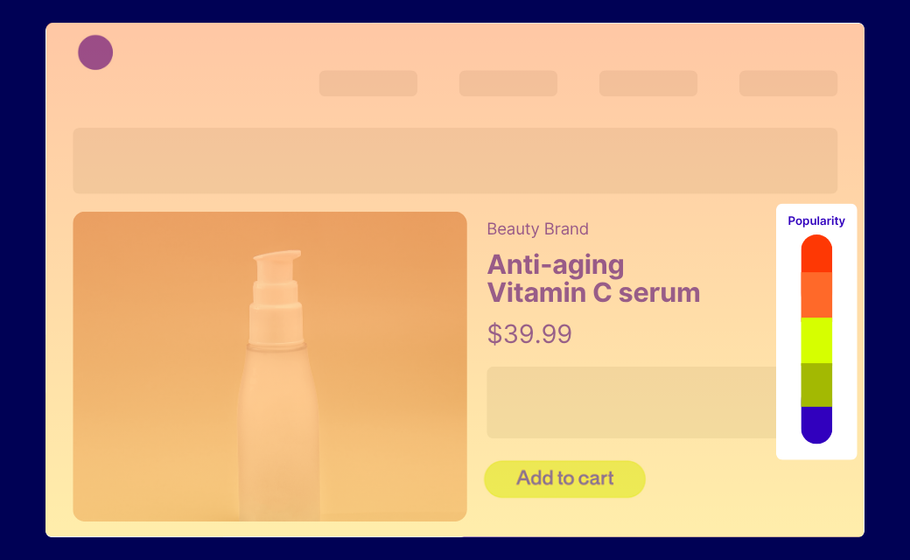
Here’s how they work: Warm colors (reds, oranges) highlight the hotspots where users engage most. Cool colors (blues, greens) reveal the overlooked zones that might need attention.
The best part? Your visitors do all the heavy lifting. They show you what’s working and what’s not, so your team can make changes that actually move the needle.
Spot the signals: When to bring heatmaps into play
Heatmaps aren’t just pretty pictures—they’re your optimization toolkit’s MVP. Here’s how they deliver the biggest impact:
Measuring real engagement
Writing content that no one reads? Heatmaps show you exactly where readers drop off. If only 10% of visitors reach your CTA, it’s time to shake things up.
Tracking what matters: Actions
Are people clicking where you want them to? Heatmaps reveal if visitors complete your desired actions—or where they’re getting stuck instead.
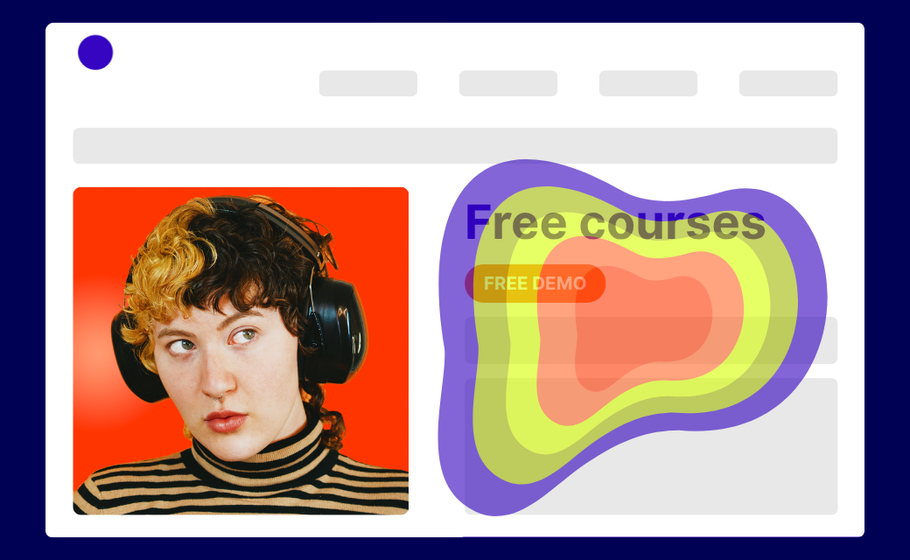
Highlighting where attention sticks (and slips)
What grabs your attention first? What images distract from your main message? Heatmaps answer these questions so you can double down on what works.
Once you have these insights, bigger questions become easier to tackle:
- Where should we place our most important content?
- How can we use images and videos more effectively?
- What’s pulling attention away from our goals?
The essential heatmap lineup every team needs
Most modern heatmap tools offer multiple views of user behavior. We partner closely with some of the major players already. Let’s break down the most common ones you’ll come across.
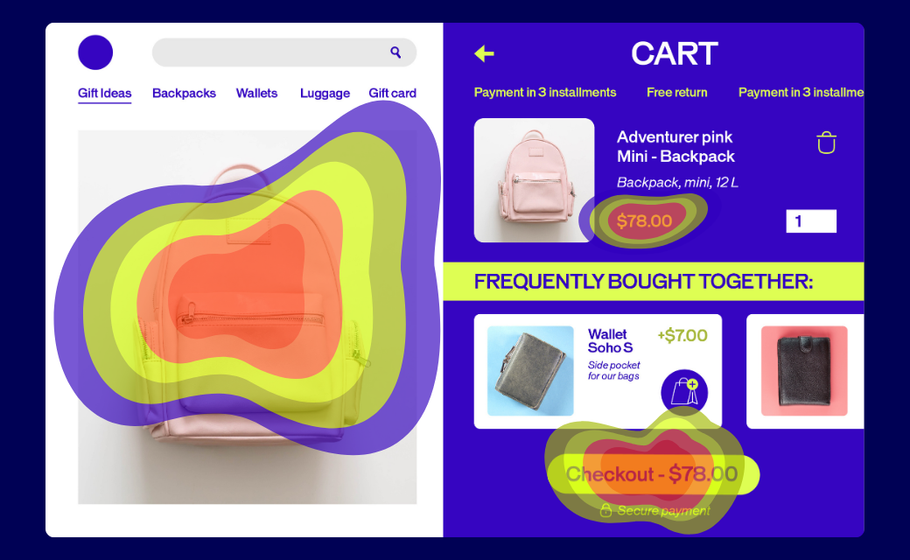
Click Heatmaps: The Action Tracker
These maps show every click on your page, with dense concentrations appearing as bright white areas surrounded by warm colors. Think of them as your conversion reality check.
What it tells you: Whether people click where you want them to—or if they’re trying to click non-clickable elements that look interactive.
How to use it: Look for clicks scattered around non-interactive text or images. These “frustrated clicks” signal design problems. If users are clicking on underlined text that isn’t a link, or images they expect to be clickable, you need to either make those elements functional or redesign them to look less interactive.
Pro tip: Compare click density on your primary CTA versus other page elements. If secondary elements are getting more clicks than your main conversion button, it’s time to redesign your visual hierarchy.
Scroll Heatmaps: The Attention Meter
See how far down visitors scroll and what percentage of users reach each section of your page. This is crucial for understanding whether your important content is actually being seen.
What it tells you: If users actually see your important content or bail before reaching your CTA. Most importantly, it shows you the “fold line”—where 50% of users stop scrolling.
How to use it: Identify the scroll percentage where you lose half your audience, then ensure all critical elements (value propositions, CTAs, key benefits) appear above that line. If your main CTA is only seen by 20% of visitors, move it higher or add secondary CTAs above the fold.
Pro tip: Use scroll maps to optimize content length. If 80% of users stop reading halfway through your blog post, either shorten the content or add more engaging elements (images, subheadings, interactive elements) to keep them scrolling.
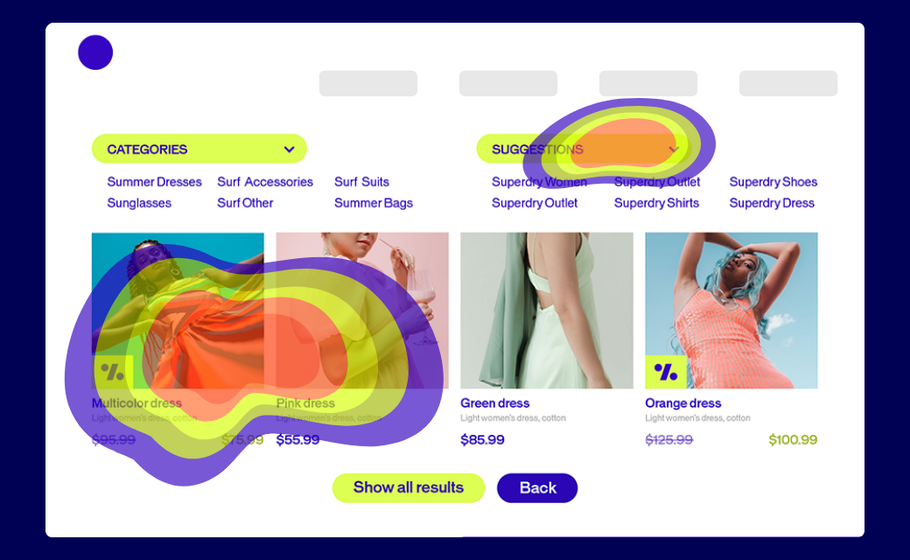
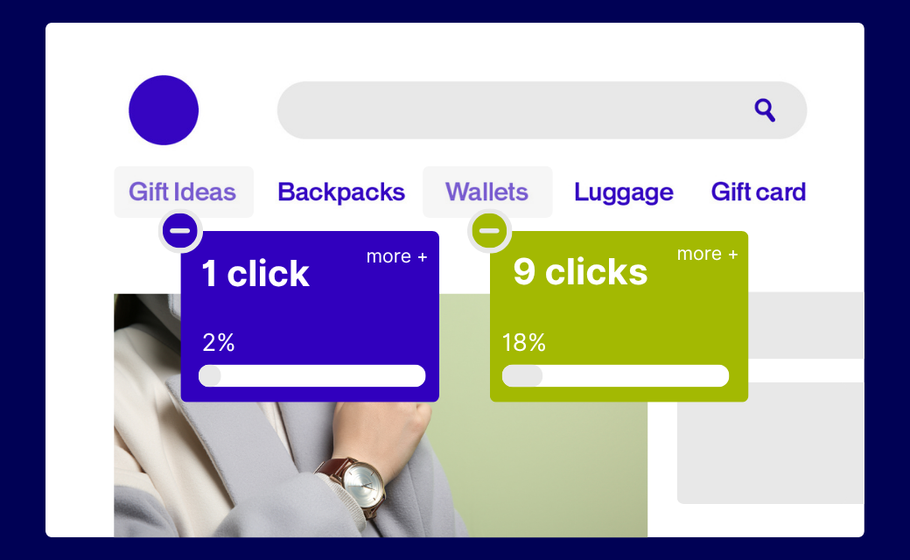
Click Percentage Maps: The Element Analyzer
This view breaks down clicks by specific elements, showing exactly how many people clicked each button, image, or link as a percentage of total visitors.
What it tells you: Which elements deserve prime real estate and which ones are dead weight. You’ll see precise engagement rates for every clickable element on your page.
How to use it: Rank your page elements by click percentage to understand what’s actually driving engagement. If your newsletter signup gets 15% clicks but your main product CTA only gets 3%, you might need to redesign your primary call-to-action or reconsider your page goals.
Pro tip: Use this data to inform A/B tests. If one button consistently outperforms others, test applying its design (color, size, copy) to underperforming elements.
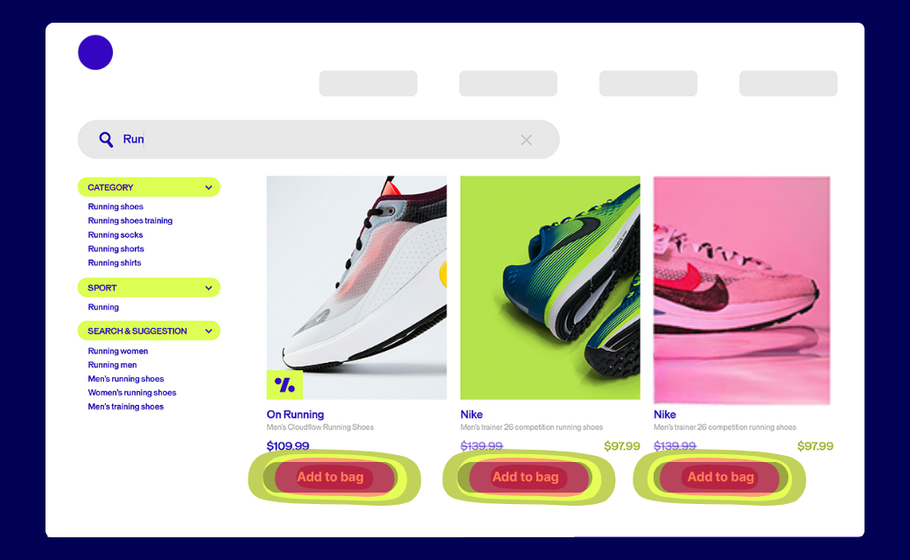
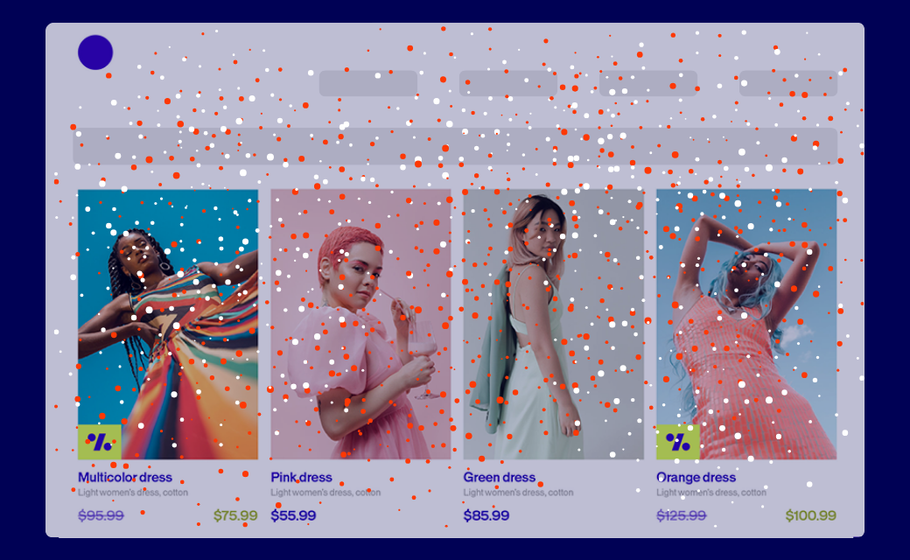
Confetti Maps: The Individual Click Tracker
Instead of showing click density, these maps display each individual click as a colored dot. Perfect for spotting users trying to click non-clickable areas or understanding click patterns in detail.
What it tells you: Where to add functionality or remove confusion. Each dot represents a real user’s intent to interact with something on your page.
How to use it: Look for clusters of dots over non-interactive elements—these represent frustrated users trying to click things that don’t work. Also watch for dots scattered far from any actual buttons or links, which might indicate responsive design issues or accidental clicks.
Pro tip: Filter confetti maps by traffic source or user segment. Mobile users might have different click patterns than desktop users, and organic traffic might behave differently than paid traffic.
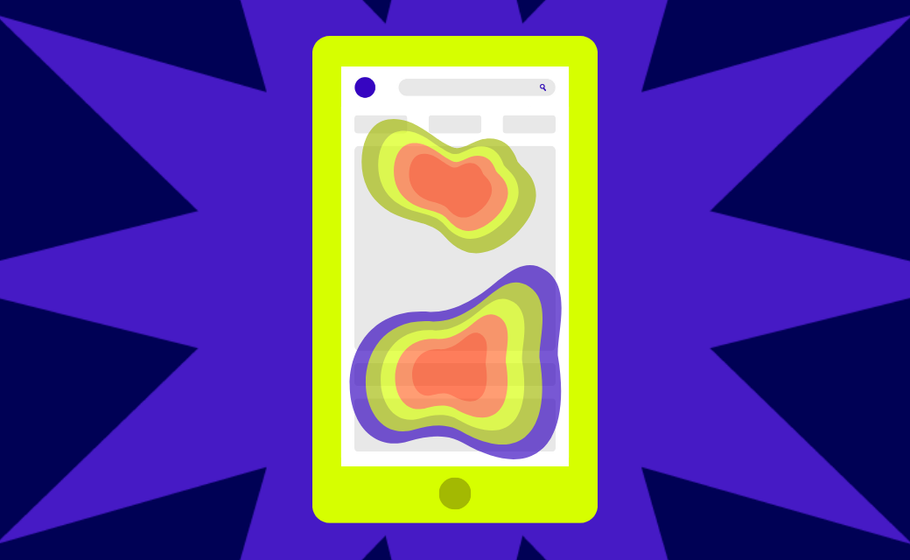
Mobile-Specific Heatmaps: The Touch Tracker
Modern tools capture mobile-specific actions like taps, swipes, pinches, and multi-touch gestures—because mobile behavior is fundamentally different from desktop.
What it tells you: How to optimize for the majority of your traffic (since mobile often dominates). Mobile users have different interaction patterns, attention spans, and conversion behaviors.
How to use it: Create separate heatmaps for mobile and desktop traffic. Mobile users typically scroll faster, have shorter attention spans, and interact differently with buttons and forms. Use this data to optimize button sizes, reduce form fields, and adjust content layout for mobile-first experiences.
Pro tip: Pay special attention to thumb-reach zones on mobile heatmaps. Elements that are easy to tap with a thumb (bottom third of screen, right side for right-handed users) typically get higher engagement rates.
Learn more about best practices for designing for mobile experiences with our Mobile Optimization Guide.
Eyes vs. clicks: Understanding the key differences
While heatmaps track mouse movements and clicks, eye-tracking follows actual gaze patterns. Eye-tracking gives deeper insights but requires specialized equipment most teams don’t have.
The good news? AI-powered tools like Feng-Gui and EyeQuant now simulate eye-tracking through algorithms, making this technology more accessible.
Bottom line: Start with heatmaps. They’re easier to implement and give you actionable insights right away.
Features that make or break your heatmapping game
Not all heatmap tools are created equal. Here’s what your team should prioritize:
Must-have features:
- Audience Segmentation: Create maps for specific user groups (new vs. returning visitors, mobile vs. desktop)
- Map Comparison: Easily compare results across different segments
- Page Templates: Aggregate data for similar page types (crucial for e-commerce sites)
- Mobile Optimization: Track touch, scroll, and swipe behaviors
- Export Capabilities: Share results with your team effortlessly
- Dynamic Element Tracking: Capture interactions with dropdowns, sliders, and AJAX-loaded content
- Historical Data: Preserve old heatmaps even after design changes
Test smarter with heatmap insights
Here’s where things get exciting. Heatmaps show you the problems, but how do you know if your fixes actually work?
Enter A/B testing.
This three-step approach turns insights into results:
- Identify problems with heatmaps
- Test potential solutions with A/B testing
- Choose the highest-performing solution based on data
Real Example:
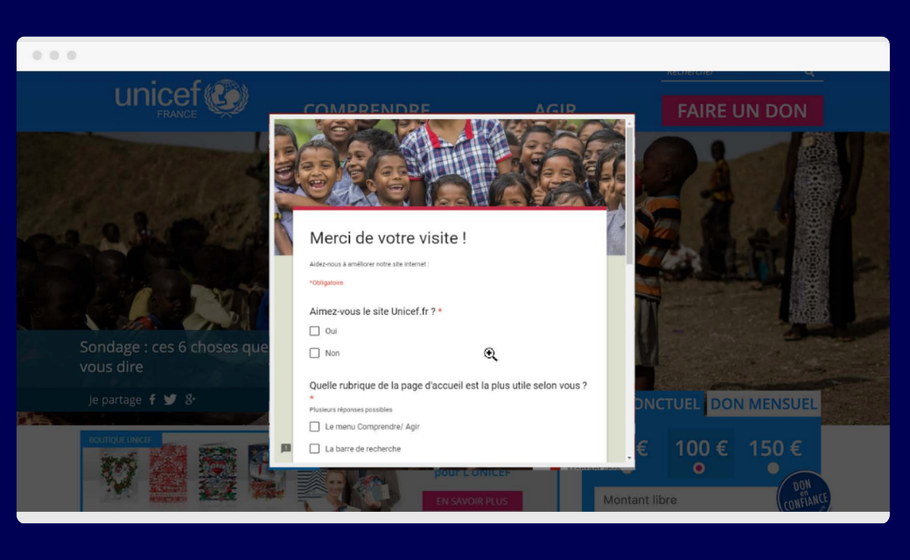
Nonprofit UNICEF France wanted to better understand how visitors perceived its homepage ahead of a major redesign.
Their move: UNICEF France combined on-site surveys with heatmapping to gather both qualitative feedback and visual behavioral data.
The result: Heatmaps showed strong engagement with the search bar, while surveys confirmed it was seen as the most useful element. Less-used features, like social share icons, were removed in the redesign—resulting in a cleaner, more user-focused homepage.
Continue reading this case study
Connect the dots and act with confidence
Ready to put heatmaps to work? Here’s your game plan:
Start small. Pick one high-traffic page and run your first heatmap analysis.
Look for patterns. Are users clicking where you expect? Scrolling to your key content? Getting stuck somewhere?
Test your hunches. Use A/B testing to validate any changes before rolling them out site-wide.
Iterate forward. Heatmaps aren’t a one-and-done tool but part of your ongoing optimization process.
Remember: every click tells a story. Every scroll reveals intent. Your visitors are already showing you how to improve—you just need to listen.
Ready to see what your visitors are really doing? Heatmaps give you the insights. A/B testing helps you act on them. Together, they’re your path to better conversions and happier users.


