

One of the most popular questions when starting with experimentation is: How long should an A/B test run before you can draw conclusions from it?
Determining the ideal A/B test duration can be a challenge for most businesses. You have to factor in your business cycles, traffic flow, the sample size needed and be aware of other business campaigns.
Even if you reach your sample size in a few days… is it okay to end your test then? How long should you really wait?
In this article, we will discuss potential mishaps if your testing cycle is too short, give insights into which factors you need to consider and share advice on finding the best duration for your A/B tests.
Looking for fast statistical reliability? At AB Tasty, we provide a free A/B test duration calculator, which also has capabilities for a sample size calculator.
What happens if you end an A/B test too soon?
The underlying question is a crucial one and can be summed up as follows: At what point can you end a test that appears to be yielding results?
The answer depends on the relevance of the analysis and on the actual benefits of the test.
In fact, it’s not all that unusual to see tests yield good results during the trial phase and no longer see those results once the modifications are introduced.
In most cases, a disappointing observation of this nature comes down to an error during the trial phase: the test was ended too soon and the results at that point were misleading.
Let’s look at an example that illustrates the nature of the problem.
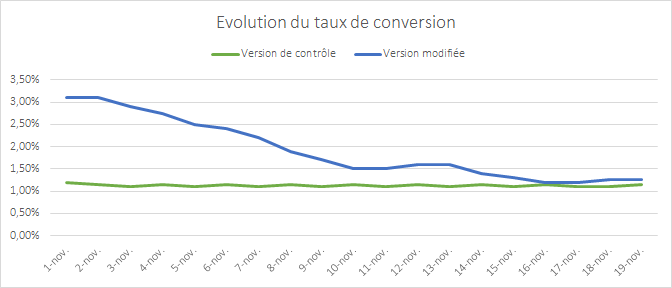
The graph above shows the change in the conversion rate of two versions of a page that were the subject of a test. The first version appears to break away and perform extremely well. The discrepancy between the two versions is gradually eroded as time goes by – two weeks after the starting point there’s hardly any observable difference at all.
This phenomenon where the results converge is a typical situation: the modification made does not have a real impact on conversion.
There is a simple explanation for the apparent outperformance at the start of the test: it’s unusual for the samples to be representative of your audience when the test starts. You need time for your samples to incorporate all internet user profiles, and therefore, all of their behaviors.
If you end the test too soon and allow your premature data to be the deciding factor, your results will quickly show discrepancies.
How to determine the duration of your A/B test
Now that the problem has been aired let’s have a look at how you can avoid falling into this trap.
The average recommended A/B testing time is 2 weeks, but you should always identify key factors relevant to your own conversion goals to determine the best length for a test that will meet your goals.
Let’s discuss several criteria you should use as a foundation to determine when you can trust the results you see in your A/B testing:
- The statistical confidence level
- The size of the sample
- The representativeness of your sample
- The test period and the device being tested
1. The statistical confidence level
All A/B testing solutions show a statistical reliability indicator that measures the probability of the difference in the results observed between each sample not being a matter of chance.
This indicator, which is calculated using the Chi-squared test, is the first indicator that should be used as a basis. It is used by statisticians to assert that a test is deemed reliable when the rate is 95% or higher. So, it is acceptable to make a mistake in 5% of cases and for the results of the two versions to be identical.
Yet, it would be a mistake to use this indicator alone as a basis for assessing the appropriate time to end a test.
For the purposes of devising the conditions necessary to assess the reliability of a test, this is not sufficient. In other words, if you have not reached this threshold then you cannot make the decision. Additionally, once this threshold has been reached, you still need to take certain precautions.
It’s also important to understand what the Chi-squared test actually is: a way of rejecting or not rejecting what is referred to as the null hypothesis.
This, when applied to A/B testing, is when you say that two versions produce identical results (therefore, there’s no difference between them).
If the conclusion of the test leads you to reject the null hypothesis then it means that there is a difference between the results.
However, the test is in no way an indication of the extent of this difference.
Related: A/B Test Hypothesis Definition, Tips and Best Practices
2. The size of the sample
There are lots of online tools that you can use to calculate the value of Chi-squared by giving, as the input parameters, the four elements necessary for its calculation (within the confines of a test with two versions).
AB Tasty can provide you with our own sample size calculator for you to find the value of Chi-squared.
By using this tool, we have taken an extreme example in order to illustrate this exact problem.
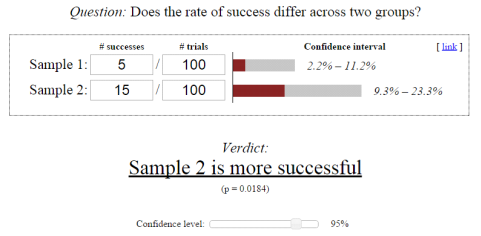
In this diagram, the Chi-squared calculation suggests that sample 2 converts better than sample 1 with a 95% confidence level. Having said that, the input values are very low indeed and there is no guarantee that if 1,000 people were tested, rather than 100, you would still have the same 1 to 3 ratio between the conversion rates.
It’s like flipping a coin. If there is a 50% probability that the coin will land heads-up or tails-up, then it’s possible to get a 70 / 30 distribution by flipping it just 10 times. It’s only when you flip the coin a very large number of times that you get close to the expected ratio of 50 / 50.
So, in order to have faith in the Chi-squared test, you are advised to use a significant sample size.
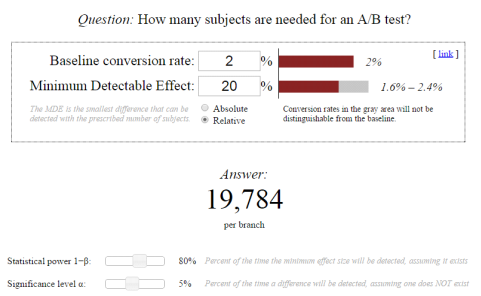
You can calculate the size of this sample before beginning the test to get an indication of the point at which it would be appropriate to look at the statistical reliability indicator. There are several tools online that you could use to calculate this sample size.
In practice, this can turn out to be difficult, as one of the parameters to be given is the % improvement expected (which is not easy to evaluate). But, it can be a good exercise to assess the pertinence of the modifications being envisaged.
Pro Tip: The lower the expected improvement rate, the greater the sample size needed to be able to detect a real difference.
If your modifications have a very low impact, then a lot of visitors will need to be tested. This serves as an argument in favor of introducing radical or disruptive modifications that would probably have a greater impact on the conversion.
3. The representativeness of your sample
If you have a lot of traffic, then getting a sufficiently large sample size is not a problem and you will be able to get a statistical reliability rate in just a few days, sometimes just two or three.
Related: How to Deal with Low Traffic in CRO
Having said that, ending a test as soon as the sample size and statistical reliability conditions have been met is no guarantee that results in a real-life situation are being reproduced.
The key point is to test for as long as you need to in order for all of your audience segments to be included.
Actually, the statistical tests operate on the premise that your samples are distributed in an identical fashion. In other words, the conversion probability is the same for all internet users.
But this is not the case: the probability varies in accordance with different factors such as the weather, the geographical location and also user preferences.
There are two very important factors that must be taken into account here: your business cycles and traffic sources.
Your business cycles
Internet users do not make a purchase as soon as they come across your site. They learn more, they compare, and their thoughts take shape. One, two or even three weeks might elapse between the time they are the subject of one of your tests and the point at which they convert.
If your purchasing cycle is three weeks long and you have only run the test for one week, then your sample will not be representative. As the tool records visits from all internet users, they may not record the conversions of those that are impacted by your test.
Therefore, you’re advised to test over at least one business cycle and ideally two.
Your traffic sources
Your sample must incorporate all of your traffic sources including emails, sponsored links and social networks. You need to make sure that no single source is over-represented in your sample.
Let’s take a concrete situation: if the email channel is a weak source of traffic but significant in terms of revenue and you carry out a test during an email campaign, then you are going to include internet users who have a stronger tendency to make a purchase in your sample.
This would no longer be a representative sample. It’s also crucial to know about major acquisition projects and, if possible, not to test during these periods.
The same goes for tests during sales or other significant promotional periods that attract atypical internet users. You will often see less marked differences in the results if you re-do the tests outside these periods.
It turns out that it’s quite difficult to make sure that your sample is representative, as you have little control over the kind of internet users who take part in your test.
Thankfully, there are two ways of overcoming this problem.
- The first is to extend the duration of your test more than is necessary in order to get closer to the normal spread of your internet users.
- The second is to target your tests so that you only include a specific population group in your sample. For example, you could exclude all internet users who have come to you as a result of your email campaigns from your samples, if you know that this will distort your results. You could also target only new visitors so that you do not include visitors who have reached an advanced stage in their purchasing process (AKA visitors who are likely to convert regardless of which variation they see).
4. Other elements to keep in mind
There are other elements to bear in mind in order to be confident that your trial conditions are as close as they can be to a real-life situation: timing and the device.
Conversion rates can vary massively on different days of the week and even at different times of the day. Therefore, you’re advised to run the test over complete periods.
In other words, if you launch the test on a Monday morning then it should be stopped on a Sunday evening so that a normal range of conversions is respected.
In the same way, conversion rates can vary enormously between mobiles, tablets and desktop computers. So with devices, you’re advised to test your sites or pages specifically for each device. This is easy to accomplish by using the targeting features to include or exclude the devices if your users show very different browsing and purchasing behavior patterns.
These elements should be taken into account so that you do not end your tests too soon and get led astray by a faulty analysis of the results.
They also explain why certain A/A tests carried out over a period of time that is too short, or during a period of unusual activity, can present differences in results and also differences in statistical reliability, even when you may not have made any modifications at all.
The ideal A/B test duration
Running and A/B testing requires a thorough consideration of various factors such as your personal conversion goals, statistical significance, sample size, seasonality, campaigns, traffic sources, etc. All factors deserve equal attention when determining the best practices for your business.
Just remember to be patient, even if you reach your sample size early. You may be surprised by the ending results.
As A/B testing is an iterative process, continuous experimentation and conversion rate optimization will lead to better results over time.


