In today’s digital landscape, data-driven choices are essential for staying competitive, with experimentation as a critical driver of innovation. To support this, we recently hosted a webinar with experts from Google Cloud and AdSwerve, focusing on how Google Analytics 4 (GA4) and BigQuery can enhance experimentation strategies. GA4 is essential for all marketing teams, providing advanced analytics that, when combined with BigQuery’s data consolidation capabilities, enables more effective testing, personalization, and digital optimization.
Meet the panel
Taige Eoff, Cloud Data AI Lead at Google, has been at Google for twelve years, leading data and AI initiatives for cloud marketing. Taige focuses on developing scalable solutions that support partners like AB Tasty and AdSwerve in optimizing digital experiences.
Alex Smolin, Senior Optimization Manager at AdSwerve, brings extensive experience in media, data, and technology. As a certified Google Premium Partner, AdSwerve provides data-driven brands with solutions ranging from A/B testing to advanced analytics.
Mary Kate, our roundtable host and Head of Growth Marketing for North America at AB Tasty, leads efforts to help companies create impactful digital experiences through AB Tasty’s suite of experimentation, personalization, product recommendations, and site search tools.
AB Tasty’s integration with GA4 & BigQuery
Connecting AB Tasty with GA4 gives marketing teams insights into visitor behavior through advanced analytics on CPA, conversion rate, bounce rate, SEO, and traffic. This integration allows teams to use data from either tool to measure the impact of experiments pre- and post-rollout, generating data-backed hypotheses and fostering innovation.
Google BigQuery, a fully managed cloud data warehouse solution, offers rapid data storage and analysis at scale. With its serverless, cost-effective structure, BigQuery allows businesses to analyze large datasets efficiently, making it easier to make well-informed decisions.
With Google BigQuery, users can effortlessly execute complex analytical SQL queries and leverage built-in machine-learning capabilities.
Why is data from GA4 foundational to any CRO program?
In experimentation, data is the catalyst that drives actionable insights. Data flows in from multiple sources, and businesses generate detailed reports by working with partners to integrate tracking and tagging. But the question then becomes: what comes next? That’s where experimentation enters. Using data from tools like GA4, teams can transform hypotheses into tests, uncovering which changes impact user engagement or conversions most effectively.
GA4’s role extends further by providing a consistent framework for testing across platforms. When integrated with BigQuery, GA4 allows teams to cross-reference test outcomes with other data points, revealing not just what worked but why it worked. As Alex noted, “We gather good data, run good tests, and then verify results across disparate sources like BigQuery to see if what we tested had the expected downstream impact.”
Data accessibility and agility are also important. Trends evolve quickly, with viral content or market shifts requiring rapid adaptability. “Having partners like Google, with all data in one place, and a platform like AB Tasty, where experiments can be quickly set up, is essential for staying competitive” Alex emphasized.
“Having partners like Google, with all data in one place, and a platform like AB Tasty, where experiments can be quickly set up, is essential for staying competitive.”
Alex Smolin, Senior Manager Optimization at Adswerve
How BigQuery powers scalable experimentation
With the growing volume of data, businesses need a way to consolidate and interpret it to drive impactful decisions. BigQuery, as Taige explained, is a robust cloud warehouse that streamlines data for meaningful insights, making it a key player in the experimentation ecosystem.
“Think of BigQuery as a filing cabinet for your organized data,” Taige noted. By consolidating disparate data sources, teams can create a unified view that informs testing and optimization efforts. Through this approach, tools like GA4 and BigQuery enable accurate decision-making that scales with the business. With BigQuery as the backbone, AB Tasty and AdSwerve can build on this structure to optimize user experiences through precise experimentation.
Beyond just data storage, BigQuery integrates with various Google Cloud tools and supports a wide range of use cases—from standard reporting to advanced machine learning. For marketers, this means fewer technical bottlenecks and quicker access to the data needed to stay agile. As Taige explained, “You may not need deep technical skills to access BigQuery’s benefits; the right partnerships and data structure can give you a powerful, accessible foundation.”
Leveraging BigQuery’s built-in AI and machine learning models
BigQuery offers an array of AI models for specific use cases—from translation and personalization to customer segmentation. These models add value by automating processes, such as localization or customer behavior prediction, allowing for smoother, more targeted marketing.
BigQuery’s flexibility means that companies can incorporate custom or third-party models, ensuring compatibility with a variety of AI solutions. This adaptability helps organizations innovate and iterate on experimentation programs, expanding what they can achieve with data.
Simplifying data access for marketing efficiency
For marketing teams, BigQuery’s role as a centralized data hub allows seamless data consolidation from platforms like Google Ads, Salesforce, and GA4. This integration ensures that marketers aren’t slowed down by fragmented data sources, freeing them to focus on insights and execution. As Taige highlighted, “The peace of mind that BigQuery provides comes from knowing that all data is consolidated and accessible, allowing teams to be nimble and creative.”
With BigQuery, marketers can view performance metrics, analyze customer journeys, and refine strategies—all within a unified environment. This lets teams optimize campaigns in real time as new data insights emerge.
Next-Generation capabilities enabled by Google Cloud
Looking ahead, digital is paving the way for more advanced experimentation capabilities. The conversation shifts to AI and machine learning, bringing new opportunities for personalization and optimization. As Mary Kate pointed out, while AI-driven insights can revolutionize customer experiences, many brands are still years away from realizing the full potential of these tools.
True value will come not from adopting every new tool but from understanding the foundational data supporting AI and asking the right questions about how these technologies can serve customer needs. Taige added, “If you don’t have a data strategy, you won’t have an AI strategy.” While AI amplifies data power, it requires organized, high-quality data to work effectively.
By consolidating and centralizing data through BigQuery, teams gain real-time insights and can make informed decisions. This data foundation enables the current wave of omnichannel strategies and sets the stage for future AI applications. Businesses that adopt this holistic approach—consolidating data, optimizing channels, and preparing teams for AI—will unlock new experimentation opportunities and drive impactful customer experiences.
With GA4 and BigQuery, businesses have the tools to streamline data consolidation and power next-generation experimentation. Ready to join your data and experimentation? Discover how AB Tasty can help bring data-driven optimization to life.
In the vast and competitive world of e-commerce, simply having great products isn’t enough. Your online store is like a stage, and how you present your products can make or break the show. Enter e-merchandising—the art and science of guiding your customers through a shopping journey that’s as smooth as silk and as engaging as a blockbuster movie.
Whether you’re looking to captivate first-time visitors or inspire returning customers, the right merchandising strategies can transform your site from a digital storefront into an experience that keeps customers coming back for more.
Ready to dive in? Here are five e-commerce merchandising strategies, with real-world examples, to help you create a shopping experience that truly shines.
1. Branding and Homepage Messaging: Your Digital First Impression
“Don’t judge a book by its cover” is a great mantra to apply to our personal lives, however, this proverb doesn’t apply to the e-commerce world.
Your homepage is more than just a landing page—it’s the welcome mat to your online store, and it needs to speak volumes. From the moment someone lands on your site, they should know who you are, what you stand for, and how you can make their life better.
Why it matters:
First impressions count. A compelling homepage can turn curious browsers into engaged shoppers.
Returning visitors want to see something fresh and relevant, not the same old same old.
Pro tips:
Tell your story boldly: Your brand story should be front and center. Use a powerful tagline or headline that captures your essence.
Test, test, test: Use A/B testing to find out what messaging resonates most with your audience.
Show, don’t tell: Include social proof like testimonials and customer reviews to build instant credibility.
Real-world example: Homepage
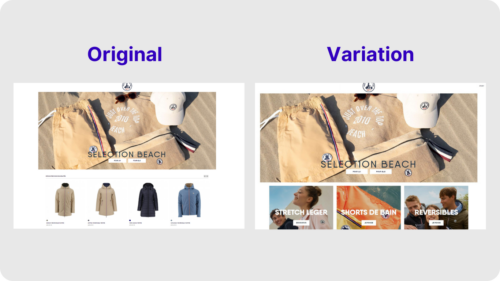
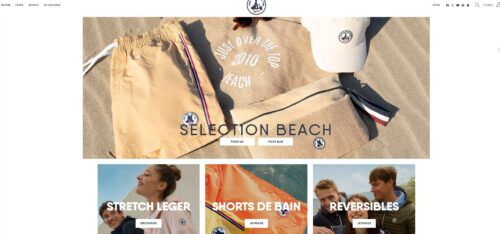
JOTT, a French clothing retailer, noticed that their homepage was experiencing a higher bounce rate than expected. Realizing that first impressions were crucial, they ran a no-code A/B test using AB Tasty’s experience platform to see if rearranging the homepage layout would improve engagement.
By moving product categories to the above-the-fold section and pushing individual product displays lower down, they achieved a 17.5% increase in clicks on the product category blocks. This optimization reduced bounce rates and guided more users deeper into their shopping journey, enhancing overall engagement.
2. Group Merchandise into Collections: Curate Like a Pro
Ever walked into a store and felt overwhelmed by choice? The same thing can happen online. Grouping your products into well-thought-out collections can turn chaos into clarity, making it easier for customers to find what they’re looking for—and maybe even discover something they didn’t know they needed.
Why it matters:
Curated collections simplify the shopping experience, helping customers quickly find what they’re after.
They also encourage customers to explore more, potentially increasing their basket size.
Pro tips:
Get creative with collections: Don’t just stick to the basics. Think outside the box—consider seasonal themes, trending items, or even influencer picks.
Use data wisely: Analyze purchase patterns to create collections that reflect what customers are actually buying.
Spotlight special collections: Use banners or pop-ups to draw attention to limited-time offers or new arrivals.
Real-world example: Collections
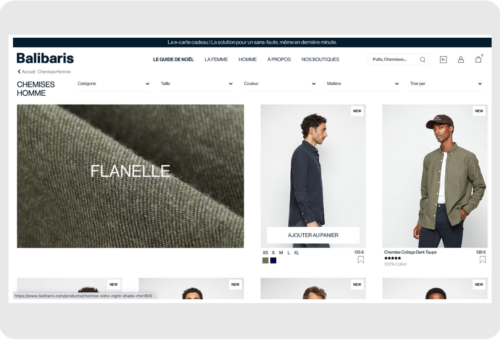
Balibaris, a leading French men’s fashion brand, revamped its e-commerce strategy by intelligently reorganizing its product displays to better match customer preferences and behavior. By dynamically sorting products and emphasizing best-sellers and seasonal items, Balibaris saw a significant increase in conversion rates compared to the previous year, even without special promotions. This strategic move not only enhanced the online shopping experience but also boosted overall sales while freeing up the digital team to focus on more impactful projects.
3. Showcase Products with Visual Merchandising: Let Your Images Do the Talking
In the world of e-commerce, a picture is worth a thousand clicks. Visual merchandising isn’t just about slapping up a few product photos; it’s about creating an emotional connection that makes customers want to reach through the screen and grab that item. High-quality images, videos, and even virtual try-ons can bring your products to life and help customers see how they’ll fit into their lives.
Why it matters:
Stunning visuals can make or break a sale. They help customers imagine the product in their own lives.
Lifestyle images and videos build an emotional connection, making customers more likely to hit “Add to Cart.”
Pro tips:
Go high-def: Invest in top-notch photography that shows your products from every angle.
Tell a story: Use lifestyle images or videos to show how your products can be used in real life.
Mix it up: Consider adding videos or 360-degree views to give customers a more immersive experience.
Real-world example: Visual Merchandising
Galeries Lafayette, one of France’s most iconic department stores, sought to enhance the online shopping experience by testing the impact of different product image styles. They compared standard packshot images to premium images featuring models wearing the products.
The results were striking: the premium images not only increased clicks by 49% but also boosted the average order value (AOV) by €5.76, adding a potential €114,000 in profit. This shift towards higher-quality visuals resonated with customers, leading Galeries Lafayette to prioritize premium images across their site, significantly improving user engagement and sales.
4. Implement Effective Site Search: Help Shoppers Find Their Perfect Match
When a customer knows what they want, nothing should stand in their way—especially not a clunky search function. A well-oiled site search is like a personal shopper, helping customers find exactly what they’re looking for, faster.
Why it matters:
Customers who use search are often more ready to buy, so it’s crucial that they find what they’re looking for quickly and easily.
An effective search can turn casual browsers into buyers by surfacing relevant products.
Pro tips:
Optimize filters & facets: Let customers narrow down their search results with relevant filters like size, color, and price.
Smart error detection: Make sure your search can handle typos and synonyms—because we all make mistakes.
Autocomplete magic: Help customers out by suggesting popular search terms as they type.
Never show a dead end: Avoid zero-results pages by offering suggestions or related products instead.
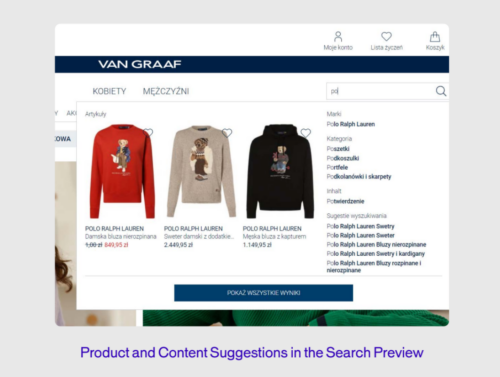
Real-world example: Site Search
VAN GRAAF, an international fashion retailer, recognized the need to elevate their online search functionality to meet the high standards of their physical stores. By integrating AB Tasty, VAN GRAAF significantly improved the customer journey on their e-commerce site. The results were impressive: online orders from search increased by 30%, conversion rates rose by 16%, and the average order value (AOV) saw a 5% boost. Additionally, the share of sales from search grew by 4.3%. This transformation not only enhanced the shopping experience but also reduced the time the team spent managing search functionalities, allowing them to focus on other critical optimizations.
5. Cross-Sell and Up-Sell Products in Your Shopping Cart: The Power of Suggestion
You’ve done the hard work of getting a product into a customer’s cart—now’s your chance to suggest a few more. Cross-selling and up-selling are subtle yet powerful ways to increase the value of each sale by offering customers items that complement what they’ve already chosen.
Why it matters:
Personalized recommendations can boost your average order value and make customers feel like you really “get” them.
It’s a win-win—customers discover more great products, and you see a bump in sales.
Pro tips:
Personalize everything: Use AI to suggest products based on what’s already in the cart or what similar customers have bought.
Bundle it up: Show products that are frequently bought together as a bundle to encourage more sales.
Test placement: Experiment with where you place these suggestions—product pages, the shopping cart, or even during checkout.
Real-world example: Cross-sell and Up-sell
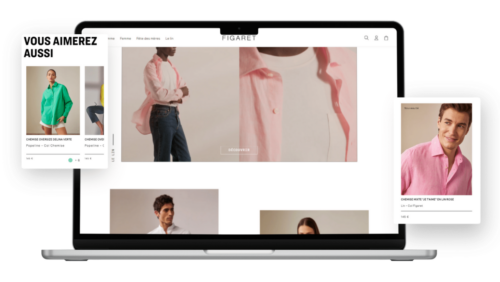
Figaret, a high-end French shirtmaker, significantly boosted its online sales by integrating personalized product recommendations. By strategically placing recommendation blocks on product pages and in the shopping cart, Figaret achieved remarkable results: 6% of visitors used these recommendations, contributing to 10% of the site’s total revenue. Additionally, these users spent on average 1.8 times more than those who didn’t engage with the recommendations. This approach not only enhanced customer engagement but also drove substantial revenue growth.
Measuring Success in E-merchandising: Are You Hitting the Mark?
You’ve put in the work, but how do you know if your e-merchandising strategies are actually working? Measuring success isn’t just about looking at sales numbers; it’s about understanding how each element of your strategy contributes to the bigger picture.
Key Metrics to Watch:
Website traffic: Keep an eye on where your visitors are coming from and what they’re doing on your site.
Conversion rate: This is the percentage of visitors who actually make a purchase—one of your most important metrics.
Sales data: Analyze overall sales, average order value, and revenue from specific merchandising strategies.
Average basket size: Track how many items customers are purchasing per transaction to gauge the effectiveness of your cross-selling and up-selling efforts.
Pro tips:
Set benchmarks: Compare your metrics against industry standards to see where you stand.
Use analytics tools: Platforms like Google Analytics or Matomo can give you insights into how visitors interact with your site.
Keep iterating: Don’t settle for good—strive for better. Regularly review your data and tweak your strategies to keep improving.
Conclusion: Trial and Better—The Heart of E-Merchandising Strategies
E-commerce merchandising isn’t a “set it and forget it” task—it’s a continuous journey of trial, error, and improvement. The best strategies evolve over time as you learn more about your customers and the market. So don’t be afraid to experiment, take risks, and, most importantly, keep pushing for better. Every tweak, test, and change you make is a step towards creating an online store that not only meets but exceeds customer expectations.
Ready to take your e-commerce merchandising to the next level? Download our comprehensive guide on e-merchandising best practices or schedule a free demo with AB Tasty today. Your journey to better starts now.
For e-commerce success, added revenue from existing customers can be more efficient than constantly pursuing new ones. Returning buyers are a vital piece of this strategy. We recently sat down with industry experts to discuss how optimizing customer experiences can drive upselling and cross-selling opportunities. They shared practical approaches for boosting average order value (AOV) while nurturing customer loyalty and retention.
Our speakers, each experts in testing, optimization, and conversion rate, provided insights into how brands can increase revenue through personalized, thoughtful customer engagement.
Meet the experts
Nicole Story: Co-Founder & Director at Hookflash Analytics, leading experimentation in testing, optimization, and personalization.
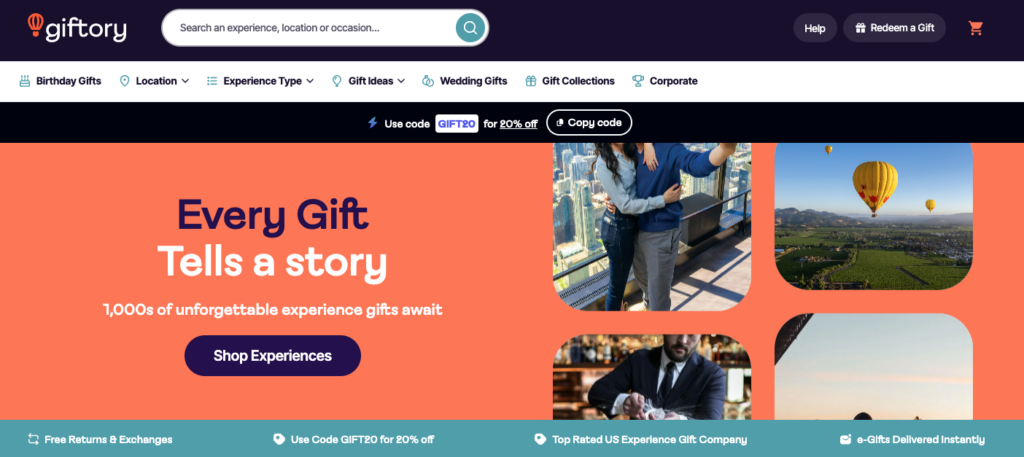
Gerred Blyth: Chief Product Officer at Giftory, with a background in interaction design and e-commerce.
In this article, we’ll explore actionable strategies from the webinar to help you personalize to existing customers and drive growth through upselling and cross-selling—not just new customer acquisition.
1. Optimizing the cart for upsells
Upselling at the cart and checkout stages can significantly increase AOV, but it requires a carefully planned approach. As Colette Carlson explains: “Before implementing anything, it’s crucial to understand how you’re going to measure success and ensure that your conversion rate is solid. When it comes to the cart and checkout process, if those aren’t optimized, adding upsell and cross-sell strategies will only introduce more noise.” Shoppers who have reached the cart are already primed to convert, so it’s important not to disrupt their momentum with irrelevant or poorly timed offers.
“Before implementing anything, it’s crucial to understand how you’re going to measure success and ensure that your conversion rate is solid. When it comes to the cart and checkout process, if those aren’t optimized, adding upsell and cross-sell strategies will only introduce more noise.”
Collette Carlson, Director of Optimization at Astound Digital
Coordination with internal teams is also important when designing upsell strategies. For instance, if an upsell is introduced at checkout, the process should be seamless – will the original product be automatically removed from the cart if the customer selects an upgrade, or will they need to make the changes manually? Likewise, if you’re offering a bundle or cross-sell, is your system prepared to handle it without disrupting the customer experience?
Effective upsell offers are relevant to the customer’s purchase. Suggesting complementary items or upgrades can boost AOV, as 80%of consumers are more likely to complete their purchase with brands offering personalized experiences. From upsell testing experience at Giftory, Jared advises against pushing unrelated or overly expensive items, which can confuse or deter customers altogether.
Using product recommendation algorithms can streamline upselling. Automating this process ensures that customers receive relevant suggestions without the need for manual curation, creating a smoother experience for your team and the customer. AB Tasty’s product recommendation engine allows upsells based on several criteria, including most recent products, associated products, similar or more expensive items, complementary items, and top promotions.
2. Strategic product recommendations for cross-selling
To effectively cross-sell, brands must identify the right moment in the customer journey. If you offer relevant products at key points without disrupting the experience, similar to upselling. But first, establishing cross-selling metrics can lead to stronger effectiveness.
The primary metrics will vary depending on what you’re testing—whether it’s an algorithm change, a new carousel design, or a different recommendation format. There are some essential KPIs to consider:
Engagement: Track how often customers interact with cross-sell offers, such as clicks or add-to-basket rates.
Conversion rate: Measure how many customers who engage with offers complete their purchases.
Average order value (AOV): Gauge how effectively cross-sell strategies are increasing the total order value.
Items per order: Monitor if cross-sell efforts lead to additional products being added to the cart.
Overall revenue: This ultimate metric reflects the total impact of your cross-sell strategy.
Once these metrics are in place, refine your strategy by determining where cross-sell offers should appear. For example, adding a cross-sell option in the mini cart or as a pop-up at checkout can add complexity, so testing can help avoid disrupting the customer experience.
Testing cross-sell algorithms in action
Nicole Story shared a valuable example of testing product recommendation carousels. Inspired by Amazon’s success, many brands rushed to implement carousels on their websites, but forgot the importance of context. Placing multiple carousels on the homepage often leads to irrelevant suggestions and a poor experience.
Nicole’s team tested various algorithms by tailoring product recommendations to the customer’s journey. On product detail pages (PDPs), carousels that showed “related product suggestions” outperformed those with generic recommendations. The tests revealed that adjusting algorithms based on context and customer behavior was far more effective than placing standard carousels throughout the site.
As Nicole explains: “Simply introducing product recommendations and checking that box off the roadmap isn’t going to deliver real value. The key is continuous optimization and discovering what works across the entire customer journey—that’s where the real value lies.”
“Simply introducing product recommendations and checking that box off the roadmap isn’t going to deliver real value. The key is continuous optimization and discovering what works across the entire customer journey—that’s where the real value lies.”
Nicole Storey, Co-Founder & Director at Hookflash Analytics
Relevance is everything
Cross-sell strategies must be highly relevant to what the customer is already doing. As Gerred Blyth from Giftory mentioned, “We have high expectations as customers and irrelevant offers can break that trust.” Customers expect brands to know their preferences and behaviors, so it’s important that recommendations feel personalized and timely.
3. Experimentation and testing for long-term loyalty and CLV
Continuous experimentation is critical for building long-term customer loyalty and increasing customer lifetime value (CLV). Instead of relying on a single strategy, brands should constantly test and improve their approach. Colette points out that starting by analyzing existing order data can uncover natural cross-sell patterns. This provides valuable insights into which products are frequently purchased together.
For first-time visitors, bombarding them with upsell offers might backfire. Instead, let them become familiar with your brand and key products before introducing additional offers. In contrast, repeat customers may be more open to cross-sells that align with their previous purchases.
Upselling with product recommendations
According to our data a customized UX can boost revenue and increase basket size by up to 10%. Product recommendations can be seen as a form of personalization and, as our panel pointed out in the webinar, experimenting with different formats—such as carousels, quizzes, or other interactive tools—can help identify what resonates with your audience and drives engagement.
We use AI to analyze visitors’ site interactions and purchase behavior, delivering targeted recommendations, each with a specific goal. This means you can better understand which products to offer, to whom and when during the customer journey:
Product Page: Guide users to explore more products or categories.
Last Seen Products: Help users quickly resume their browsing.
Add to Cart: Encourage users to add complementary items to their basket.
Cart Page: Suggest additional items to increase order value.
Homepage: Showcase personalized content and help users navigate the site.
Our panel also discussed how different types of algorithms are necessary depending on your vertical. You can divide your algorithms into three distinct types and choose how you prioritize:
Convert: These recommendations would offer top sellers, top trending products, top converting products, top reviewed products etc.
Upsell: This could suggest most recent products viewed, associated products, similar products, compatible products etc.
Personalize: This could suggest last visited products, last bought products, user affinity or similar or associated to cart products
If you work for a beauty site, customers will replenish their favorite products, whereas home and decor might recommend accessories or similar products. While personalization drives relevance, maintaining control over the recommendation process means you can speak directly to your customer’s needs.
Giftory: fostering loyalty with timely engagement
Giftory is beginning to focus on lifetime customer value. Their approach involves using cross-sell and upsell strategies similar to a CRM initiative, introducing customers to a broader range of products both during and after their purchase. They gather data on why customers buy gifts, such as birthdays or anniversaries, and use that information to send timely product recommendations in the future.
By reaching out to customers at the right moment, such as 11 months after an anniversary purchase, Giftory can re-engage them with relevant offers without overwhelming them with constant promotions. This creates a personalized experience that encourages long-term loyalty and repeat business.
4. Subscription models for upsell and retention
Offering subscription products to upsell can improve both immediate revenue and CLV. The challenge is to find the right balance: How can you encourage customers to subscribe without overwhelming them, while also ensuring the offer feels relevant and valuable over time?
Before launching a subscription model, look at your data to understand customer behavior. Consider the difference between a one-time purchaser and a subscriber. While offering a small discount for subscribing may lower the initial AOV, the long-term benefits of recurring revenue from a loyal subscriber can make up for it.
Testing and data-driven strategy
Launching a subscription model requires more than just adding an upsell feature—it involves a data-informed approach. Starting small with a minimum viable product (MVP) allows you to test how customers respond and fine-tune the offering. Metrics like renewal rates, engagement, and overall CLV will help guide decisions about whether to scale the program.
As Gerred advises: “Walk before you run. Start with the first test—an MVP. It doesn’t have to be the final version you’ll roll out, but that initial test will help you understand the value and prove the benefits. From there, you can evolve and continuously improve. It’s easy to feel overwhelmed when you hear about advanced strategies and algorithms, but you don’t need to get there all at once.”
“Walk before you run. Start with the first test—an MVP. It doesn’t have to be the final version you’ll roll out, but that initial test will help you understand the value and prove the benefits. From there, you can evolve and continuously improve. It’s easy to feel overwhelmed when you hear about advanced strategies and algorithms, but you don’t need to get there all at once.”
Gerred Blyth, Chief Product Officer at Giftory
Offering personalized options, such as different subscription tiers or flexible renewal cadences (monthly, bi-monthly, quarterly), can make the experience more appealing to a wider range of customers. Testing, refining, and adapting based on customer feedback will ensure that the model evolves in a way that meets both business goals and customer expectations.
Wrapping up
Just as you approach CRO with care and precision, cross-selling and upselling require a high level of attention.
Upselling and cross-selling don’t have to be complex when you have the right tools and the right strategy. If you want the expert’s opinion – watch the webinar below:
In a highly competitive digital marketplace, optimizing your website for a unique and seamless digital customer journey is no longer just a competitive advantage — it’s a necessity.
It’s important to remember that the digital customer journey does not begin and end with a purchase – it’s a web of all customer interactions and touchpoints with your brand.
AB Tasty has mapped out seven customer phases that we consider crucial in the journey. To craft unique experiences, you’ll need to differentiate these seven phases customers pass through and understand how to animate their digital journey.
Once you have a better understanding of these phases, you will be better equipped to set your business goals and properly optimize your website for growth and impact.
Click to view the full-sized infographic in a new tab
How exactly can you optimize each phase of the digital customer journey? Let’s dive right in and take a look at some examples.
Phase 1: Awareness
When visitors land on your website for the first time, a great first impression is crucial. Your page needs to be both visually appealing and intuitive. A dynamic above the fold design is a great place to start.
In this first phase, it’s important to let your best ideas shine to capture and keep your visitors’ attention. You can accomplish this by creating personalized welcome messages for first-time visitors, displaying your value proposition and organizing high-impact elements for better visibility.
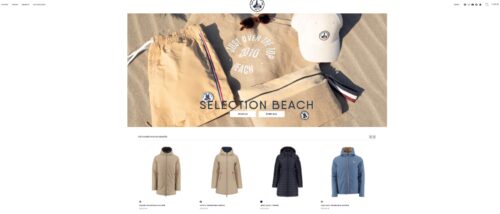
Let’s take a look at Just Over The Top’s experiment to modify the layout of their homepage. They used AB Tasty’s experience optimization platform to test if their users responded better seeing a layout with product categories rather than individual products.
Original:
Variation:
After creating a test variation to run against the original layout, they saw a 17.5% click increase on the three blocks below the hero image. This brought many more users into the second phase of their customer journey.
Phase 2: Discovery
When consumers reach the second phase, they’ve already discovered your brand and they’re getting curious.
To accommodate visitors during this phase, your website should be optimized for an excellent browsing experience. Whether this means making your search bar more visible, creating dynamic filters while searching, or using a virtual assistant to get to know your visitors’ interests with a series of questions, an easy browsing experience with intelligent search is key.
In this example, Claudie Pierlot focused on optimizing the customer browsing experience by testing the search bar visibility. In their variation, the small search icon was made more visible by adding the word “recherche” (or search in English) in the top right-hand corner.
Original:
Variation:
This clear above the fold design made it easier for visitors to identify the search bar to begin their browsing experience. With this simple A/B test, they saw a 47% increase in search bar clicks and a 7% increase in conversion rates coming directly from the search bar.
In another example, Villeroy & Boch, a ceramic manufacturing company, wanted to leverage intelligent search on their website. With the help of AB Tasty, they implemented an AI search algorithm to navigate online shoppers.
With our solution, they designed a new and intuitive navigation complete with filters and a comprehensive autosuggestion feature.
By changing their search functions, Villeroy & Boch saw a 33% increase in search results clicks and a 20% increase in sales through the search function.
Phase 3: Consideration
Now is the time when your visitors are considering your brand and which products they are interested in. Showcasing your product pages in their best light during the consideration phase might be exactly what your visitor needs to continue moving down the funnel.
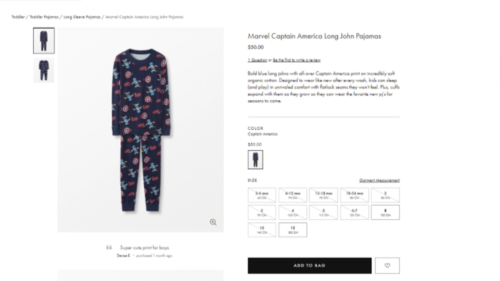
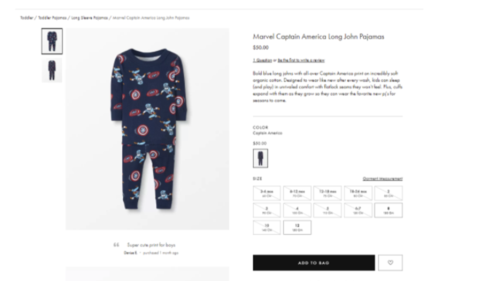
Let’s look at how Hanna Anderson optimized their product pages during this phase.
The clothing retail company wanted to experiment with the images on their product listing pages. Previously, their toddler line had only images of clothing sizes for an older child. They were convinced there was room for improvement and decided to run a test by changing their images to include toddler sizes.
Original:
Variation:
After implementing age-appropriate clothing images, the results were clear. During this test, the clicks on PLPs increased by almost 8% and the purchase rate on those items skyrocketed by 22%.
Phase 4: Intent
During the intent phase, your visitors are on the verge of becoming customers but need to be convinced to make a purchase.
Social proof, urgency messaging, and bundling algorithms are a few ideas to lightly nudge visitors to add to cart or add more to cart.
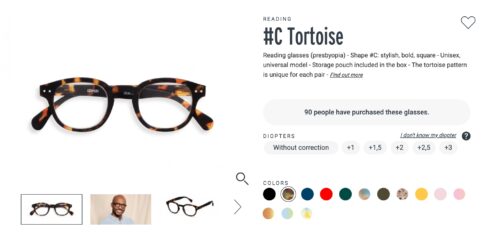
Let’s take a look at the impact that urgency messaging can have: IZIPIZI, an eyewear retailer, decided to add a special message flag next to their product description to show viewers how many people have purchased this product. The idea of this message is to show viewers that this product is popular and to encourage them to take action.
With this simple sentence of social proof to validate a product’s desirability, they saw a 36% increase in add-to-basket rate.
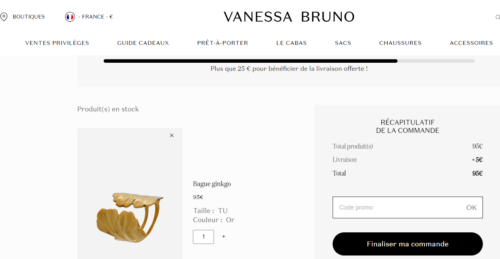
In another scenario, you can see that adding a progress bar is a simple way to upsell. With a progress par, you are showing your customer how close they are to earning free shipping, which entices them to add more to their cart.
Vanessa Bruno experimented with this additive with the help of AB Tasty and saw a 3.15% increase in transactions and a €6 AOV uplift.
Phase 5: Purchase
Purchase frustration is real. If customers experience friction during checkout, you risk losing money.
Friction refers to any issues the visitors may encounter such as unclear messaging during the payment (did the payment actually go through?), confusing or expensive shipping options, discounts not working, double authentication check-in delays, difficult sign-in, and more.
Optimizing your checkout sequence for your audience with rollouts and KPI-triggered rollbacks can help you find a seamless fit for your website.
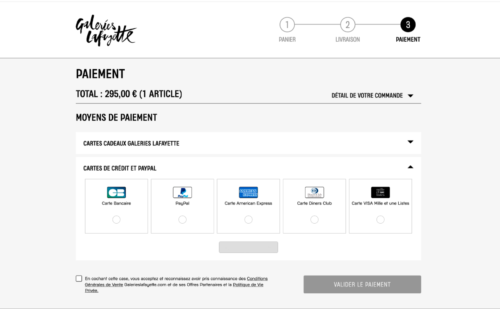
Let’s look at an example for this phase: Galeries Lafayette, the French luxury department store, saw an opportunity to optimize their checkout by displaying default payment methods that do not require double authentication.
During this test, they saw a €113,661 increase in profit, a €5 uplift in average order value, and a 38% increase in the conversion rate by adding the CB (bank card) option for a quicker checkout.
Phase 6: Experience
Optimizing the buyer experience doesn’t end after the purchase. Now is the time to grow your customer base and stop churn in its tracks. So, how do you keep your customers interested? By maintaining the same level of quality in your messages and personalization.
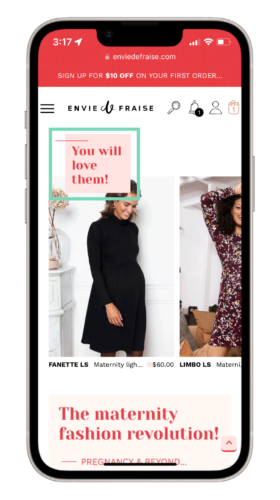
Let’s look at how Envie de Fraise, a French boutique, leveraged their user information to transform a normal post-purchase encounter into a personalized experience.
One of their customers had just purchased a maternity dress and had been browsing multiple maternity dresses prior to their purchase. By knowing this information, they experimented with using the “you will love these products” algorithm to gently nudge their customer to continue shopping.
With a customized recommendation like this, Envie de Fraise saw a €127K increase in their potential profit. As your customer spends more time with your brand, you will learn more about their habits and interests. The more time they spend with you, the more personalized you can make their experience.
Phase 7: Loyalty
In the final step of your customer’s journey, they move into the loyalty phase. To turn customers into champions of your brand, it’s important to remind them that you value their loyalty.
This can be done by sending emails with individual offers, social proof, product suggestions, or incentives for joining a loyalty program to earn rewards or complete product reviews.
Another example of this is sending a personalized email displaying items that are frequently bought together that align with their purchase. This will remind the customer about your brand and give them recommendations for future purchases.
Why Optimizing the Digital Customer Journey is Essential to Boost Conversions
The fierce competition in the e-commerce marketplace is undeniable. In order to attract and retain customers, you have to focus on crafting personalized user experiences to turn passive visitors into active buyers.
Understanding their needs in each phase and optimizing your digital space is your best solution to nudge visitors down the purchasing funnel.
By personalizing the experience of your customers during each phase of the digital customer journey, you can ensure an optimal shopping experience, boost purchases, increase customer satisfaction, and see more repeat customers.
AB Tasty is the best-in-class experience optimization platform that empowers you to create a richer digital experience – fast. From experimentation to personalization, this solution can help you activate and engage your audience to boost your conversions.
Using personalization to enhance your customer journey
With the vast array of products and brands to choose from, customer loyalty has become more important than ever. By focusing on personalizing the digital customer journey, you can reduce the chances of your customer abandoning their purchase or opting for another brand.
An individualized customer journey is beneficial for the following reasons:
Option overload: As online brands fight for the attention of consumers, it’s important to set your brand apart from the rest, with a customer journey that is tailored to their needs.
Analysis paralysis: With a plethora of information now readily available to customers who are researching and comparing potential purchases, your digital customer journey can help to deliver the information they need with ease and offer them the best shopping experience, thereby tipping the scale in your favor.
Lack of loyalty: The ease with which a customer can change service providers has increased the pressure and importance of meeting their needs during the entirety of the digital customer journey. Every interaction matters.
Offering a personalized experience elevates the customer journey and helps to ensure customer satisfaction. By leveraging the power of personalization, you can adapt the individual phases of the customer journey to each customer’s needs for an optimal e-commerce experience.
Personalization is the key to customer satisfaction
There is no way to deny the intense competition in the e-commerce space. Attracting and retaining customers is more difficult now than it has ever been. To advance ahead of the competition, you must understand customer needs and personalize each user journey with the help of a customer journey model.
By personalizing each experience your customers have with your brand, you can be sure to give your customers an optimal shopping experience, guarantee customer satisfaction, and encourage customer loyalty.
In today’s mobile-first world, where smartphones dominate more than half of global web traffic, optimizing for mobile has never been more crucial. Mobile usage surpassed desktop in the US in 2022 and in the UK in 2023, signaling a clear shift in consumer behavior. Brands are now urged to design with mobile in mind first, adapting for desktop as needed, rather than the reverse. This shift may seem daunting for teams, but it’s a necessary evolution to meet the expectations of today’s users.
Whether your customers are researching products or making purchases, their mobile experience can make or break their journey with your brand. While it’s clear that more shopping is done on mobile devices than on desktop, the real question remains: how significant is mobile shopping overall? Today’s mobile-savvy consumer isn’t just using their device for convenience, but to blend their in-store and online shopping into one seamless experience. In fact, nearly 80% of shoppers globally use their smartphones to browse a retailer’s website while shopping in-store, and 74% use the store’s app. However, only 33% of consumers prefer making purchases on their phones, with 49% reporting a smoother experience on desktop or tablet. This highlights just how important it is for brands to enhance their mobile offerings for a seamless experience across all devices.
To delve into the complexities of mobile optimization Mary Kate, AB Tasty’s Head of Growth Marketing for North America, teamed up with Allie Tkachenko, a UI/UX Strategist at WPromote, for a webinar on mastering mobile. AB Tasty’s platform enables brands to deliver personalized customer experiences, while Wpromote helps design and optimize engaging web experiences that convert. They emphasize a key message: mobile optimization isn’t just about resizing for a smaller screen – it’s about creating an intuitive, seamless journey that aligns with today’s mobile-first consumer’s behaviors and expectations.
It’s critical that mobile websites excel in areas like speed, navigation, and user-friendliness. Let’s dig into three actionable strategies from the webinar to help your brand stay ahead and deliver an improved mobile experience for your customers.
1. Maximizing limited space
One of the biggest challenges in mobile design is maximizing limited screen space without overwhelming users. The key is to keep crucial content above the fold—on mobile, this means placing essential elements like navigation bars, CTAs, and product highlights in a prominent position, visible without scrolling. This is particularly important on search landing pages, the homepage, and other high-traffic areas. A well-organized and streamlined navigation system that helps users quickly find what they need can lead to higher engagement and reduced bounce rates.
While desktops offer ample space to break down navigation into detailed categories, mobile design requires a more simplified structure due to space constraints. Consider grouping categories under broader buckets like “Top Categories” or similar, allowing users to easily explore the site without feeling overwhelmed by too many options. Another key strategy is leveraging responsible design, such as implementing sticky navigation bars or menus that stay visible as users scroll. This approach, widely adopted across industries, ensures easy access to important links and minimizes the effort required to navigate the site.
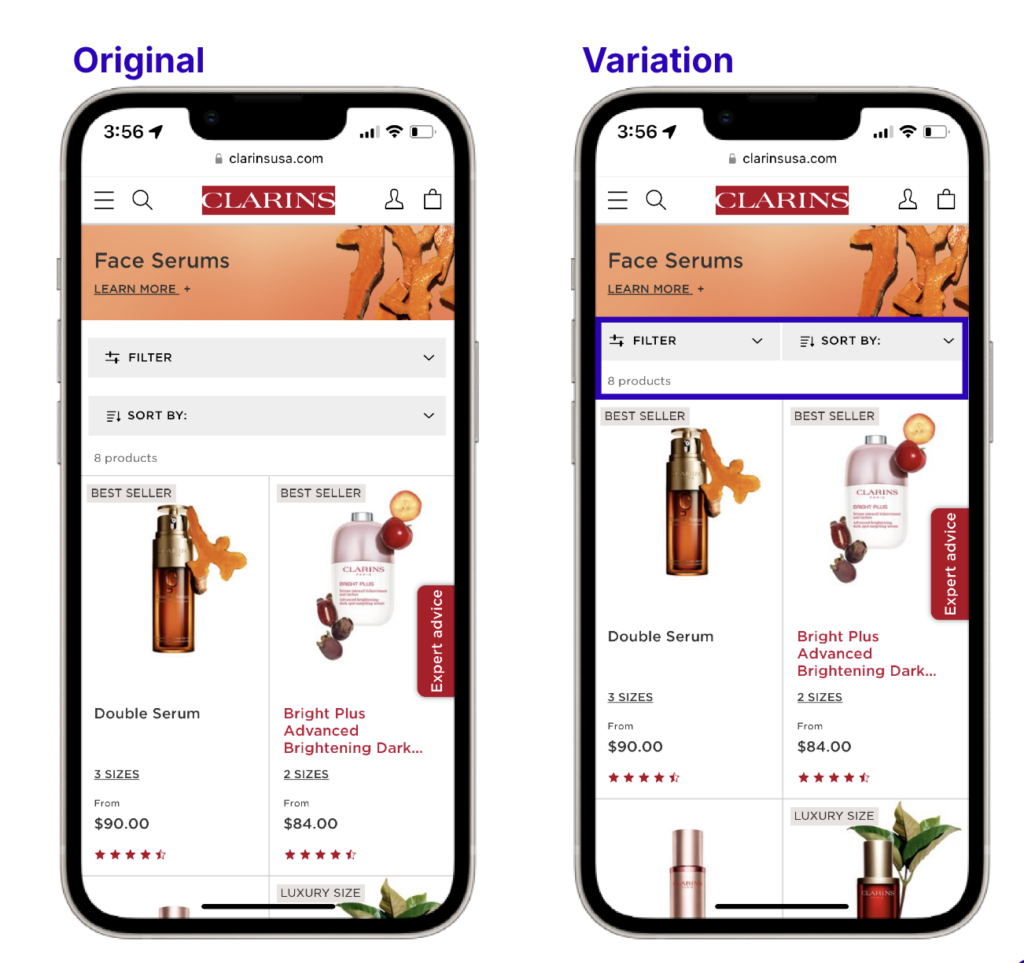
AB Tasty in action
The UX team at Clarins wanted to make their product more visible on their category pages. In the original layout, filtering and sorting functions were stacked, removing space from the second row of products appearing. After testing a column layout for the filtering and sorting menus, the team saw a significant improvement—bounce rates decreased, and clicks to products increased by 34%.
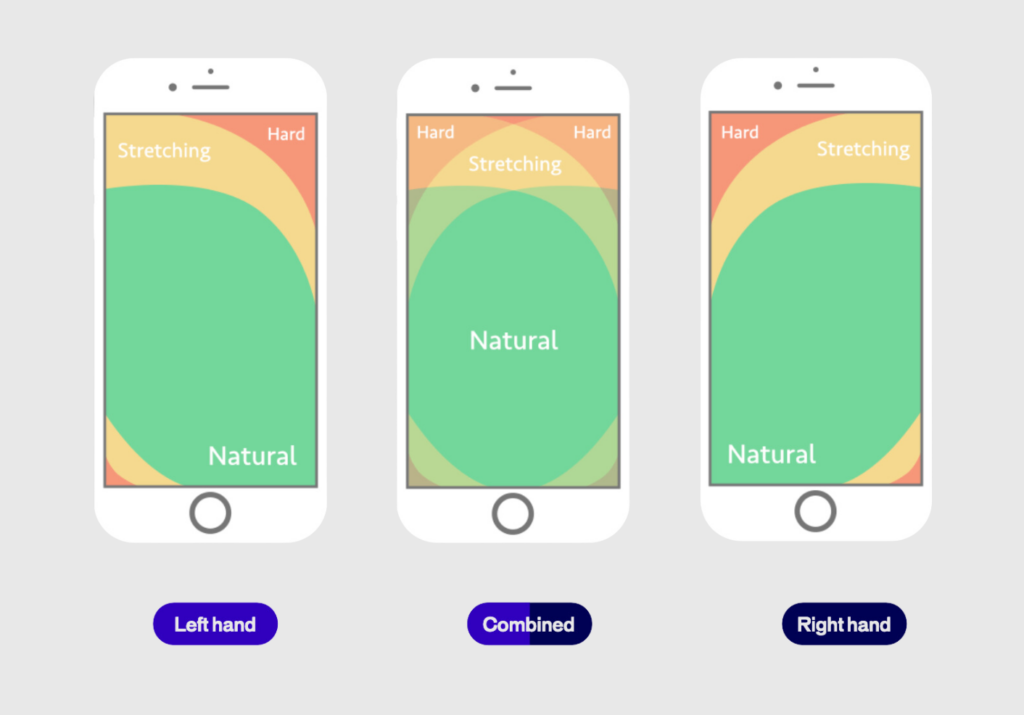
The “Thumb Zone” refers to the area of the screen that is easiest for users to reach with their thumbs, typically the lower portion of the screen. Since most users interact with their phones one-handed, placing critical CTAs, buttons, and interactive elements within this zone is important for accessibility and ease of use.
Consider this: a navigation bar that starts at the top of the page but shifts responsively to the bottom as the user scrolls. This keeps it in an expected spot initially, avoiding any disruption to the user’s flow, and then moves it to a more reachable area as they continue browsing.
Another thing to keep in mind is sizing. Whether it’s buttons, images, form fields, or menu links, the size of these elements plays a huge role in usability. You can’t just shrink them to save space—you have to ensure they’re “tappable” so users can easily interact. While reachability is key, think about what doesn’t need to be within reach, like informational banners or logos. You can place those outside the thumb zone, saving prime space for interactive elements.
Brands that prioritize the thumb zone in their mobile designs see improved user engagement and lower frustration levels. This small shift can make a significant difference in usability and customer satisfaction.
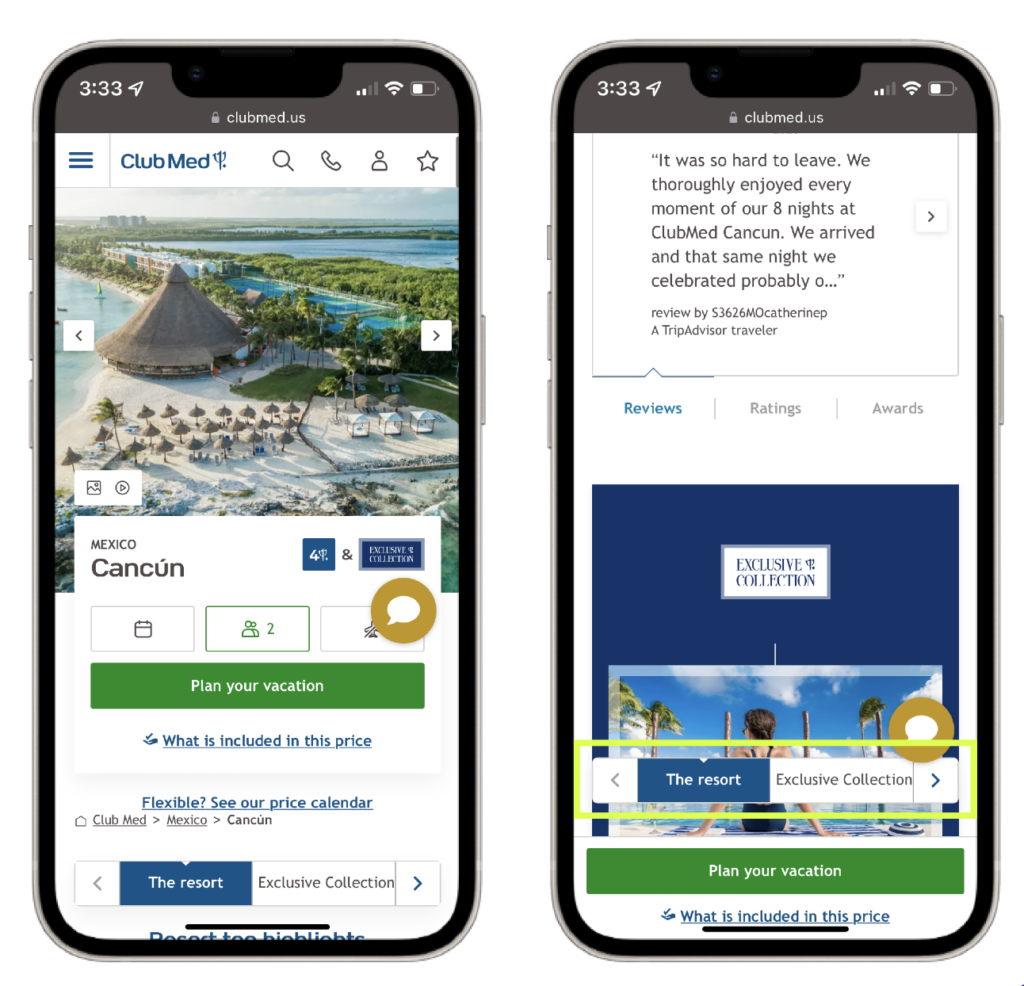
AB Tasty in action
The team at Club Med, a leading travel and hospitality brand, observed that their original mobile site displayed a navigation bar at the top of the page, which would disappear as users scrolled down. To increase user engagement with different category offerings, they created a variation of the mobile homepage with a sticky navigation bar which remained at the bottom of the screen while scrolling.
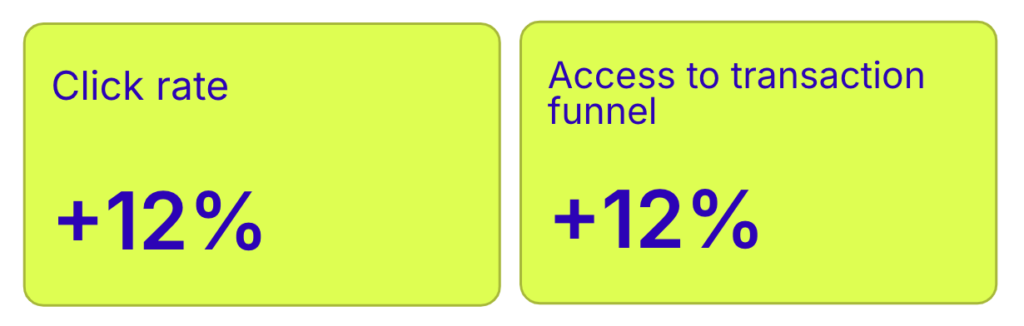
The results of the A/B test revealed a 12% increase in click rates, a 12% increase in access to the transaction funnel, and a 2% decrease in the bounce rate for users showing the variation with the sticky navigation bar. This approach effectively makes information more physically accessible.
Optimizing the thumb zone
Bottom Navigation
Sizing
Reachability
3. Improving processes
Lengthy forms and cumbersome checkout processes are major obstacles to conversion in mobile digital experiences. Mobile users expect a seamless, fast journey, and frustration with complex forms often leads to abandoned carts. Streamlining these processes—especially form fills and checkouts—can reduce friction and improve conversions. We’ve all experienced the annoyance of having to redo a form, fearing progress might be lost, which can lead to users abandoning the process entirely. Key areas for optimization include simplifying checkout by offering guest checkout options and exploring one-click payment methods.
Search and product discovery also present unique challenges on mobile devices due to limited screen space. With condensed menus and site navigation, users often rely heavily on the search function. Optimizing your search results pages to help users quickly find specific products can drastically improve the user experience. The space constraints of mobile mean that every element, including search results, should guide users efficiently to what they’re looking for.
Lastly, page load speed plays a vital role in retaining users. A slow-loading site can deter users, leading them to abandon your site altogether. Reducing load times is crucial for keeping users engaged. Understanding your audience and continuously optimizing these processes will help ensure your site meets their needs and encourages conversions.
AB Tasty in action
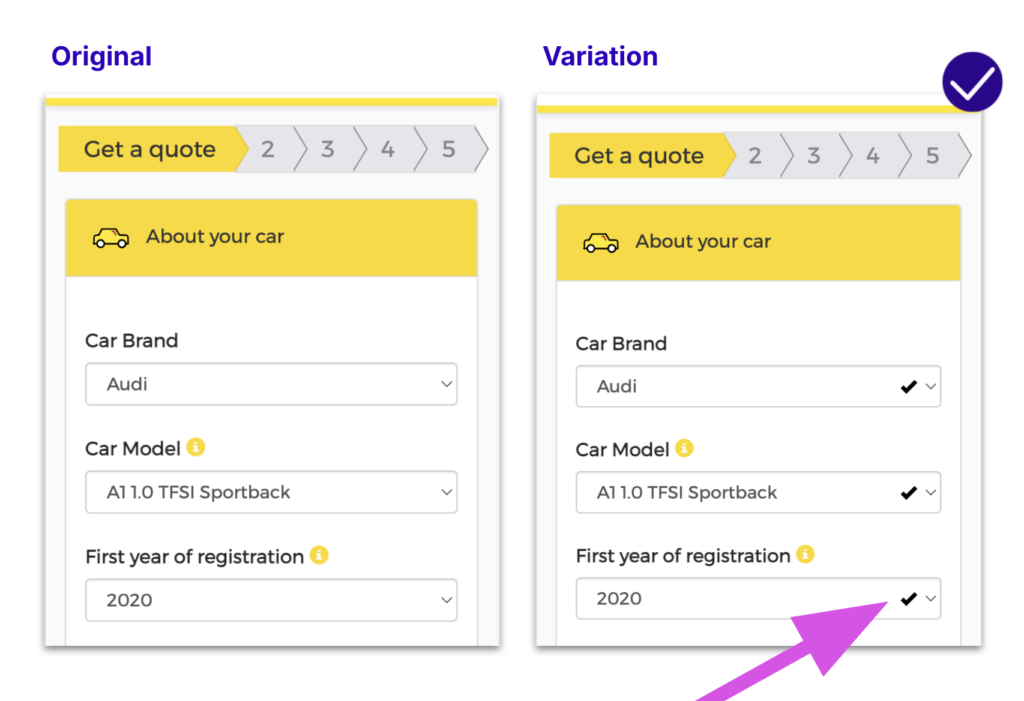
Travel insurance company, DirectAsia, needed users to fill out a form to generate an insurance quote. The team observed that customers were not completing the forms as smoothly as expected. To address this, they implemented a variation in the test where bolded check marks appeared to validate each completed field. This change created a sense of progress for users as they navigated the form and alleviated any uncertainty about needing to go back to correct errors.
As a result of this test, DirectAsia achieved a 1.97% increase in quote generations and a 7.78% increase in transaction rates. By reassuring users throughout the form-filling process, DirectAsia successfully guided more customers through their quote generation form.
Optimizing mobile processes
Checkout
Search and discovery
Speed & image loading
Wrapping up
Mobile optimization is about much more than making your website look good on a smaller screen; it’s about crafting a seamless, user-friendly experience that enhances the customer journey. Whether you’re focusing on improving site speed, optimizing design for better accessibility, or streamlining complex processes, the suggestions above provide a solid foundation for mastering mobile optimization. By understanding the nuances of mobile behavior and catering to the needs of your users, your brand can create a frictionless experience that drives conversions and fosters customer loyalty.
Stay ahead in the mobile-first era by ensuring your website design and processes align with the expectations of today’s consumers. AB Tasty can help achieve this goal by providing innovative tools and data-driven testing to enhance your mobile strategy. As mobile usage continues to grow, so does the importance of providing a smooth, engaging, and conversion-focused experience.
If you want to get all the details. – watch the webinar below.
When it comes to optimizing your website for better performance, experimentation is key to uncovering the areas that will make the biggest impact. Every page and interaction is an opportunity to boost conversions, streamline the user experience, and reduce friction. But with so many possibilities, where do you start testing? What are the key hotspots on your website that can deliver quick wins and meaningful improvements?
Finding the right areas to test can be tricky, but knowing where to focus is important for getting results quickly. That’s why we’ve identified five key questions to help guide your experimentation efforts:
Is the content relevant to “me” (the visitor)?
Is the next action clear?
What may be distracting?
What could cause anxiety?
What is creating urgency?
By addressing these questions, you can start identifying the areas on your website—what we call Experimentation Hotspots—that offer the most potential for improvement. In this guide, we’ll explore these important areas, from the homepage to the checkout funnel, that are ideal for testing. Whether you’re optimizing for mobile, app, or desktop, these tips will help you kickstart your experimentation journey and start making impactful changes.
1. Homepage
The homepage is where you show people who you are and what your brand means. It serves as the gateway to various sections, from product categories to special offers, and is where users often return mid-session. Your homepage often sets the tone for the rest of the user’s journey, making optimization crucial.
One effective strategy is to experiment with the placement and labels of your call-to-action (CTA) buttons. Ensuring that users can quickly locate key actions, such as signing up or starting their shopping journey, can make a significant difference in engagement. Testing different CTA labels, such as “Explore Now” versus “Shop Now,” helps determine which drives the most conversions.
Additionally, it’s essential to test the layout and how content is presented. Category links, sales promotions, and other critical pieces of content should be placed in a way that draws attention without overwhelming users. Small adjustments—like changing the placement of sales banners or highlighting popular categories—can enhance the overall user experience and increase interaction with your content.
Areas to optimize
Header
Main Navigation
Categories
Content Pushes
Layout
AB Tasty customer success in action
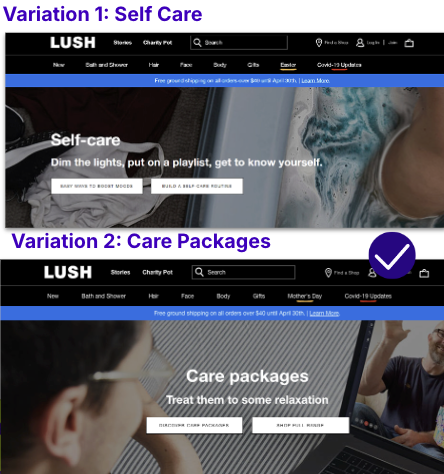
The beauty brand, Lush, shifted its homepage messaging by testing two variations—one focused on self-care and another on gifting care packages. The version centered on gifting led to a 250% increase in engagement, showing how even minor tweaks in messaging can significantly improve user interactions.
2. Product listing page (PLP)
The product listing page (PLP) is where users begin narrowing down their choices. This page is most effective when visitors can scan and compare products easily, helping them make decisions more efficiently. While it might seem like there’s limited space to display information, there’s a lot of room for optimization that can smooth the path to purchase.
Testing how high-quality images, clear pricing, and CTAs like “Add to Cart” are displayed can improve product visibility. Adding reviews or badges like “Best Seller” can boost credibility and urgency. Experiment with hover effects to show additional details when users hover over a product.
Experiment with the placement and functionality of filters to make product discovery easier. Test whether a sidebar, dropdown, or dynamic filtering works best for your users. Simple adjustments to category labels or sorting options, like by price or ratings, can enhance the shopping experience.
Areas to optimize
Product Card Information (e.g., imagery, price, CTA)
Reviews and Badges
Hover States
Filters and Sorting Options
Headers/Banners
AB Tasty customer success in action
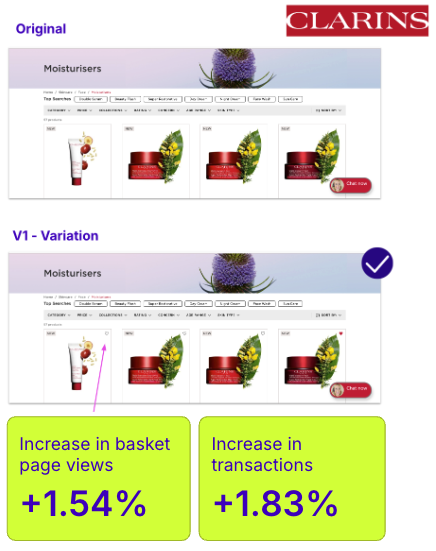
Clarins UK reintroduced the wishlist functionality to their PLP and PDP. This allowed users to save their favorite products for later, which led to a 1.54% increase in basket page views. It also increased the number of transactions by 1.83%, showing the value of small user experience enhancements.
It’s also important to consider the differences between mobile and desktop experiences when testing. A solution that works well on desktop might not perform the same on mobile due to varying user behaviors. Despite a long-standing focus on mobile optimization, it’s still common to overlook these differences.
3. Product display page (PDP)
The product description page (PDP) is the centerpiece of any e-commerce experience and at the center of a customer journey. Many retailers are now asking, “How can we make the PDP feel more like a landing page?” With more customers arriving directly on PDPs from social media, rather than the homepage, the PDP often serves as the first touchpoint. This makes it even more crucial, as it’s where customers ultimately decide whether or not to make a purchase. Reducing friction and providing clear, relevant information are essential to driving conversions at this stage.
Testing how high-quality images, clear pricing, and CTAs like “Add to Cart” are displayed can improve product visibility. Adding reviews or badges like “Best Seller” can boost credibility and urgency. Experiment with hover effects to show additional details when users hover over a product.
Experiment with the placement and functionality of filters to make product discovery easier. Test whether a sidebar, dropdown, or dynamic filtering works best for your users. Simple adjustments to category labels or sorting options, like by price or ratings, can enhance the shopping experience.
Key areas to experiment with
Product Imagery and Descriptions: Ensure your images and descriptions are high-quality, answering common questions about the product (e.g., size, fit, material).
Call-to-Action Buttons: Test the wording, design, and placement of your CTAs to find what drives the most conversions.
Additional areas to optimize
Page Layout (order of information)
Product Images and Videos
Shipping & Return Messaging
Cross-Sell Items
Call to Actions
Reviews and User-Generated Content
Experience for New Visitors
Mobile vs Desktop Experience
Add-to-Cart Behavior & Mini Cart
AB Tasty customer success in action
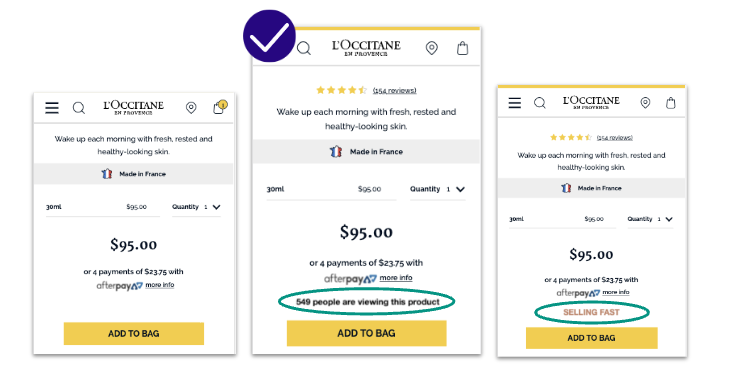
French beauty product L’Occitane implemented a social proof widget on its PDP, showing how many people had recently viewed a product. The first variation displayed “X people are viewing this product,” while the second version said “Selling Fast.” This simple tweak created urgency and reassurance, leading to a 5.76% increase in transaction rate and a 3.36% increase in revenue per visitor.
Social proof taps into user psychology—when customers see that many others are viewing or purchasing a product, it creates a sense of urgency and reduces anxiety, helping to drive sales.
4. Checkout funnel
The checkout process is where the real magic (or frustration) happens. It’s the final step in the customer journey, and even small obstacles here can lead to abandoned carts. Simplifying the checkout funnel can make the difference between completing a sale and losing a customer at the last moment. This stage is not just about speeding up the process—it’s also about building trust and ensuring customers feel confident in their purchase.
Optimizing your checkout involves refining everything from the mini basket to the confirmation page, making the experience as seamless as possible.
Testing opportunities
Product Imagery and Descriptions: Ensure your images and descriptions are high-quality, answering common questions about the product (e.g., size, fit, material).
Call-to-Action Buttons: Test the wording, design, and placement of your CTAs to find what drives the most conversions.
Additional areas to optimize
Basket Summary
Step Progression
Login and Guest Checkout Options
Account Creation
Form Field Labels & Microcopy
Payment Methods
Coupon Field Visibility & Design
Cross-Sells & Product Recommendations
Confirmation Page
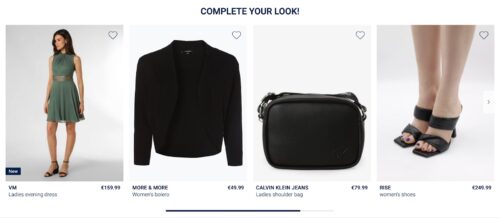
AB Tasty customer success in action
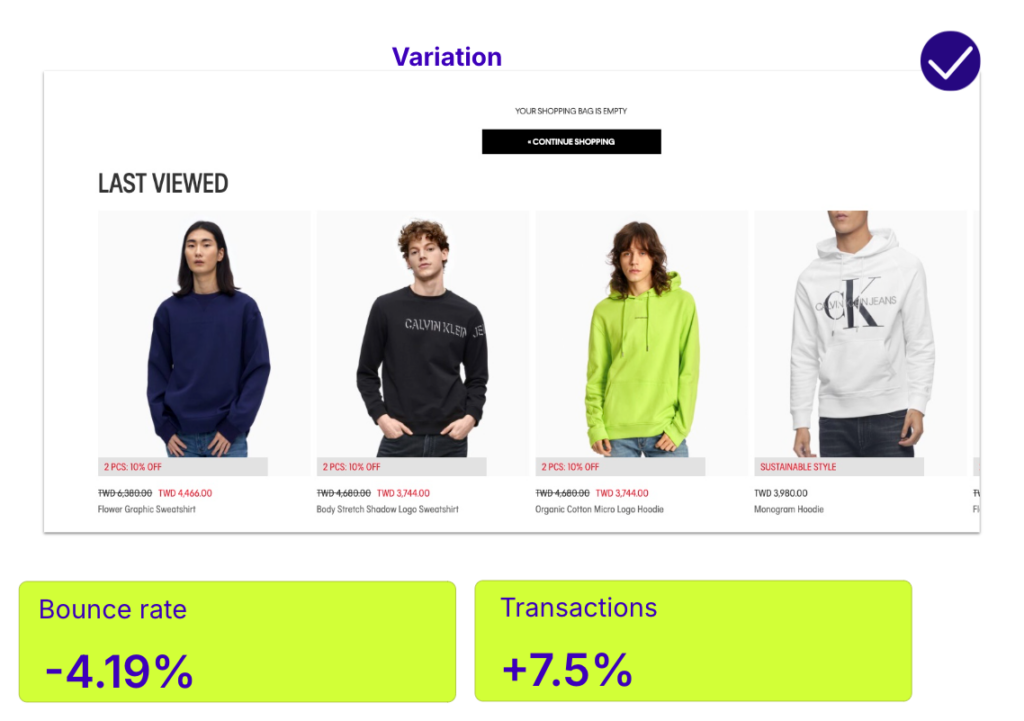
Calvin Klein ran a test where they displayed a “last viewed” carousel on the empty cart page after a user removed all items from their cart. This reminded users of previously viewed products, reducing the bounce rate by 4.19% and increasing orders by 7.5%. By preventing the cart from feeling empty and offering product recommendations, the brand successfully retained potential customers and increased conversions.
5. Personalization
Personalization is key to creating a unique and engaging experience for each visitor. In an online shopping survey, 88% of respondents rated personalized product recommendations as helpful when asked to score them on a scale of 1-5 (with 5 being very helpful and 1 not helpful). By understanding user behavior and segmenting audiences, you can deliver tailored content that enhances user satisfaction and drives higher conversions. Personalization not only improves the shopping experience, but also fosters customer loyalty, encouraging repeat purchases over time.
Start with
Behavioral Targeting: Personalize content based on how users interact with your site. For example, use data on past clicks or scrolling behavior to serve more relevant offers.
Abandoned Cart Reminders: Encourage users to complete their purchase by reminding them of items left behind.
AB Tasty customer success in action
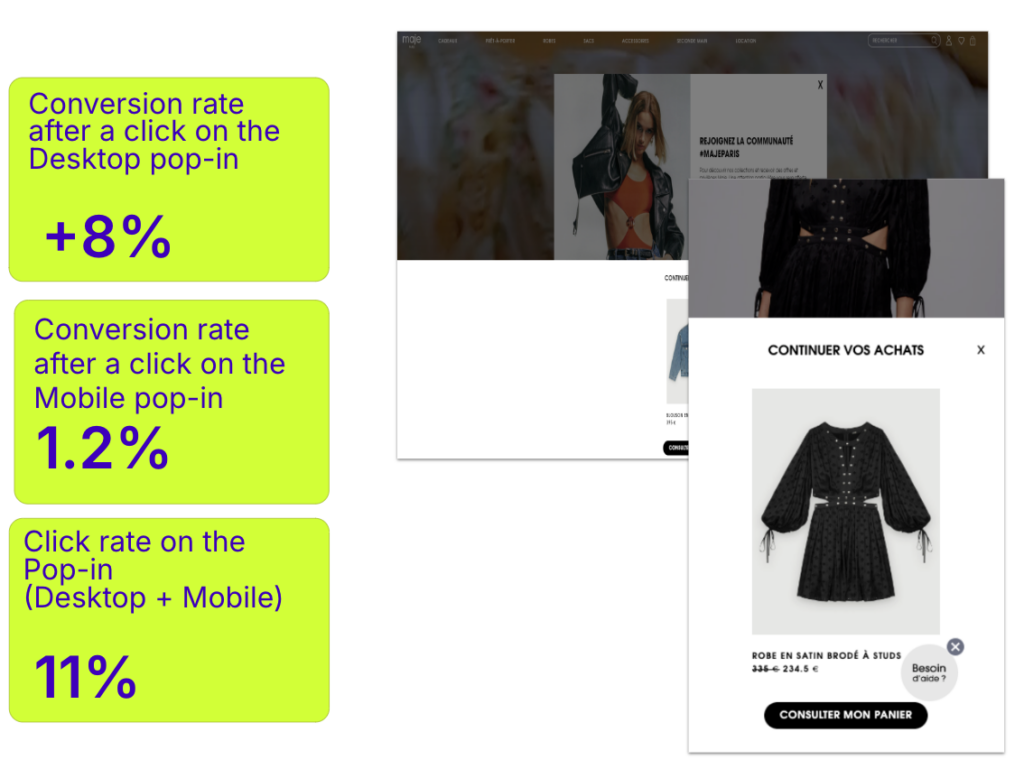
French fashion retailer, Maje created a personalized campaign for users who abandoned their carts. When those users returned to the site, they were shown the products they had previously left behind, making it easy for them to continue shopping. This strategy resulted in an 11% increase on click rate on the pop up, with a significant portion of those users completing their purchases.
In addition, AB Tasty tools like Emotions AI can help recognize emotional triggers or online body language (e.g., scroll behavior or clicks) to tailor content even further, providing users with the most relevant experiences.
Wrapping up
From optimizing your homepage to personalizing the user experience, every aspect of your website offers an opportunity for growth. Even small tests—like changing the placement of a carousel or adjusting CTA wording—can lead to significant results.
By regularly experimenting and optimizing key hotspots on your site, you can improve user engagement, reduce friction, and ultimately increase conversions. Remember, every site is different, so test frequently and use data to inform decisions. This approach helps ensure that you’re continually refining your site for optimal success.
If you want to get all the details. – watch the webinar below.
This guest blog was written by Kit Heighway, Director of Optimization, at Daydot, a digital agency that specializes in crafting exceptional experiences to drive measurable revenue growth. They are experts in Conversion Rate Optimization, Performance UX Design, and Customer Lifecycle Optimization for Subscription, eCommerce, and Non-Profit brands.
Let’s imagine you are relaxing at home after a long day’s work, when the doorbell rings. You jump up, eager to see what’s waiting behind the door – a new clothing item, a cooking kit, or perhaps a treat for your pet? The excitement is real, and it’s all thanks to your recent subscription box sign-up.
Subscription boxes have quickly become consumer’s favorite way to shop from brands they love. In fact, the global subscription box market is projected to exceed $75 billion by 2025.* With so many brands wanting to get in on the action, the key question is: how can you participate in a way that resonates with your audience? A/B testing subscription features is a great starting place.
The Daydot team dive into the subscription box world and try out 5 of the most popular subscription purchase journeys. In the article below, we share what features we loved the most, giving you our round-up of the best features to test on your digital subscription journey.
The subscription journeys reviewed: Abel and Cole, Bloom and Wild, Gin-box, Dear-bump, Bella & Duke, Perky Blenders, Butternut Box.
5 Subscription Trends to Test
1. Combining expected USPs with what makes your business different
In 2024 certain features have become standard expectations in the world of subscription services. Phrases like “Free delivery,” “Home delivery,” or “Cancel anytime” are no longer points of differentiation – they’re baseline consumer expectations. However, these essentials still matter, and this is where the savvier brands really stand out, by mixing their unique personality with those expected USPs.
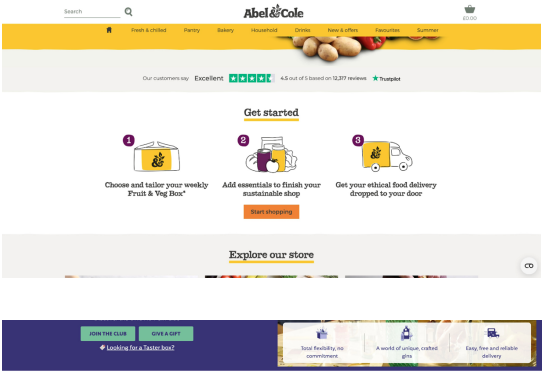
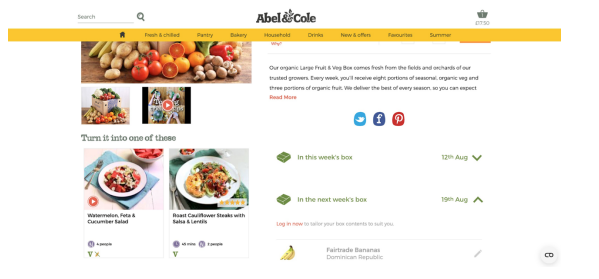
Take Abel & Cole, for example. As the leader in organic products, they don’t settle for the dull “Free delivery to your door.” Instead, they integrate their brand personality into the message with “Get your ethical food delivery dropped to your door.” It’s a small tweak, but it adds a layer of authenticity and makes a difference in standing out.
Abel and Cole: “Get your ethical food delivery dropped to your door”
Test ideas:
Expected USP copy improvements
2. Cancelation reassurance throughout the user journey
Subscription cancellation will happen but how you handle it can make or break the customer experience. A recent study shows that over 25% of consumers prioritize easy, penalty-free cancellations when choosing a service.* People value the assurance that they can leave without any hassle.
The best brands excel in this area by offering clear, upfront reassurance about cancellation. From the product listing page, where they confidently state, “There’s no commitment – you can skip or cancel at any time,” to the basket page with a gentle reminder, “Delivered weekly, but you can cancel anytime.” Right before the final step, they reinforce the message: “Count on us for reliable weekly delivery, with the flexibility to skip, pause, or cancel anytime.”
By making cancellation easy and transparent, these brands turn a potentially stressful decision into another positive touchpoint, helping customers feel in control from start to finish.
Test ideas:
Homepage cancelation reassurance
Product listing/details cancelation reassurance
Basket cancelation reassurance
Checkout cancelation reassurance
Cancelation messaging tone formal vs friend
3. Showcasing how subscriptions could fit into users’ real lives
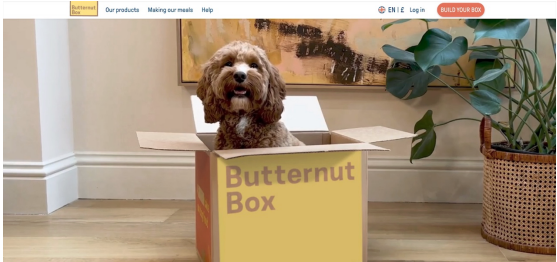
For physical subscriptions, the key is to make them feel tangible and exciting in the early stages of the purchase journey. In a digital world getting something tangible is a huge draw.
How can you showcase that experience on a website without sending samples?
Butternut Box achieves this with a fun, heartwarming video on their landing page. It walks potential users through the excitement of the box arriving at the door, the thrill of unboxing, and of course, a happy dog enjoying their treat. It’s more than just a video—it’s a mini-experience that brings the product to life.
And Abel & Cole? They’re leading the way again, by adding recipe ideas and videos directly on the product page. It’s far more engaging than a simple image gallery, sparking users’ imaginations and making their experience more immersive.
Test ideas:
An unboxing or arrival video
A social media feed showing real users enjoying your subscription
Previews of activities you can do with the subscription (like recipe guides, or dog games)
4. Remembering that users don’t just subscribe for themselves
It’s easy to overlook that many users aren’t subscribing for their own needs – they’re often gifting a subscription to someone special. Whether it’s for a child heading off to college or a new colleague at work, recurring subscription businesses miss this opportunity by sticking to a one-size-fits-all approach.
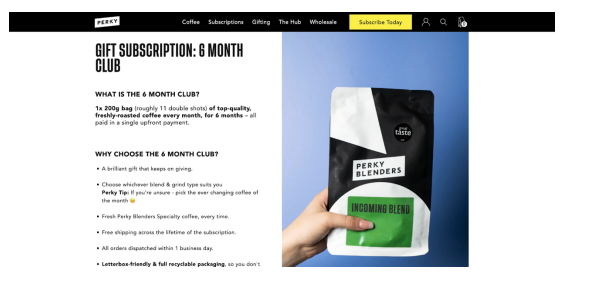
Perky Blenders, however, has mastered the art of gifting by offering flexible three, six, and twelve-month subscription options for their premium, freshly roasted coffee.
Test ideas:
Gifting subscription journey
Business gifting journey
Personalization based on gift giving intent (supporting a friend, new home, starting uni, new parent etc)
5. Not assuming that subscriptions will last forever
Consumers want subscriptions to be as hassle-free as possible. Hidden or complicated cancellation processes can be a major turnoff.
Surprisingly, more businesses aren’t testing fixed, limited-time prepaid subscriptions. Some customers don’t want to commit to an ongoing plan, no matter how easy cancellation is. Offering a set subscription period could disrupt the subscription box journey in a big way.
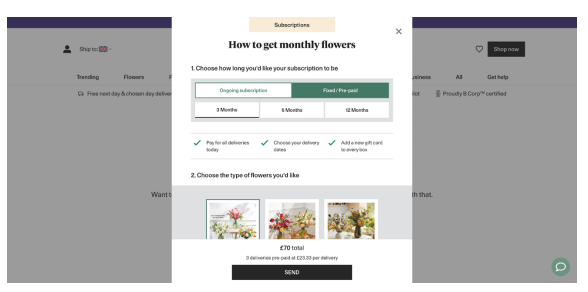
Bloom & Wild are ahead of the curve here, letting customers pick between three, six, and twelve month subscriptions without any automatic renewal.
Test ideas:
3 month fixed term subscription
6 month fixed term subscription
X time fixed term subscription (reflecting a particular life-stage your product may be purchased for)
Wrapping up
These five innovative strategies are helping subscription leaders enhance their customer journeys, boost conversions and drive revenue growth. Now is a good time to evaluate your own subscription flow and consider integrating some of these ideas. But don’t just copy and paste – Remember, about 80-90% of digital ideas flop because they weren’t tested first. That’s why Experimentation is essential before implementing. It allows you to identify what clicks with your users and ensures that you invest in features that deliver results, rather than relying on assumptions.
The future of digital experience optimization has arrived and it’s driven by AI.
Are you ready for it?
AI can often be a sensitive subject, as loud voices in the room will boast how AI can replace people, careers, or even entire sectors of society. We’re scaling back the dystopian imagery and instead finding ways where AI can be your sidekick, not a supervillain.
There are two sides to the coin with AI: it can help optimize your time and boost conversions, but it can also be risky if not used properly. We’ll dig into the ways AI can be a helpful tool, as well as some considerations to take.
The positive impact of AI on your customer experience roadmap
In one of our last pieces about AI in the CRO world, we discussed 10 generative AI ideas for your experimentation roadmap. Since the publication of this article, we’re back with even more ideas and concrete examples of successful campaigns.
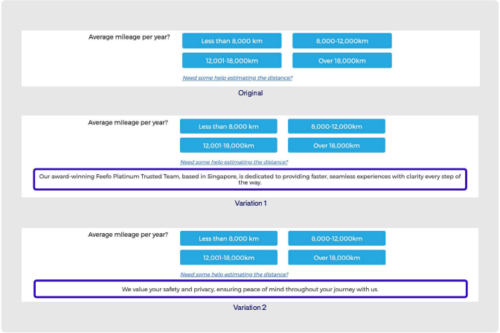
1. Display reassurance messages to visitors who value it
Some shoppers value their privacy and data safety above all else. How can you comfort these visitors while they’re shopping on your website without interfering with other visitors’ journeys? While salespeople can easily gauge these preferences in face-to-face interactions, online shoppers deserve the same personalized experience when they shop independently.
Let’s see an example below of how you can enhance the digital customer experience for different shoppers at the same time:
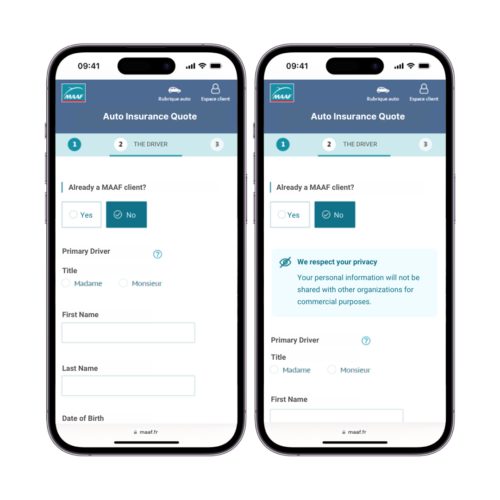
MAAF, a French insurance provider, knows just how complex buying auto insurance can be for visitors. Some shoppers prioritize safety and reassurance messages, while others don’t. With AI systems that segment visitors based on emotional buying preferences, you can detect and cater to this type of profile without deferring to other shoppers. “Intuitive” profiles are receptive to reassurance messages, while “rational” profiles tend to see these extra messages as a distraction.
The team at MAAF used advanced AI technology to overcome this exact challenge. Once the “intuitive profiles” were identified, they were able to implement personalized messages ensuring their commitment to their customers’ data protection. As a result, they saw an increase of 4% in quote rates for those directed to the intuitive segmentation, and other profiles continued on their journey without extra messaging.
2. Segment your audience based on their shopping behavior
With so many online shoppers, how can you possibly personalize your website to give each shopper the best user experience? With AI-powered personalization software.
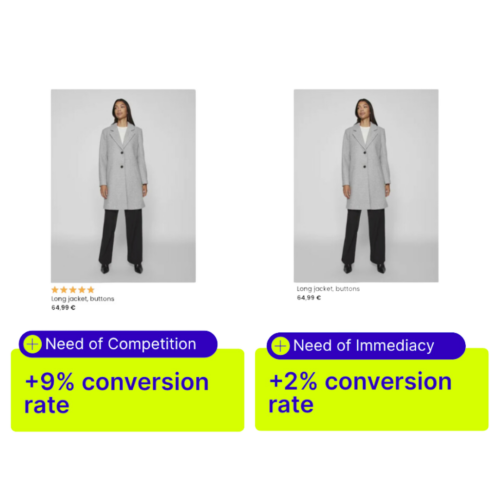
Some online shoppers have a need for competition. Don’t we all know someone who loves to turn everything into a competition? These “competitive” shoppers are susceptible to social-proof messaging and are influenced by the opinions of other customers while searching for the best product. One of the best ways to personalize a listing page for competitive shoppers is to show ratings from their peers.
Meanwhile, what works for competitive shoppers, will not work effectively for speedy shoppers. Shoppers with a need for immediacy will appreciate a clear, no-frills browsing experience. In other words, they don’t want to get distracted. Let’s look at the example below.
This website implemented two different segments targeting online shoppers with a need for “competition” and “immediacy.” These two segments brought in a 9% increase in conversion rates and a 2% increase respectively. The campaign was a success, but how did it work?
Using AB Tasty’s AI personalization engine, EmotionsAI, this online shop identified its visitors’ main emotional needs and directed them toward a product listing page best suited for them. EmotionsAI turns buyer emotions into data-driven sales with actionable insights and targeted audiences.
Want to learn more about EmotionsAI? Get a demo to see how AI can impact your roadmap for the better!
3. Automate and personalize your product recommendations
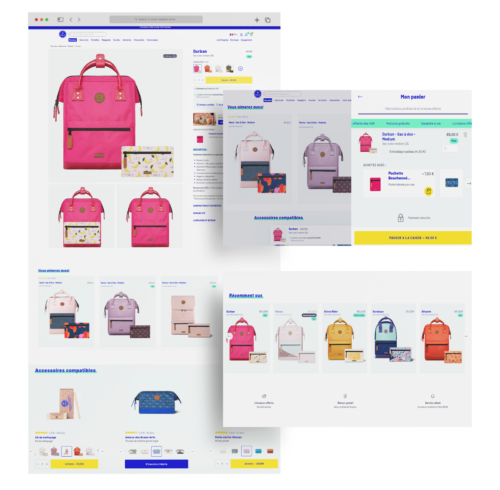
European backpack designer, Cabaïa, used an AI-powered recommendation engine to generate personalized recommendations for their website visitors based on user data collected. The team at Cabaïa previously managed product recommendations manually but wanted to shift their focus to improving the digital customer experience.
AI recommendation tools put the right product in front of the right person, helping boost conversions with a more tailored experience. Since implementing this AI-powered recommendation engine, they’ve had +13% revenue per visitor, increased conversions by 15%, and raised their visitor’s average cart size by 2.4%.
4. Innovate your testing strategy with emotional targeting
According to an online shopper study (2024), traditional personalization is no longer enough. Personalizing based on age, location, and demographics just isn’t as precise anymore.
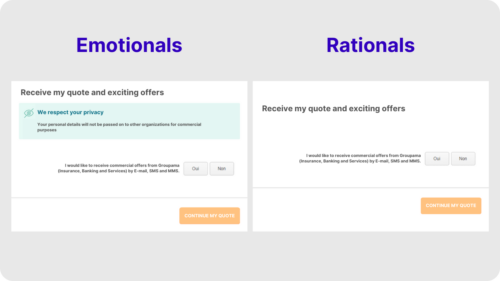
The team at Groupama, a multinational insurance group, wanted to take A/B testing a step further and better adapt their approach to fit their customers’ unique emotional needs. By using an AI-powered emotional personalization engine, they were able to identify two large groups of website visitors: emotionals and rationals.
They created an A/B test based on these customer profiles. One variation catered to the “emotional” buyers by showing reassuring messaging on the insurance quote to protect their data, and the other catered to “rationals” that displayed the insurance quote without any extra messaging that allowed them to have a distraction-free buyer journey. Within 2 weeks, Groupama saw an instant win with a 10% increase in quote submissions.
5. Simplify the customer journey and build buyer confidence
Like many financial services, purchasing insurance is inherently complex. Consumer behaviors and expectations in insurance are quickly changing.
As a leading insurer in Singapore, DirectAsia has embraced innovative technologies to better serve their customers. By pioneering new technology, Direct Asia was able to segment their visitors based on emotional needs.
The team at DirectAsia identified that the ‘safety’ segment (buyers needing reassurance) was the top unsatisfied emotional need for visitors on both desktop and mobile devices. With these insights, DirectAsia ran an experiment on ‘safety’ visitors, displaying two banners to reassure them and move them further down the form to the quote page.
The banners led to + 10.9% in access to the quote page for one, and +15% in access to the quote page for the other.
The potential risks of AI on your customer experience roadmap
Artificial intelligence has been evolving (very quickly!) over the past few years and it can be tempting to run full speed ahead. However, it’s important to find the right AI that works for you and helps you achieve your goals. Is AI powering something you need, impacting your business, or is it just there to impress?
With that in mind, let’s consider some precautions to take while using AI:
Unfactual or biased information on data reports, website copy, etc.
When researching or asking for data sources, it’s important to keep in mind that artificial intelligence can get it wrong. Just as humans can make mistakes and have biased opinions, AI can do the same. Since AI systems are trained to produce information following patterns, AI can unintentionally amplify bias or discrimination.
Lack of creativity, dependence, and over-reliance
Excessive reliance on AI can reduce decision-making skills, creativity, and proactive thinking. In competitive industries, you need creativity to stand out in the market to capture your audience’s attention. Your roadmap could suffer if you put too much faith in your tool. After all, you are the expert in your own field.
Data and privacy risks
Protecting your data should always be a top concern, especially in the digital experience world. You will want a trusted partner who uses AI with safeguards in place and a good history of data privacy. With the fast-developing capabilities of AI, handling your data correctly and safely becomes a hurdle. As a general best practice, it’s best not to upload any sensitive data into any AI system – even if it seems trustworthy. As these systems often require larger quantities of data to generate results, this can lead to privacy concerns if your data is misused or stored inappropriately.
Hallucinations
According to IBM, AI hallucinations happen when a large language model (LLM) thinks it recognizes patterns that aren’t really there, leading to random or inaccurate results. AI models are incapable of knowing that their response can be hallucinogenic since they lack understanding of the world around us. It’s important to be aware of this possibility because these systems are trained to present their conclusions as factual.
Conclusion: Using AI in the Digital Customer Experience
As with any tool or software, AI is a powerful tool that can enhance your team – not attempt to replace it. Embracing the use of AI in your digital customer experience can lead to incredible results. The key is to be aware of risks and limitations, and understand how to use it effectively to achieve your business goals.
If your organization is having trouble successfully running A/B tests in areas of your site where customers are going through the purchase flow, the issue may be due to Single Page Applications (SPAs) on your site. As customers move through the process, your A/B testing tool might not recognize their progress in an SPA environment.
There is enormous value in A/B testing critical areas of the web experience that are often operating in SPA environments, such as an eCommerce checkout.
This guest blog post was written by Jason Boal, The Principal Analyst & Optimization Strategist at 33 Sticks – a leading American analytics agency. Let’s address this common issue and uncover ways to overcome this to unlock hidden revenue on your site.
1. What is a SPA and how can I tell if the web experience uses one?
In a Single-Page Application (SPA) environment, content is loaded dynamically without requiring a full page refresh or reload. User interactions occur on a single page, with new content being loaded as the user navigates. Gmail is a prime example of an SPA. At a high level, an SPA functions similarly to a standard client-server interaction, but the key difference lies in what is returned to the browser.
To determine if you are operating in a Single-Page Application (SPA) environment on your site, pay attention to whether the page reloads as you interact online. If you see the page load indicator—such as the spinning icon in the browser tab (in Chrome)—it means the page is reloading, and you are likely using a traditional multi-page application (MPA).
Many websites are hybrids, meaning that only certain sections, like the checkout process, function as an SPA. To find out which parts of your site are SPAs, you can ask your development team for clarification.
2. Does my testing tool work within SPA environments and what do I do if it doesn’t?
Visual editors are becoming extremely popular in the A/B testing space, for many reasons. One is that Marketers are developing and launching more tests compared to the DEV team. If your testing tool has a difficult time loading and testing content in the visual editor, the reason could be that the tool is either not equipped or not set up to properly handle SPAs. This often happens in a secure checkout flow, where the customer is required to step through items like shipping address, billing, etc. The page you are attempting to A/B test on will not properly load in the visual editor and you will receive an error message.
FIGURE 1 – VISUAL EDITOR SPA ERROR MESSAGE
Ask your vendor if your testing tool can detect changes in the DOM and if it has a mechanism to look for timing.
Here are two challenges that some A/B testing tools face:
Visual Editors: Some A/B testing tools rely on the initial page load to determine what content to modify. These tools may struggle when content needs to change without a page reload. For example, if your test content is on page 3 of your site’s checkout flow, which is an SPA, the tool might not detect the need to inject content changes because there are no page loads as users navigate through the checkout flow.
Timing: As content on the page changes, it can be tricky for an A/B testing tool to insert test variations at the right moment. Variations can’t be applied before the content starts loading, but waiting until the content has fully loaded can result in users seeing the content change, a phenomenon known as “flicker.”
AB Tasty has extensive experience creating A/B tests in Single-Page Application (SPA) environments. We recommend implementing a delay on our tag’s execution so that it only triggers when the page is fully ready. This is achieved using a proprietary locking mechanism. This is just one example of how AB Tasty stands out in the A/B testing industry.
3. How do I take it to the next level?
Once you’ve unlocked A/B testing in SPAs, it is time to brainstorm testing ideas and develop a strategic roadmap to uncover ways to increase revenue for your organization. Here are a few ideas to help you jump-start that process!
Test various methods of updating cart quantity.
Test product detail page functions such as color variant selection methods.
Test buy box functions such as stock amount and store information.
Test different shipping messages based on cart value.
Test reordering flow steps.
Test navigation patterns or menu structures to optimize user flow within the SPA.
A/B test various UI/UX elements like buttons, forms, or interactive features specific to your SPA.
Test personalization strategies based on user behavior and interactions within the SPA.
Key Takeaways
There is enormous value in A/B testing critical areas of the web experience that are often operating in SPA environments, such as an eCommerce checkout flow. This is usually the last stage of any digital customer journey and vital to get right.
Determine whether or not your site leverages SPAs anywhere on your site.
Dig into your testing tool to ensure it can properly load test content changes with SPA environments.
Understand what other AB testing tools are out there and how they handle SPAs.
Develop an optimization roadmap based on your new knowledge!
Shiva Manjunath shares how debunking best practices, embracing failure, and fostering a culture of learning can elevate experimentation to new heights.
In this episode of The 1000 Experiments Club, guest host and AB Tasty’s Head of Marketing, John Hughes, sat down with Shiva Manjunath, Senior Web Product Manager of CRO at Motive and Host of the podcast From A to B. Shiva’s journey through roles at Gartner, Norwegian Cruise Line, Speero, Edible, and now Motive, has made him a passionate advocate for the transformative power of experimentation.
During their conversation, Shiva discussed the pitfalls of following “best practices” blindly, the importance of creating an environment where failure is seen as a step toward success, and how companies can truly build a culture of experimentation.
Here are some of the key takeaways.
The myth of ‘Best Practices’
Too often, the so-called experimentation best practices become a checkbox exercise, rather than a thoughtful strategy.
“If you’re focused on best practices, you’re likely missing the point of true optimization,” Shiva notes.
He recounted a situation at Gartner where simplifying a form—typically hailed as a best practice—actually led to a sharp drop in conversions. His point? Understanding user motivation and context is far more important than relying on one-size-fits-all rules. It’s this deeper, more nuanced approach to experimentation that drives real results.
“If what you believe is this best practice checklist nonsense, all CRO is just a checklist of tasks to do on your site. And that’s so incorrect,” Shiva emphasized, urging practitioners to move beyond surface-level tactics and truly understand their audience.
Embracing failure in experimentation
A major theme of the discussion was the pivotal role failure plays in the journey to success. Shiva was candid about his early experiments, admitting that many didn’t go as planned. But these “failures” were crucial stepping stones in his development.
“My first ten tests were all terrible. They all sucked,” Shiva admitted, underscoring that even the most seasoned experts start with mistakes. He stressed that organizations must create an environment where employees can experiment freely, learn from their mistakes, and continue to improve.
“If you’re penalized for running a losing test, you’re not in a culture of experimentation,” Shiva insists.
Organizations that punish failure are stifling innovation. Instead, Shiva advocates for an environment where employees can test, learn, and iterate without fear. “The idea that you have the flexibility to discuss failures and focus on, ‘Well, I ran this test. It lost. Now, what do we do next?’—that’s a culture of experimentation.”
Scaling experimentation maturity
Shiva also explored the varying levels of experimentation maturity within organizations. Many companies claim to have a “culture of experimentation,” but few truly practice it at scale. Shiva emphasized the importance of making experimentation accessible to everyone in the organization, not just a select few.
Reflecting on the loss of Google Optimize, Shiva acknowledged its role as a gateway into the world of experimentation. “I got into experimentation through Google Optimize,” Shiva recalled, recognizing the tool’s importance in lowering the barrier to entry for newcomers. He urged companies to lower barriers to entry and enable more people to engage with experimentation, thereby fostering a more mature and widespread culture of testing.
The role of curiosity and data in experimentation
Another critical point Shiva raised was the importance of curiosity in experimentation. He believes that genuine curiosity drives the desire to ask “why” and dig deeper into user behavior, which is essential for effective experimentation.
“If you’re not genuinely curious about the why behind many things, I don’t know if experimentation is the field for you,” Shiva stated, underscoring curiosity as a crucial soft skill in the field.
Shiva also highlighted the foundational role of being data-driven in any experimentation strategy. However, he cautioned that having data isn’t enough—it must be effectively used to drive decisions.
“If you’re in a business setting and the business looks at your program and this is zero test wins, right? And then after two years, they would rightfully say ‘is this the way it’s supposed to go?’” Shiva remarked, pointing out that data-driven decisions are key to sustaining a culture of experimentation.
What else can you learn from our conversation with Shiva Manjunath?
Why it’s crucial to critically evaluate industry buzzwords and ensure they align with real practices.
How true personalization in experimentation goes beyond just adding a user’s name.
The need for thorough analysis to genuinely support data-driven decisions.
Shiva’s take on the future of experimentation after Google Optimize and how companies can adapt.
About Shiva Manjunath
Shiva Manjunath is the Senior Web Product Manager of CRO at Motive and Host of the podcast From A to B. His insatiable curiosity about user behavior and deep passion for digital marketing have made him a standout in the world of experimentation. With experience at top companies like Gartner, Norwegian Cruise Line, and Edible, Shiva is dedicated to demystifying CRO and pushing the boundaries of what’s possible in the field.
About 1,000 Experiments Club
The 1,000 Experiments Club is an AB Tasty-produced podcast hosted by John Hughes, Head of Marketing at AB Tasty. Join John as he sits down with the experts in the world of experimentation to uncover their insights on what it takes to build and run successful experimentation programs.