
The Ultimate Conversion Rate Optimization Guide
Our comprehensive guide is here to provide you with expert CRO insights. From definitions to best practices to more resources – we’ve got you covered!


Conversion Rate Optimization
As you know, marketing (and shopping) has moved online. Whether you operate an e-commerce store or a business-to-business operation, you are constantly driving your prospects to take specific actions, like buying a product, signing up for a newsletter, or downloading a free e-book. Whenever a user completes an action, this is seen as a conversion. Conversion rate optimization is the practice of raising the number of users interacting with your site. While this is usually done through a series of small, gradual improvements, the end goal is to optimize your entire online marketing process.
First, let’s get back to basics about conversion rate: what it is, how to calculate it, how to improve it, and how to make sure you don’t get in your own way. Ready? Let’s go!
Table of contents
- The Ultimate Conversion Rate Optimization Guide
- Conversion Rate Optimization
- What is Conversion Rate Optimization?
- Conversion Rate Definitions
- How do you calculate conversion rate?
- What is a good conversion rate? (with examples)
- Benefits of Conversion Rate Optimization
- How to create a CRO strategy
- Phases of your CRO strategy
- Components of CRO
- Best CRO Practices
- CRO Mistakes to Avoid
- FAQs about Conversion Rate Optimization
- The best CRO resources


What is Conversion Rate Optimization?
Before we get into conversion rate optimization, let’s take a deep dive into what conversions and conversion rates are and how to track them.
What is a conversion?
A conversion can refer to virtually any action taken online. It doesn’t refer to a specific action, like a sale, but to any action that you consider valuable to your business. A conversion (also called an event) can be a click, a purchase, a swipe, or a download.
Your conversion rate is the number of conversions that occur in relation to the total possible conversions in a given timeframe. (More on that later!)
Conversion Rate Definitions
It doesn’t matter what business you’re in; you will always try to increase your conversions. While you might be tempted to spend more money on advertising, greater awareness doesn’t always lead to more sales.
Conversion rate optimization is a much more affordable and effective way of acquiring more traffic because you can make educated, data-driven adjustments that focus on the traffic you already have. You can concentrate on micro-conversions (for example, getting your customers to fill out forms so your sales team can give them a call and push them through the funnel) or macro-conversions, like confirmed purchases.
What is a conversion rate?
The easiest example to illustrate conversion rate is in the context of e-commerce. Conversion rate is often used by e-commerce sites to measure the percentage of visitors that end up purchasing products. In other words, how many go through the entire conversion funnel.
If you’re an e-commerce company, your goal will be to optimize your conversion rate, which should lead to increasing your bottom line. Conversion tracking can be done through any web analytics platform, like Google Analytics, Adobe Analytics, or Mixpanel, for any period of time.
Macro vs micro-conversions
You may have heard references being made to macro and micro-conversion.
Macro-conversions (or website goals) usually refer to the conversion of a visitor into a paying client or subscriber of a web service, e.g., an online magazine membership, streaming service, or software-as-a-service (SaaS) monthly subscription. These are sometimes called website goals.
On the other hand, micro-conversions are seen as smaller, secondary actions that a visitor takes on a website that indicates that they will convert, for example, clicking through to the site, watching a promotional video, or adding an item to your cart.
Can a user convert twice?
Should you pay for conversion if a single user performed the same action twice? Deduplication is the method we use to ensure that the right partner is credited and that clients aren’t overcharged for conversions.

Until now, all of the conversions measured by AB Tasty have followed a deduplication method. If a user accessed your conversion URL twice, we would only count one conversion for that web user. This was the case for URL and event-type objectives, such as click tracking. The transaction objectives, set explicitly by our e-commerce tag, were the only exceptions. For these objectives, you have the option of displaying the conversions in the report in deduplicated (by default) or duplicated mode.
The deduplication method is best suited if you want to track macro-conversions. You want to know whether or not your modifications impacted your ability to, more or less, convert your users into subscribers.
For micro-conversions (e.g., add to cart, access to content), the duplication method offers a complementary perspective. For example, in the case of user interactions with your interfaces, you may wish to measure whether your tests allow more users to use any element of the interface, but also whether it generates a lot of use. The conclusions of a test consist of emphasizing whether a new functionality would be different if, despite the increase in users accessing it, it does not create any repeated use (the concept of “stickiness”). The deduplication vision responds to the initial question, while the duplication vision responds to the second.
How do you calculate conversion rate?
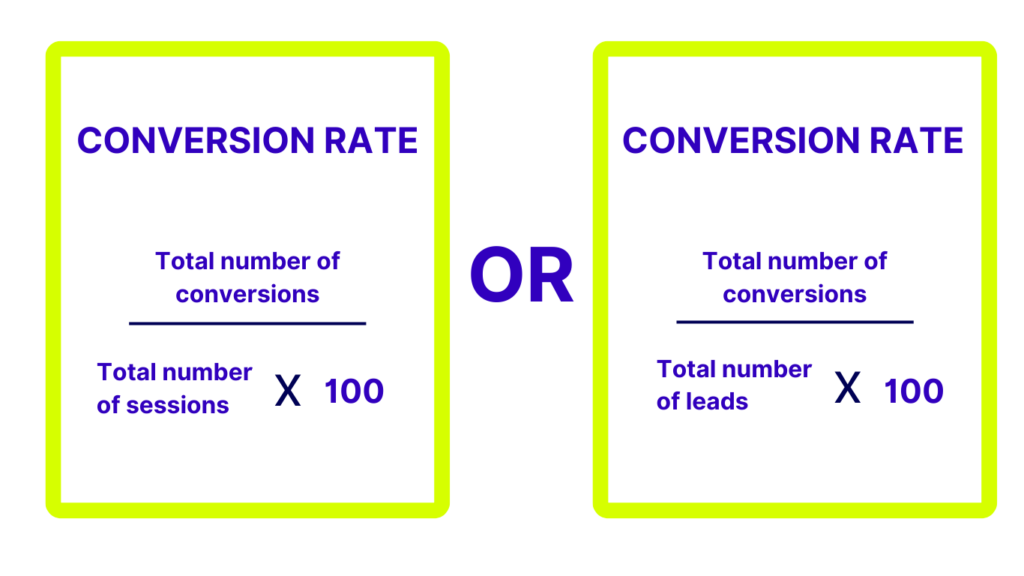
Now that you know what a conversion rate is, you want to calculate your conversion rate and measure the effectiveness of your site. Don’t worry – you don’t need crazy math skills. All you have to do is divide the number of actions completed in a defined period of time by the total number of visitors to your website, then multiply the result by 100.
In other words:
Conversion rate = (Conversions or goals achieved / Total visitors) * 100
Imagine that your e-commerce website got 25,746 visitors during a chosen time frame; of those 25,746 visitors, 4,832 completed a transaction. Then, your conversion rate is 18.76%. Pretty good!
Depending on what you’re looking to measure, you can also calculate the conversion rate in the following ways:
You can also find an automatic conversion rate calculator to get a precise calculation of your website’s conversion rate for those not doing their own math.
What is a good conversion rate? (with examples)
Benchmarking conversion rates isn’t easy. An FMCG (fast-moving consumer goods) e-commerce site might have a completely different conversion rate to a site that sells insurance. Two to five percent is considered a good conversion rate; remember that even a minor jump in conversions can have a significant impact.
Try to compare a site that is most similar to yours. The ADI Consumer Report for 2020 shares the following stats:
| Industry | Conversion Rate in % |
| Health and Pharmacy | 5.8% |
| Gifts | 4.7% |
| Apparel and Footwear | 3.9% |
| Sports | 2.8% |
| Jewelry and Cosmetics | 2.7% |
| Automotive Parts | 2.5% |
| Furniture and Decor | 2.3% |
| Major Chains | 2.3% |
| DIY & Tools | 1.6% |
| Consumer Electronics | 1.7% |
How to create a CRO strategy
According to Forrester Research, 90% of firms rated their CRO program as valuable or extremely valuable on a Likert Scale when it comes to achieving their strategic goals. Let’s examine how you can create your winning CRO strategy.
Why your CRO strategy matters
CRO can transform your business for good. A recent survey by marketing firm Outgrow found that among 3,000 companies, 5% of companies investing in CRO tools reported an ROI larger than 1000%. While your business might not enjoy that level of growth, the average ROI for the companies surveyed stands at 223%; and more than 70% of marketers use CRO campaign results to inform their campaigns.
If executed correctly, CRO strategies can improve landing page conversions, identify buyer personas, reduce cart abandonment and increase sales.

Setting clear CRO goals
Before setting up your CRO campaign, define your Key Performance Indicators (KPIs). Try to be as detailed as possible. Good examples include:
- Decreasing your bounce rate by 10%
- Increasing the average browsing time by 1 minute
- Reducing cart abandonment rates by 25%
- Increase site speed by 1.5 seconds
- Increase subscriptions by 5%
- Increase page views
- Increase newsletter subscribers
A good KPI is specific, measurable, and limited to a specific timeframe. Once you know what you are aiming for, you can start executing.
Phases of your CRO strategy
You’ll soon discover that the entire process of optimizing conversion rates will provide a wealth of information that you can explore and utilize in your future campaigns. While A/B testing is the most common experiment that CRO experts run, true optimization is more robust.
Phase 1: Research and discovery
our first step will be trying to identify opportunities for improvement. This could be anything that prevents a visitor from converting, such as bad copy to UX bottlenecks. You’ll start by analyzing your existing site in Google Analytics and choosing a limited number of opportunity pages to optimize.
From there, you can choose the metric that you want to compare and improve upon, e.g., high bounce rates or low average session duration. The pages you want to test should have sufficient traffic and be important enough to your business that making improvements will deliver a real impact. Once you’ve identified the pages, you can hone in on why users aren’t converting as well as they should.
Try to answer the questions, “How are people finding this page?” and “What is their pre-click experience like?”, Knowing this will help you hone in on the user intent (i.e., what value they hope to get out of their visit). You can see this by visiting Google Analytics and examining the Default Channel Group of the URL you want to analyze. This will reveal the sources that are leading people to your page.
You can use various on and off-site testing methods to reveal possible bottlenecks or barriers to conversion, including user testing, session replays, heat maps, click maps and heuristic analysis. The insights you gather should give you enough information to create a detailed hypothesis to test.
Phase 2: Hypotheses and prioritization
While (theoretically) there’s no limit to the number of hypotheses you can test for, companies have finite resources and a limited amount of time to devote to testing, which is where prioritization comes in. You don’t want to focus on hypotheses that won’t move the needle.
To combat this, we can follow two guidelines:
- Come up with testable hypotheses (follow this guide on how to do this).
- Ruthlessly prioritize ideas based on effort and ease.
There are plenty of prioritization models out there you can follow, the most popular being ICE, PIE, and PXL. You want to determine which actions will generate the greatest impact on the effort and resources you’re putting in. Deciding on an objective way to choose between hypotheses will go a long way toward creating predictable, repeatable CRO processes. All prioritization frameworks have pros and cons, so don’t waste too much time picking the right one. Choose one, stick to it, and get started.
Phase 3: Experimentation
Finally, we have experimentation. This is the stage that everyone associates with CRO: A/B testing. A/B testing is a common CRO technique that involves changing one aspect of your website — the color of a CTA, the length of a form, etc. — and observing whether this change positively or negatively impacts your chosen KPI. If your variation provides better results, you can hard code it into your site.
Testing is a process that requires statistical knowledge to get it right. You don’t necessarily need to have a data scientist looking over your shoulder, but it wouldn’t hurt to have some guidance on your first few experiments. (We’ll get into best practices a little later on).
There are several tools you can use to run A/B tests. AB Tasty is a solid solution for running a website, blog, or product experiments and any web personalization.
If you’re experimenting with your pop-ups or your email list, it’s almost certain that your tool of choice will have some sort of A/B testing feature native to the product. That’s certainly true of something like HubSpot or Mailchimp.
In any case, just make sure you can:
- Set up experiments correctly (i.e., the page has enough traffic to draw meaningful insights)
- Randomize and deploy experiences (with the help of a testing tool)
- Analyze the experiments correctly
If you don’t have enough traffic to the page you want to test, you can:
- Validate using qualitative research
- Roll it out and watch the time-series data
You can validate copy changes through Five Second Testing. Show users a design or copy for five seconds, and then ask follow-up questions about what they saw and remember. You can validate usability changes through user testing, session replays, or polls.
Additionally, keep an eye on the data before and after you roll out the changes. If the change is big enough, you can see the bump in the data over time. The numbers certainly shouldn’t go down. You can also try a Bayesian time series model to see if your changes produced significant results, given other implicit trends like seasonality.
It’s not necessarily the best approach, but it is a quick and more scientific way of measuring changes and improvements.
Phase 4: Analysis and repeat
The analysis is tricky, and your best bet would be to engage with a specialist to help you make sense of the data. If you don’t have an analyst, you should take some time to go over the basics. There are many books you can read on the subject of great online resources:
- Statistical Analysis and A/B Testing
- Data science you need to know! A/B testing
- Guidelines for A/B Testing
- How to Calculate, Track, and Analyze Conversion Rates
Important note: before you run the test, you should decide upfront what action you will take if the test wins, loses, or is inconclusive. That way, you mitigate the effects of confirmation bias and cherry-picking.

Best CRO Practices
It’s hard to compile a list of best (and worst!) CRO practices because every company is different. In fact, that’s why we have to test every assumption we make — there simply isn’t a one-size-fits-all methodology that works for every site, every time. You have to spend time understanding how your customers think and behave and what their preferences are.
Here are a few strategies you can try as you embark on your optimization journey:
1. Run A/B tests on your landing pages
Landing pages are designed specifically to convert your users to a specific action, like capturing a lead or buying a product. An optimized landing page might be the only thing you need for business to boom, so make sure you thoroughly test and improve the landing pages that have the most impact on your bottom line.
To run an A/B test, you should put at least two different landing pages against each other, differentiated by a single element. This could include different calls to action, different designs, copy lengths, and images. Make sure that your landing page is visually appealing, and be prepared to redesign the entire page if it’s not converting. Remember, it’s not about your preferences: it’s about your customers.
2. CTA copy and color combinations and placement
Experimenting with a CTA button (including changing the wording, font, and copy length as well as color combinations and where the buttons are placed) is a great way to test your site and improve conversion.
For example, let’s say you’re an AB Tasty client and you’d like to increase clicks to the “Confirm purchase” CTA on your basket page. Using our visual editor, you can test if changing the color of the CTA from blue to green will help. Since you’ve already got AB Tasty’s tag on your website, you can get this test up and running in minutes.
Unbeknownst to them, a shopper on your site will either be presented with the original version or the variation. This process is randomized so that the pool seeing version A is more or less identical to those visiting version B. Since you’ll have set your test’s KPI to be “Clicks on CTA,” you can easily see in the report which variation performed best once enough visitors have been exposed to the test to make it statistically significant.
3. Page layout testing
Website navigation has a significant impact on user experience. If you have high bounce rates or low session duration, make sure to test different variations of your page layout. Is it easy for users to find what they are looking for? Are they able to find and use the search bar? Most websites have their search bar located on the top right corner of the site, above the fold. Design-wise, it might look better to place it somewhere else, but non-conventional placement can make it difficult for users to find. Drop menus are popular, but a lot of website visitors find them annoying because their eyes move faster than their mouse, which makes them hard to use. A different menu format can make a big difference.
4. Pop-ups and urgency
Pop-ups have a bad reputation, but they can be extremely useful tools if used correctly. A pop-up letting users know that they can receive an additional 10% off if they sign up for the newsletter before checking out is a great motivator. They can also be used to create a sense of urgency. This is usually found on accommodation sites letting you know that four other people are looking at the same room as you or on e-commerce sites that tell you that there are only two units of the item you are looking at in stock. Personalized offers, time-limited offers, and free delivery offers are valuable conversion tools for customers because the benefits outweigh the intrusiveness of the pop-up.
5. Clean, actionable web copywriting
Copywriting isn’t easy. Often it’s not what you say, but how you say it (and present it). A few simple phrases that clearly state what you want your visitor to do and know about your brand are often more effective than long-winded essays about your years of experience in the business.
Good copywriting for a website is concise and easy to understand, even at a glance. If you are writing a more complex article, such as a troubleshooting guide, try to solve their problem right away by making it easy to find their question and then guiding them through the steps. Remember that most people don’t like to read, so include lots of imagery and video where possible to break up the text.
SEO forms part of your copywriting and CRO considerations as well. Try writing SEO-optimized copy for every step of the buyer journey, whether they are simply looking for information to solve a problem, doing comparison shopping, or ready to make a purchase.

CRO Mistakes to Avoid
In Conversoin rate optimization, there’s no secret recipe achieving higher conversion rates. However, there are a few common mistakes you can avoid in the process of finding what works best for your business.
Check out our list of CRO mistakes to avoid below:
1. Conversion Killers
While there is no magic wand to wave during CRO that will guarantee a better result, there are a few things that are surefire conversion killers. You have to be willing to kill your darlings or, more specifically, kill off pages and posts that are hurting your conversion rates instead of helping.
2. Too many distractions
Too many bells and whistles will only get in the way. Multiple calls to action, gimmicky animation, and pages overstuffed with copy and images will cause more frustration than conversion. Visitors should be able to find what they need easily. Avoid clutter and decision fatigue by presenting options in a neat, intuitive, and organized way.
3. Slow site speed
Consumers are used to websites loading at lightning speed — even a two-second delay can increase bounce rates by 100%! A slow loading time can negatively impact your SEO as well as your UX, so make sure that you keep your site running optimally to prevent your site speed from negatively affecting your conversion rate.
Unclear navigation
Have you ever entered a building and found yourself hopelessly lost and frustrated because of the layout? Website visitors have even less tolerance for sites that aren’t easy to navigate because they can simply click away and visit a competitor’s site. If your site isn’t intuitive to use, your bounce rates will go through the roof.
5. Ultra-long forms
Data is powerful and important, but you have to keep your customers’ preferences in mind. If your data collection form is too long and too detailed, you risk your customers abandoning the form altogether. Shorter is always better when it comes to web forms.
6. Forced account creation
Data privacy is a hot topic, and very few people are willing to hand over their email addresses and details to a website. Give customers the option to checkout as a guest and convince them to sign up with compelling offers and freebies (like e-books) instead of forcing them to create an account before they are ready.
The best CRO resources
You will find plenty of information about conversion rates on our blog, but if you’d like to bookmark a few outside sources, we can recommend the following thought leaders: