E-Commerce never stays still. That’s why we’ve put together a roadmap to help you understand the 2026 consumer in our e-book, The Spontaneous Shift: Consumer E-Commerce Trends for 2025. But amidst the rise of new tech, the old rules of friction still apply. Online shoppers still hate intrusive pop-ups, and they still crave connection with brands they trust.
Visitors just want to be heard
For the second year in a row, our research indicates that the problem of “too many pop-ups” is by far and away the number one frustration for online consumers around the world. That shows that interruption marketing treads a fine line. Pop-ups can be a great way to drive engagement on your website but overusing them is also a big reason why people leave without making a purchase.
Our research also indicates that the human desire to be recognized for who we are is stronger than ever. When we asked what makes an online shopping experience feel personal, a resounding majority said personalized offers/promotions (57%). And yet, only 10% of shoppers felt that their favorite brands “completely” understand them. While 60% said that their online shopping experience was only “moderately” personalized.
Harness the power of personalization
Taken together, what do these different pieces of information mean? What they tell us is that shoppers increasingly want relevance over noise. They don’t want more messaging; they want better messaging that’s more targeted to their needs. They want and even expect a personalized buying experience. The good news is that personalization also lets you build stronger relationships with visitors to your website.
By sending the right messages to the right people at the right time, you can turn things like pop-ups from frustrations into golden opportunities to provide value and drive engagement. And when our research also shows that 85% of shoppers are open to impulse buys, the opportunity to increase basket size through targeted personalized recommendations is massive.
Fortunately, there are now AI-powered tools available that make it easier than ever to personalize your interactions with visitors and treat them like the VIPs they are.
AdaptiveCX: say goodbye to the unknown
If you want to offer visitors to your website unique messages and personalized recommendations, you obviously need to gather some information about them. That’s much easier if you can convince visitors to create an account and provide you some basic information. But what about the up to 90% of visitors who are aren’t signed in and anonymous?
Traditional analytics can’t see visitors with no data and no history. Our AdaptiveCX predictive AI enables you to identify visitors in real-time, as they are browsing your website, even the anonymous ones. It adapts to each visitor’s behavior as it happens, ensuring they get a tailored experience and maximizing both engagement and sales.
How AdaptiveCX works in real-time
Analyzes live signals: AdaptiveCX captures every click, scroll, and pause to understand visitor intent as it happens.
Predicts intent instantly: Its predictive AI learns from these interactions to anticipate every visitor’s needs, even when they have no prior history on your website.
Delivers real-time results: Adaptive search, personalized recommendations, and tailored content are all delivered in real-time to each visitor.
Solves the anonymous visitor challenge: Transforms what were previously blind spots into conversion opportunities, no matter who is visiting.
Leading brands are now adapting every moment in real-time, and the results of our clients who are using AdaptiveCX speak for themselves:
- +10% Conversion rate
- 2.5x Retention rate
- +15% Revenue per visitor
Example AdaptiveCX use cases
Here are just a few of the ways in which you can use AdaptiveCX:
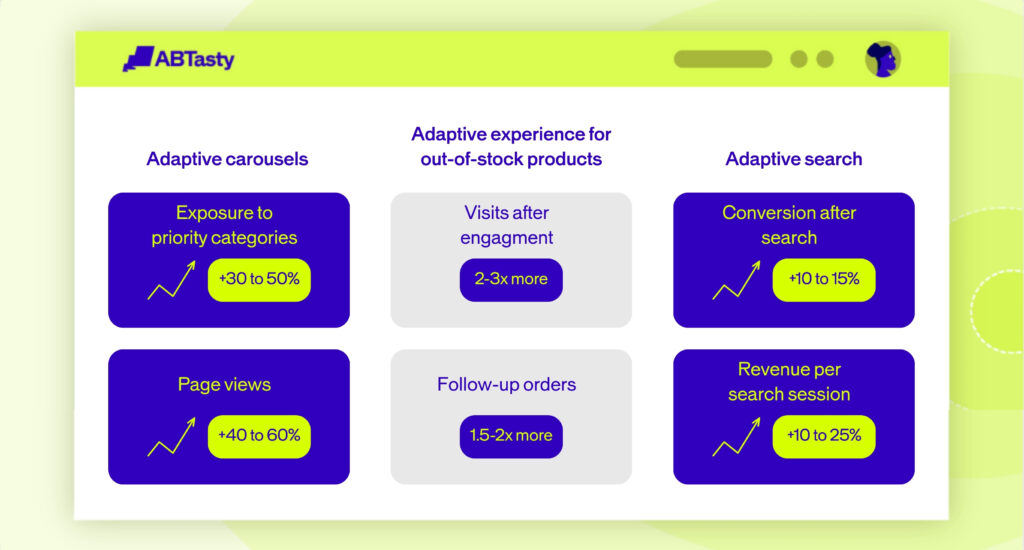
- Adaptive carousels: Reorder product categories in real-time based on intent, driving deeper exploration and discovery. Users report 30-50% increased exposure to priority categories and a 40-60% increase in page views.
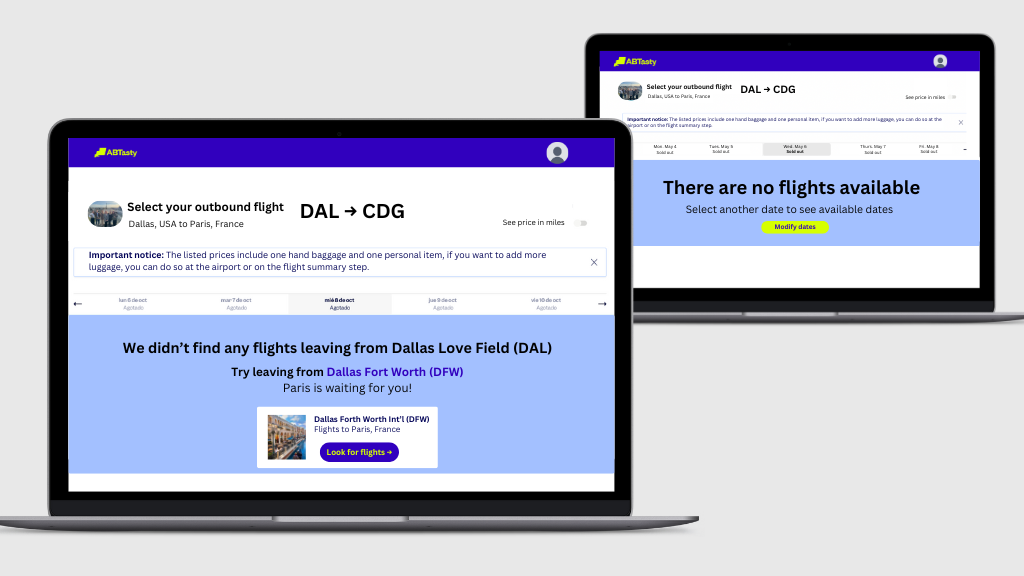
- Adaptive experience for out-of-stock products: Instantly show personalized alternatives that match visitor intent and sharply reduce abandonment. Users report 2-3x more visits after engagement and 1.5-2x more follow-up orders.
- Adaptive search: Pull visitors into search using intent-based prompts and smart widgets. Users report an increase in conversion after search of 10-15% and 10-25% more revenue per search session.
Emotions AI: see what really drives your audience
Standard personalization can help you create more relevant buying experiences for visitors. But when you understand a visitor’s emotional intent, you can take these experiences to a whole different level. Emotions drive an estimated 80% of human decisions, and the buying journey is packed with micro-moments shaped by those feelings. That’s where our Emotions AI steps in.
Built on over eight years of behavioral analytics, Emotions AI helps you uncover hidden opportunities in the user journey. It shows you not only how to improve a visitor’s experience, but also the cost of inaction. Emotions AI can identify the emotional mindset of every visitor within 30 seconds of activity on your website. This enables you to segment and target them with unmatched precision and speed.
Turn emotions into data-driven sales
While there might be a lot of different emotions running through a visitor’s mind when they come to your website, Emotions AI classifies visitors into one of ten emotional segments:
- Competition: visitors strive to make the best possible choice to stay ahead and be the best.
- Attention: visitors need to feel that everything is being done to satisfy them.
- Safety: visitors need to feel secure and in control of their situation.
- Comfort: visitors need to drift through the buying journey free from disruption and unnecessary effort.
- Community: visitors feel a strong connection with the people they care about and the environment.
- Immediacy: visitors need to be constantly stimulated to take action
- Notoriety: visitors prefer to minimize risk by choosing options already validated by many people.
- Understanding: visitors need comprehensive factual information to make decisions.
- Change: visitors seek new experiences, fresh adventures, and opportunities to break from routines.
- Quality: visitors need qualitative information to make decisions.
Once you know the specific segments you want to target, you can deliver personalized content to them using AB Tasty’s optimization platform and an entire library of widgets.
Real-world examples of EmotionsAI in use
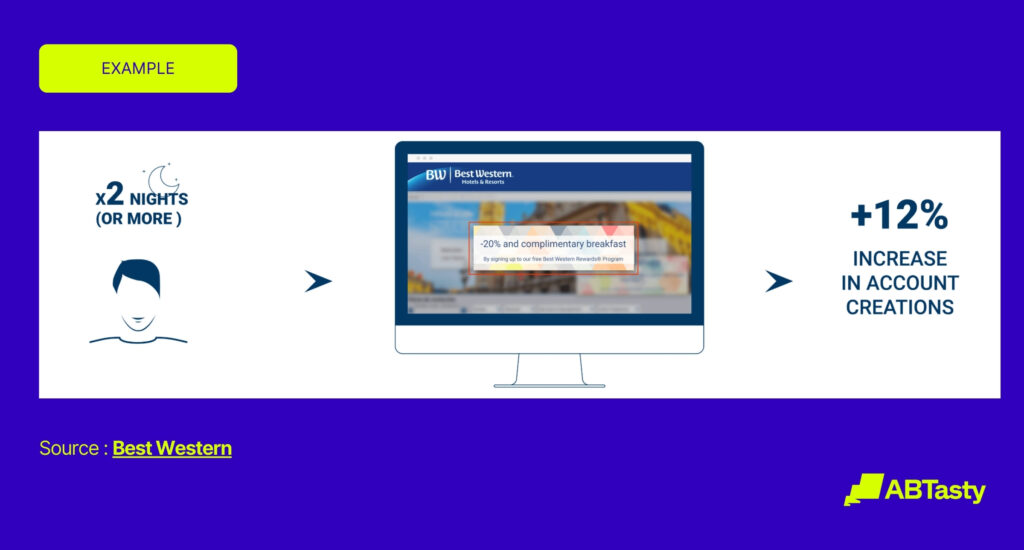
- Clarins launched a personalization campaign targeting the Safety and Comfort segments that displayed a pop-up presenting the benefits of a specific offer. This resulted in an 18% increase in the conversion rate of these segments.
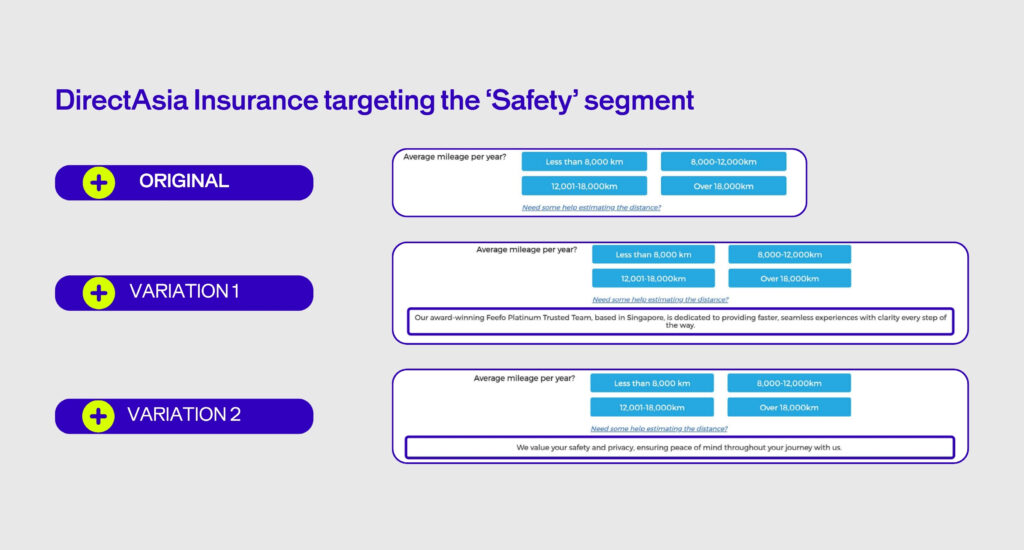
- DirectAsia wanted to increase the conversion rate of the Safety segment. When collecting visitor information, they displayed two variations of a banner to visitors from this segment, reassuring them and prompting them to move to the quote page. Variation 1 increased access to the quote page by 10.9% and variation 2 by 14.8%.
- North American Insurance tested moving FAQs above the quoting area for dental insurance policies for the Immediacy segment. This resulted in an increase in application submissions of more than 140%.
Start your recommendation engines
By combining A/B testing with AI-powered insights about different segments, you can also identify opportunities to optimize personalized recommendation algorithms for these segments. These are designed to point specific visitors to suggested products beyond those they searched for or viewed.
Our AI-powered product recommendation algorithms learn from visitor behavior and transaction data. These can then be deployed across websites, personalized email campaigns, and CMS platforms like Prestashop, Shopify, or Agentforce Commerce to optimize product visibility and sales performance.
Real-world examples of personalized recommendation algorithms
- Jacadi combined Emotions AI with personalized recommendations to target the Understanding segment. Visitors looking at product recommendations saw a widget that noted how much they needed to spend to qualify for free shipping. This increased revenue from these visitors by 10%, the AOV by 1.7%, and the click rate by 3%
- ITM Home Equipment Group (Bricorama, Bricomarché, Bricocash) combined testing different personalized recommendations with real-time information about user behavior. This resulted in 10% more visitors using the recommendations, increased the conversion rate by 21% on the home page, and the average basket by 21% on product pages.
Conclusion
Online consumers are returning to brands that reward them and treat them like individuals. They’re willing to give you their data (and loyalty) if you give them value in return. And AI-powered tools make it easier than ever before to personalize your interactions with visitors and turn their frustration into opportunity.