Article

6min read

How to Avoid Flickering in A/B Tests

Flickering, also called FOOC (Flash of Original Content) is when an original page is briefly displayed before the alternative appears during an A/B test. This happens due to the time it takes for the browser to process modifications. There is no miracle fix to this problem, and those claiming to be quick fixes have limited effectiveness. The good news is that there are several best practices to accelerate the application of your modifications, effectively masking the flickering effect.

Update: to get rid of flickering, you can switch from Client-Side testing to Server-Side testing. The latter doesn’t involve any kind of Javascript to apply modifications on your pages and completely removes the FOOC. Read more about this feature now available within AB Tasty.

What is flickering, exactly?

Although you may have never heard of flickering, you have undoubtedly experienced it without even knowing: a test page loads and, after a few milliseconds, your modifications show up. In the blink of an eye, you’ve seen two versions of your page—the old and the new. The result is poor user experience, not to mention that your users now know your test is just that: a test.

Flickering is caused by the basic client-side operation of A/B testing solutions that apply a JavaScript overlayer during page loading to ensure elements are modified. In most cases, you will not notice it at all, but if your site takes a while to load or relies on intensive external resources, your modifications can take time to be applied, giving way to a previously unnoticeable flickering.

Is there a miracle cure for flickering?

Some providers claim to use innovative techniques that get rid of flickering. Beware, however, that although the techniques they use are commonplace and available to anyone, they present a certain number of technical limits. By analyzing market leaders’ documentation, it is also clear that such “miracle” methods are only implemented as a last resort, when no other options have worked for a lasting period of time. This is because flickering can be different for each site and depends a great deal on initial performance.

So how does the method work? For starters, displayed content is temporarily masked using CSS properties such as visibility: hidden or display: none for the body element. This property masks page content as quickly as possible (since the solution’s tag is located in the page’s <head> element), before redisplaying it again once the modifications have had enough time to be applied. This effectively eliminates the “before/after” flicker effect, but replaces it with a “blank page/after” effect.

The risk of using such a method is that if the page encounters any loading problems or there are implementation problems, users might end up with a blank page for a few seconds, or they could even be stuck with a blank screen with nowhere to click. Another drawback of this solution is that it gives off the impression that site performance is slow. That’s why it is important to ensure that rendering is not delayed for more than a few milliseconds at most—just enough for the modifications to be applied. And of course, for valid results, you’ll need to apply this delayed rendering to a control group to prevent bias in your analysis of behaviors linked to the various rendering speeds.

So there you have it. If your modifications take time to apply, you won’t want a blank page to greet your users. When it comes down to it, you should always adhere to the best practices listed below. Among other things, they aim to ensure modifications are applied at an accelerated rate.

That’s why we here at AB Tasty don’t recommend the above method for most of our users and why we don’t suggest it by default. Nonetheless, it is easy to implement with just a few lines of JavaScript.

How can flickering be limited?

If you don’t want to use the aforementioned method, what are your options? Here are some best practices you can use to reduce flickering and maybe even eliminate it:

  • Optimize your site’s loading time by all means possible: page caching, compression, image optimization, CDNs, parallel query processing with the HTTP/2 protocol, etc.
  • Place the A/B testing solution tag as high as possible in the source code, inside the <head> element and before intensive external resources (e.g. web fonts, JavaScript libraries, etc.) are called.
  • Use the synchronous version of the AB Tasty script, since the asynchronous version increases flickering odds
  • Don’t use a tag manager to call your solution’s tags (e.g. Google Tag Manager). This might not be as convenient, but you’ll have an easier handle on your tag’s firing priority.
  • Do not insert a jQuery library in the tag if your site provider already uses one. Most client-side A/B testing solutions use jQuery. AB Tasty nonetheless makes it so you don’t have to integrate the infamous JavaScript framework if you already use it elsewhere, so you can cross a few kb off your transfer list.
  • Reduce the size of your solution’s script by removing inactive tests. Some solutions include the entirety of your tests in their script, whether they are suspended or in draft mode. AB Tasty includes only active tests by default. If, however, you have a high number of ongoing customizations, it might be appropriate to make them permanently operational and deactivate them on AB Tasty.
  • Pay attention to the nature of modifications. Adding several hundred lines of code to obtain your modification will cause more flickering than a minor change to CSS styles or wording.
  • Rely as much as possible on style sheets. It is usually possible to obtain the desired visual effect using style sheets. For example, you can simply implement a JavaScript instruction that adds a CSS class to an element, letting the class modify its aspect, rather than writing lines of script to manipulate its style.
  • Optimize your modified code. When fiddling around with the WYSIWYG editor to try and implement your changes, you may add several unnecessary JavaScript instructions. Quickly analyze the generated code in the “Edit Code” tab and optimize it by rearranging it or removing needless parts.
  • Ensure that your chosen solution uses one (or many) CDNs so the script containing your modifications can be loaded as quickly as possible, wherever your user is located.
  • For advanced users: Add jQuery selectors to the cache as objects so they don’t need to be reorganized in the DOM multiple times. You can also make modifications in JavaScript rather than in jQuery, particularly when dealing with elements by class or ID.
  • Use redirect tests where possible and if useful after an evaluation of the relation between the modification’s nature and the time required to put the test into place.

If you still see flickering after performing these optimizations, you may want to use the content-masking technique detailed above. If you’re not comfortable doing this alone, contact our support team.

Subscribe to
our Newsletter

bloc Newsletter EN

We will process and store your personal data to send you communications as described in our  Privacy Policy.

Article

6min read

What Does a Data Scientist Think of Google Optimize?

Note: This article was written by Hubert Wassner, Chief Data Scientist at AB Tasty.

Some of you may have noticed Google’s recent release of a free version of Google Optimize and asked yourselves if it will change the market for SaaS A/B testing tools, such as AB Tasty?

Well, history tells us that when Google enters a market, the effects are often disruptive – especially when the tool is free, like with Google Analytics or Google Tag Manager. To be clear, this new offer will be a free version of Google Optimise, with the premium version starting at around $150,000 per year. Also, note that neither the free nor the paid-for version of Google Optimize offer multi-page testing (i.e. test consistency across a funnel for example) and that Google Optimise is not compatible with native applications.

Before going any further, a disclaimer: I’m the chief data scientist at AB Tasty, the leading European solution for A/B testing and personalization and, therefore, in direct competition with Google Optimize. Nevertheless, I’ll do my best to be fair in the following comparison. I’m not going to list and compare all features offered by the two tools. Rather, I’d like to focus on the data side of things – I’m a data scientist after all..!

Let’s dig into it:

To me, Google Optimize’s first and main limitation is that it is based on Google Analytics’ infrastructure and thus doesn’t take the notion of visitor unicity into account. Google looks at sessions. By default, a session duration is fixed to 30 minutes and can be extended to up to 4 hours only. This means that if a visitor visits a website twice with one day between, or visits first in the morning and a second time in the evening, Google Analytics will log 2 different visitors.

This way of counting has two immediate consequences:

  • Conversion rates are much lower than they should be. Perhaps, a little annoying, but we can deal with it
  • Gains are much more difficult to measure. Now, this is a real issue!

Let’s have a closer look…

Conversion rates are much lower

People will normally visit a website several times before converting. For one conversion, Google Analytics (and by extension Google Optimize) records several different sessions. Only the visit during which the visitor converted is recorded as a ‘success’. All the others are considered ‘failures’. Consequently, the success rate is lower as the denominator grows. For Google, conversion rate is based on visits instead of visitors.

You can put up with this limitation if you make decisions based on relative values instead of absolute values. After all, the objective of testing is first and foremost to gauge the difference, whatever the exact value. The Bayesian model for statistics used by Google Optimize (and AB Tasty) does this very well.

Say 100 visitors saw each variation, 10 converted on A and 15 on B.

screenshot1

Based on these hypotheses, variation A is 14% more likely to be best. The rate reaches 86% for variation B.

Now say that the above conversions occur after 2 visits on average. It doubles the number of trials and simulates a conversion rate by session instead of visitor.

screenshot2

Results are very similar as there is just a 1% difference between the two experiments. So, if the goal is to see if there is a significant difference between two variations (but not the size of the difference), then taking the session as reference value works just fine.

NB: This conclusion stays true as long as the number of visits per unique visitor is stable across all variations – which is not certain.

It’s impossible to measure confidence intervals for gain with the session approach

Confidence intervals for gain are crucial when interpreting results and in making sound decisions. They predict worst and best case scenarios that could occur once changes are no longer in a test environment.

Here is another tool, also based on Bayesian statistics, that illustrates potential gain distribution: https://making.lyst.com/bayesian-calculator/

See results below for the same sample as previously:

  • 100 visits, 10 successes on variation A
  • 100 visits, 15 successes on variation B

graph1

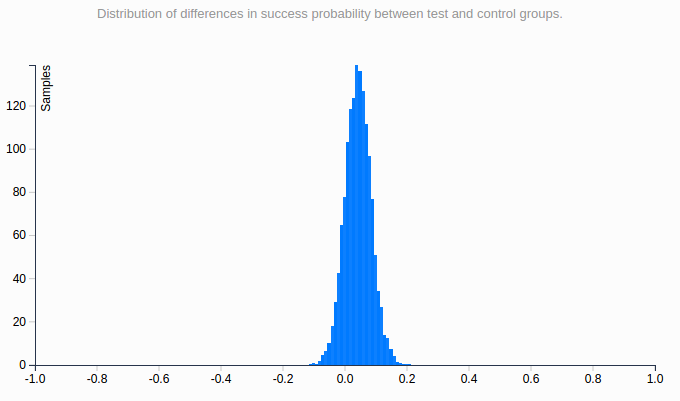
This curve shows the probability distribution of the real value of the gain linked to variation B.

The 95% confidence interval is [ – 0.05; +0.15 ], which means that with a 95% confidence rate, the actual value of the gain is above -0.05 and below +0.15.

The interval being globally positive, we can draw the same conclusion as previously: B is probably the winning variation but there are doubts.

Now let’s say that there are 2 visits before conversion on average. The number of trials is doubled, like previously – this is the kind of data Google Optimize would have.

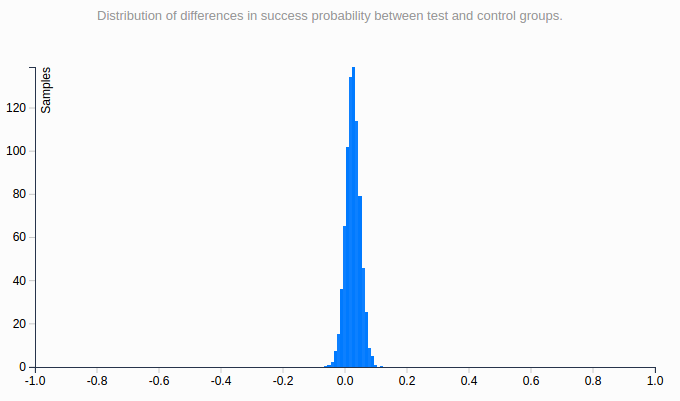
Here is the curve showing the probability distribution of the real value of the gain.

graph2

This distribution is much narrower than the other, and the confidence interval is much smaller: [ – 0.025; 0.08 ]. It gives the impression that it’s more precise – but as the sample is the exact same, it’s not! The bigger the number of sessions before conversion, the more striking this effect would be.

The root of the problem is that the number of sessions for a unique visitor is unknown and varies between segments, business models and industries. Calculating a confidence interval is, therefore, impossible – although it’s essential we draw accurate conclusions.

To conclude, the session-based approach promises to identify which variation is best but doesn’t help estimate gain. To me, this is highly limiting.

Then, why has Google made this (bad) choice?

To track a visitor over multiple sessions, Google would have to store the information server-side, and it would represent a huge amount of data. Given that Google Analytics is free, it is very likely that they try to save as much storage space as they can. Google Optimize is based on Google Analytics, so it’s no surprise they made the same decision for Google Optimize. We shouldn’t expect this to change anytime soon.

I’d say Google Optimize is very likely to gain substantial market share with small websites. Just as they chose Google Analytics, they will go for Google Optimize and gratuity. More mature websites tend to see conversion rate optimization as a game changer and generally prefer technology that can provide more accuracy – results based on unique visitors, real customers.

Overall, the introduction of Google Optimize represents a great opportunity for the market as a whole. As the tool is free, it will likely speed up awareness and optimization skills across the digital industry. Perhaps even the general understanding of statistics will increase! As marketers put tests in place and realize results don’t always follow outside the testing environment, they may very well look for more advanced and precise solutions.