In a highly competitive digital marketplace, optimizing your website for a unique and seamless digital customer journey is no longer just a competitive advantage — it’s a necessity.
It’s important to remember that the digital customer journey does not begin and end with a purchase – it’s a web of all customer interactions and touchpoints with your brand.
AB Tasty has mapped out seven customer phases that we consider crucial in the journey. To craft unique experiences, you’ll need to differentiate these seven phases customers pass through and understand how to animate their digital journey.
Once you have a better understanding of these phases, you will be better equipped to set your business goals and properly optimize your website for growth and impact.
Click to view the full-sized infographic in a new tab

How exactly can you optimize each phase of the digital customer journey? Let’s dive right in and take a look at some examples.
Phase 1: Awareness
When visitors land on your website for the first time, a great first impression is crucial. Your page needs to be both visually appealing and intuitive. A dynamic above the fold design is a great place to start.
In this first phase, it’s important to let your best ideas shine to capture and keep your visitors’ attention. You can accomplish this by creating personalized welcome messages for first-time visitors, displaying your value proposition and organizing high-impact elements for better visibility.
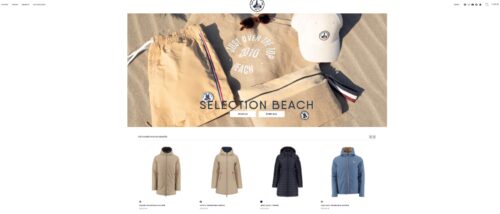
Let’s take a look at Just Over The Top’s experiment to modify the layout of their homepage. They used AB Tasty’s experience optimization platform to test if their users responded better seeing a layout with product categories rather than individual products.
Original:
Variation: 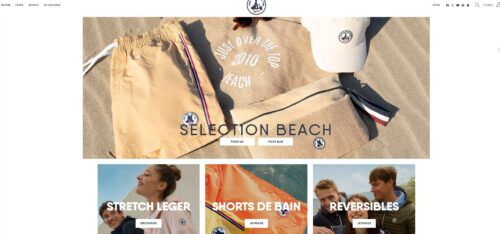
After creating a test variation to run against the original layout, they saw a 17.5% click increase on the three blocks below the hero image. This brought many more users into the second phase of their customer journey.
Phase 2: Discovery
When consumers reach the second phase, they’ve already discovered your brand and they’re getting curious.
To accommodate visitors during this phase, your website should be optimized for an excellent browsing experience. Whether this means making your search bar more visible, creating dynamic filters while searching, or using a virtual assistant to get to know your visitors’ interests with a series of questions, an easy browsing experience with intelligent search is key.
In this example, Claudie Pierlot focused on optimizing the customer browsing experience by testing the search bar visibility. In their variation, the small search icon was made more visible by adding the word “recherche” (or search in English) in the top right-hand corner.
Original:

Variation:

This clear above the fold design made it easier for visitors to identify the search bar to begin their browsing experience. With this simple A/B test, they saw a 47% increase in search bar clicks and a 7% increase in conversion rates coming directly from the search bar.
In another example, Villeroy & Boch, a ceramic manufacturing company, wanted to leverage intelligent search on their website. With the help of AB Tasty, they implemented an AI search algorithm to navigate online shoppers.
With our solution, they designed a new and intuitive navigation complete with filters and a comprehensive autosuggestion feature.
By changing their search functions, Villeroy & Boch saw a 33% increase in search results clicks and a 20% increase in sales through the search function.
Phase 3: Consideration
Now is the time when your visitors are considering your brand and which products they are interested in. Showcasing your product pages in their best light during the consideration phase might be exactly what your visitor needs to continue moving down the funnel.
Let’s look at how Hanna Anderson optimized their product pages during this phase.
The clothing retail company wanted to experiment with the images on their product listing pages. Previously, their toddler line had only images of clothing sizes for an older child. They were convinced there was room for improvement and decided to run a test by changing their images to include toddler sizes.
Original:
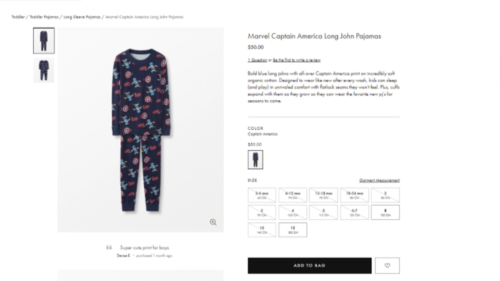
Variation:
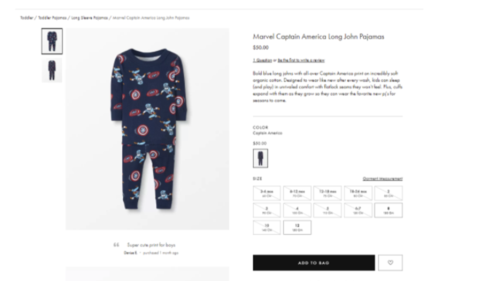
After implementing age-appropriate clothing images, the results were clear. During this test, the clicks on PLPs increased by almost 8% and the purchase rate on those items skyrocketed by 22%.
Phase 4: Intent
During the intent phase, your visitors are on the verge of becoming customers but need to be convinced to make a purchase.
Social proof, urgency messaging, and bundling algorithms are a few ideas to lightly nudge visitors to add to cart or add more to cart.
Let’s take a look at the impact that urgency messaging can have: IZIPIZI, an eyewear retailer, decided to add a special message flag next to their product description to show viewers how many people have purchased this product. The idea of this message is to show viewers that this product is popular and to encourage them to take action.
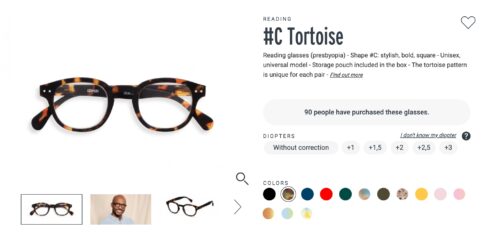
With this simple sentence of social proof to validate a product’s desirability, they saw a 36% increase in add-to-basket rate.
In another scenario, you can see that adding a progress bar is a simple way to upsell. With a progress par, you are showing your customer how close they are to earning free shipping, which entices them to add more to their cart.
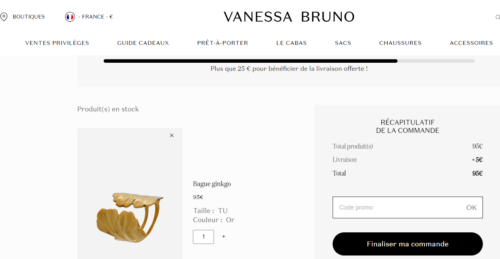
Vanessa Bruno experimented with this additive with the help of AB Tasty and saw a 3.15% increase in transactions and a €6 AOV uplift.
Phase 5: Purchase
Purchase frustration is real. If customers experience friction during checkout, you risk losing money.
Friction refers to any issues the visitors may encounter such as unclear messaging during the payment (did the payment actually go through?), confusing or expensive shipping options, discounts not working, double authentication check-in delays, difficult sign-in, and more.
Optimizing your checkout sequence for your audience with rollouts and KPI-triggered rollbacks can help you find a seamless fit for your website.
Let’s look at an example for this phase: Galeries Lafayette, the French luxury department store, saw an opportunity to optimize their checkout by displaying default payment methods that do not require double authentication.
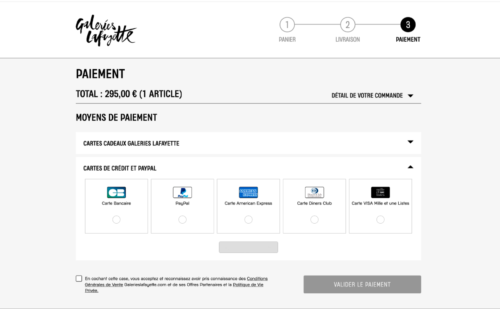
During this test, they saw a €113,661 increase in profit, a €5 uplift in average order value, and a 38% increase in the conversion rate by adding the CB (bank card) option for a quicker checkout.
Phase 6: Experience
Optimizing the buyer experience doesn’t end after the purchase. Now is the time to grow your customer base and stop churn in its tracks. So, how do you keep your customers interested? By maintaining the same level of quality in your messages and personalization.
Let’s look at how Envie de Fraise, a French boutique, leveraged their user information to transform a normal post-purchase encounter into a personalized experience.
One of their customers had just purchased a maternity dress and had been browsing multiple maternity dresses prior to their purchase. By knowing this information, they experimented with using the “you will love these products” algorithm to gently nudge their customer to continue shopping.
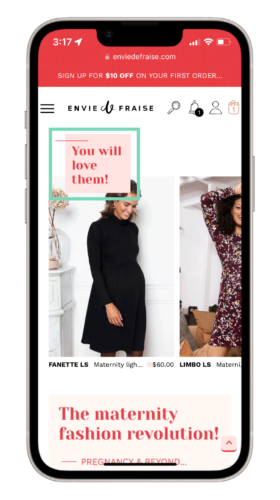
With a customized recommendation like this, Envie de Fraise saw a €127K increase in their potential profit. As your customer spends more time with your brand, you will learn more about their habits and interests. The more time they spend with you, the more personalized you can make their experience.
Phase 7: Loyalty
In the final step of your customer’s journey, they move into the loyalty phase. To turn customers into champions of your brand, it’s important to remind them that you value their loyalty.
This can be done by sending emails with individual offers, social proof, product suggestions, or incentives for joining a loyalty program to earn rewards or complete product reviews.
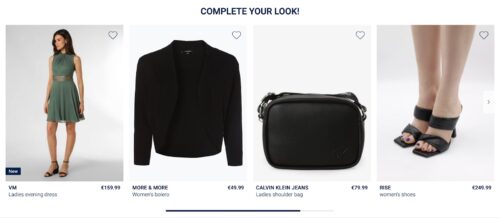
Another example of this is sending a personalized email displaying items that are frequently bought together that align with their purchase. This will remind the customer about your brand and give them recommendations for future purchases.
Why Optimizing the Digital Customer Journey is Essential to Boost Conversions
The fierce competition in the e-commerce marketplace is undeniable. In order to attract and retain customers, you have to focus on crafting personalized user experiences to turn passive visitors into active buyers.
Understanding their needs in each phase and optimizing your digital space is your best solution to nudge visitors down the purchasing funnel.
By personalizing the experience of your customers during each phase of the digital customer journey, you can ensure an optimal shopping experience, boost purchases, increase customer satisfaction, and see more repeat customers.
AB Tasty is the best-in-class experience optimization platform that empowers you to create a richer digital experience – fast. From experimentation to personalization, this solution can help you activate and engage your audience to boost your conversions.

Using personalization to enhance your customer journey
With the vast array of products and brands to choose from, customer loyalty has become more important than ever. By focusing on personalizing the digital customer journey, you can reduce the chances of your customer abandoning their purchase or opting for another brand.
An individualized customer journey is beneficial for the following reasons:
- Option overload: As online brands fight for the attention of consumers, it’s important to set your brand apart from the rest, with a customer journey that is tailored to their needs.
- Analysis paralysis: With a plethora of information now readily available to customers who are researching and comparing potential purchases, your digital customer journey can help to deliver the information they need with ease and offer them the best shopping experience, thereby tipping the scale in your favor.
- Lack of loyalty: The ease with which a customer can change service providers has increased the pressure and importance of meeting their needs during the entirety of the digital customer journey. Every interaction matters.
Offering a personalized experience elevates the customer journey and helps to ensure customer satisfaction. By leveraging the power of personalization, you can adapt the individual phases of the customer journey to each customer’s needs for an optimal e-commerce experience.
Personalization is the key to customer satisfaction
There is no way to deny the intense competition in the e-commerce space. Attracting and retaining customers is more difficult now than it has ever been. To advance ahead of the competition, you must understand customer needs and personalize each user journey with the help of a customer journey model.
By personalizing each experience your customers have with your brand, you can be sure to give your customers an optimal shopping experience, guarantee customer satisfaction, and encourage customer loyalty.