Main Takeaways
› Wingify is the Digital Experience Optimization (DXO) suite that now houses both AB Tasty and VWO.
› It unites personalization, experimentation, feature management, customer insight, and AI under a single roof.
› Current AB Tasty and VWO products keep running as-is while they’re gradually folded into one Wingify experience.
› Wandz is the AI engine woven through every part of the suite.
Most digital teams have data but lack clarity. The gap between collecting information and confidently acting on it is quietly costing far more than most organizations realize.
Experiments run, but nobody can tie the results back to revenue. Personalization tools exist, but targeting the right audience with any confidence is a struggle. Features ship, but there’s no dependable way to tell whether they actually helped. AI tools are in place too, yet every session starts with re-explaining context from scratch.
None of this is a talent problem. It’s a coordination problem, the predictable outcome of stitching together an optimization strategy from disconnected point solutions that don’t share data, audiences, or even an agreed definition of success.
Wingify was built to close that gap by bringing AB Tasty and VWO, two of the most established and widely used suites in personalization, experimentation, and digital experience optimization, into a single connected platform. Wingify gives organizations something individual tools never could: one shared, complete view of the customer that every team can act on from the same place, with no translation layer in between. Each feature feeds the next automatically; insight turns into a hypothesis, a hypothesis turns into an experiment, and an experiment turns into a better experience, without anyone manually stitching the stages together.
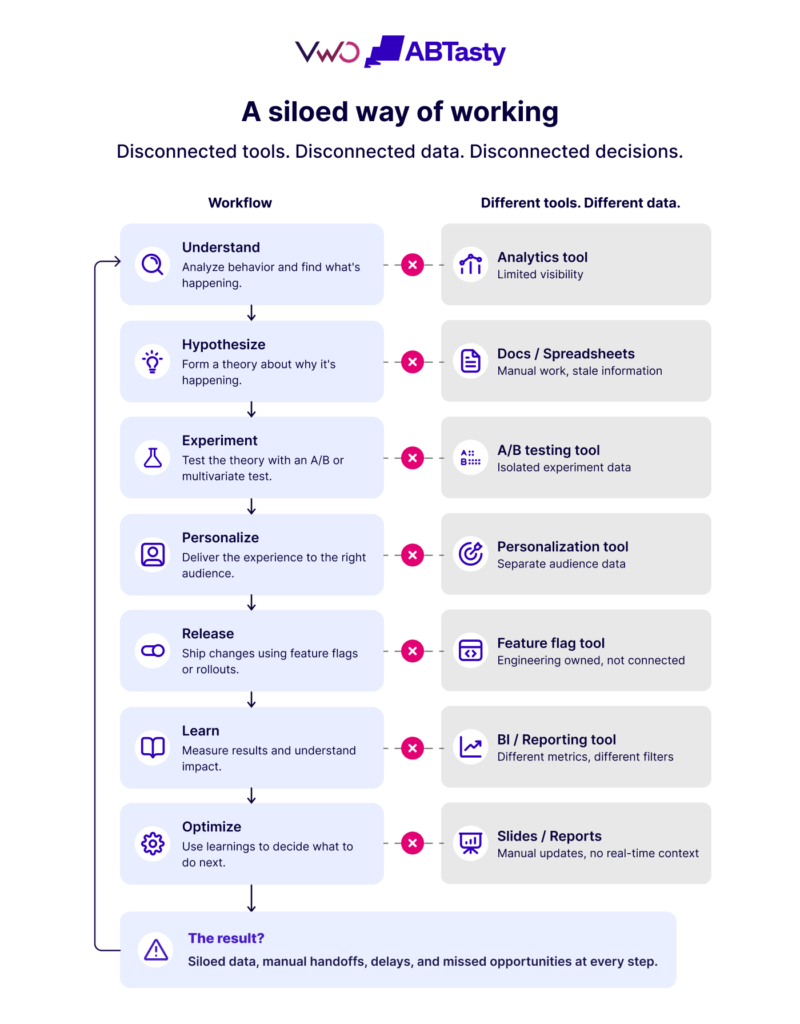
What disconnected tools actually cost you
Before getting into what Wingify makes possible, it’s worth naming the problem clearly, because it tends to hide behind adoption numbers and productivity dashboards rather than show up as a line item on a report.
Data that doesn’t travel slows every decision
- An insight from a heatmap has to be manually translated into a hypothesis inside a separate experimentation tool.
- A winning experiment has to be manually rebuilt as a personalized experience inside a different personalization engine.
- A personalization audience has to be recreated from scratch in a feature flag tool before a rollout can even target the right people.
Every one of those handoffs costs time, invites interpretation errors, and often means that by the time a promising idea becomes a live experience, the moment it was built for has already passed.
Audiences drift apart and metrics stop agreeing
When the same audience, say, “returning customers who abandoned checkout”, is defined separately across four different tools, it quietly stops meaning the same thing in each one.
Experimentation reports one number, personalization targets a slightly different group, analytics shows a third figure, and nobody can explain the gap. The net effect is less time spent optimizing and more time spent reconciling spreadsheets.
AI is only as useful as the context it has
General-purpose AI tools are genuinely helpful for brainstorming and first drafts. But they have no visibility into your live experiments, your audience segments, your rollout history, or your campaign metrics.
Getting a useful answer means exporting, copying, and pasting enough context for the response to actually apply, then manually carrying that answer back into the suite to act on it. That round trip is exactly where the value leaks out.
Governance turns into a patchwork
For organizations running optimization across multiple teams, brands, or regions, every tool without a shared permission model becomes one more security surface to configure and maintain on its own.
Audit trails fragment, compliance questions get harder to answer definitively, and the combined overhead of governing five separate tools becomes a real cost that almost never shows up in any single tool’s ROI math.
Why connection, not just capability, drives the outcome
A connected suite outperforms a stack of disconnected best-of-breed tools for a structural reason, not a marketing one.
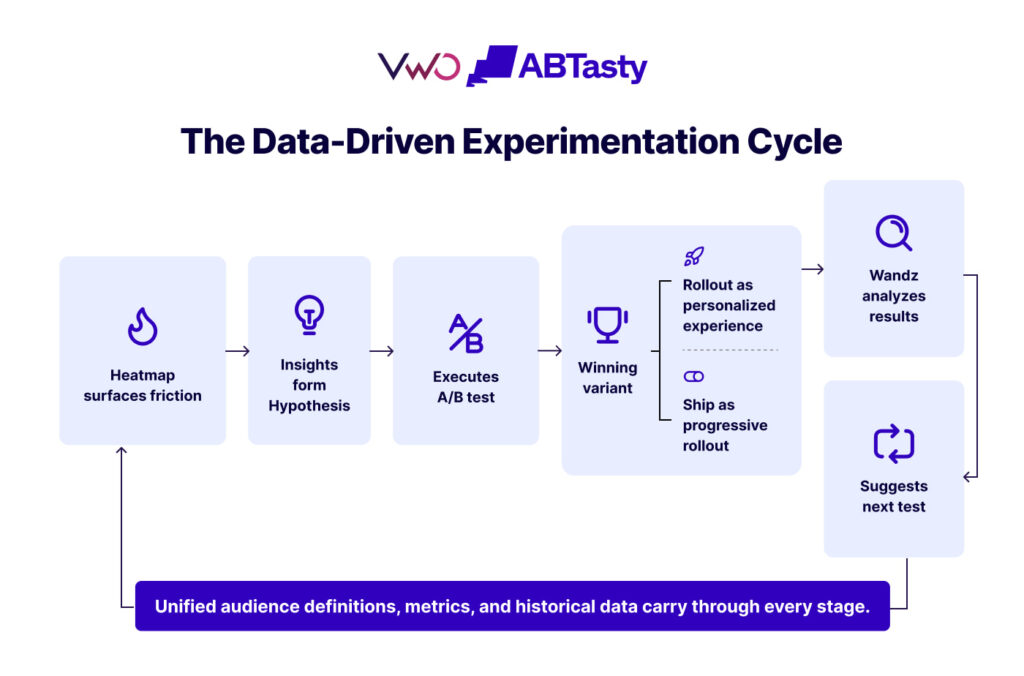
When experimentation, personalization, feature delivery, customer insight, commerce, feedback, and analytics all draw on the same data layer, the output of one stage automatically becomes the input for the next. A heatmap that reveals checkout friction feeds directly into a hypothesis. The hypothesis becomes an experiment.
The experiment’s winning variant becomes a personalized experience for the exact segment where the friction was worst. That personalization shapes a feature decision. The feature is rolled out progressively to the segment that responded best. Everything that happens along the way updates what the team understands about customer behavior, which sets up the next test.
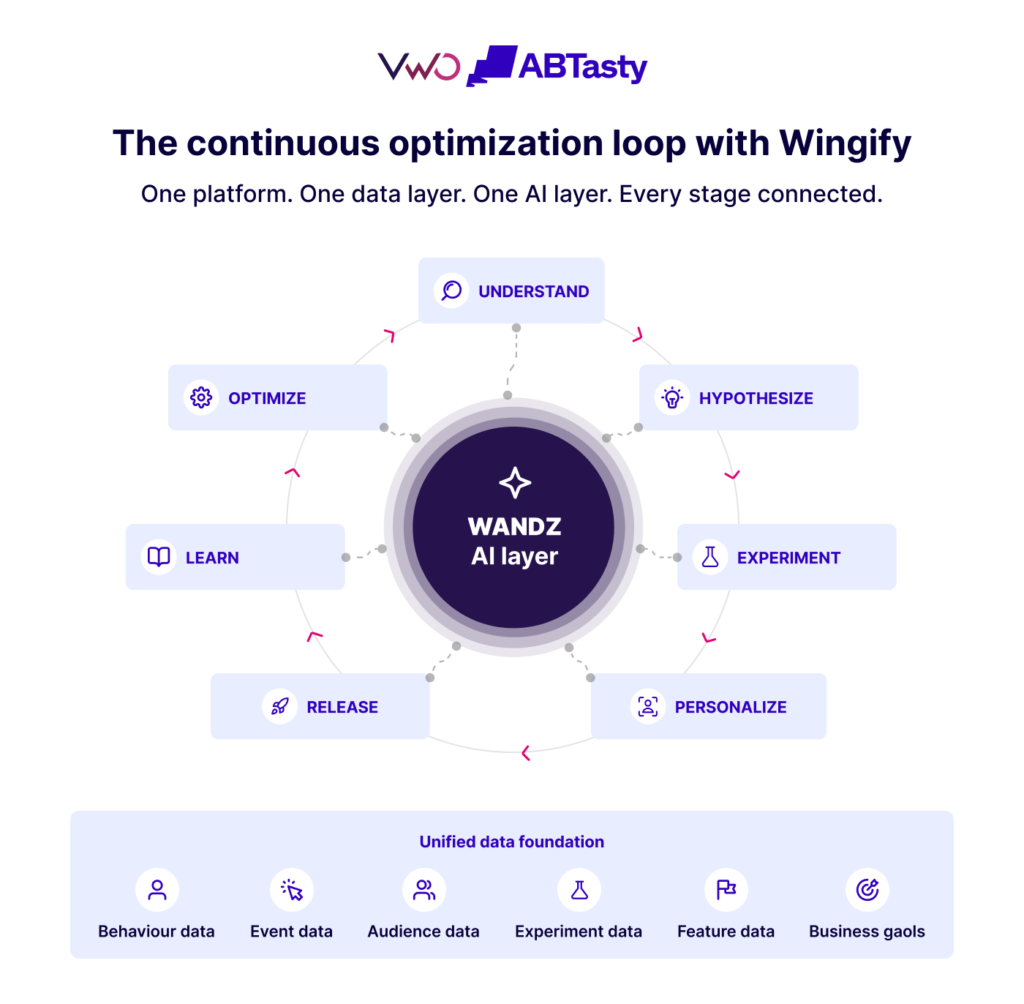
That cycle… understand, hypothesize, experiment, personalize, release, learn, optimize, is how compounding improvement actually happens. It doesn’t take heroic effort, just tooling that doesn’t break the chain at every single handoff.
Wingify keeps that chain unbroken, combining AB Tasty’s depth in personalization, segmentation, and AI-driven targeting with VWO’s decade-plus track record in experimentation and behavioral insight.
Why an embedded AI layer changes what’s possible
An AI layer sitting outside your suite adds a step to everything you do. One built directly into it removes steps instead.
Wandz is Wingify’s embedded AI layer, intelligence built straight into experimentation, personalization, feature management, and analytics workflows. It builds on what AB Tasty offered through Evi and what VWO offered through Copilot, merging both into one AI layer with shared access to context across the entire suite.
Wandz runs inside every feature across the platform as the intelligence layer that keeps the connected loop moving, generating hypotheses, reviewing configurations, building audiences, interpreting results, and surfacing the next opportunity, all from within the workflow where the work already happens. The loop speeds up because Wandz removes the pauses between stages.
That translates into concrete business value:
- Faster hypothesis generation: instead of a growth team spending a week pulling data to justify a test idea, Wandz can surface experiment hypotheses grounded in what’s already inside the suite, behavioral patterns, segment performance, and historical test results, in minutes.
- Fewer launch mistakes: before an experiment or rollout goes live, Wandz reviews the configuration, metrics, audience targeting, traffic split, and flags likely errors. A misconfigured test that quietly runs for two weeks before anyone notices is an expensive way to learn something a pre-launch check could have caught.
- Faster result interpretation: instead of waiting on an analyst to interpret a finished test, teams can ask Wandz plain-language questions, “how did this campaign perform on mobile vs. desktop for first-time visitors”, and get an answer straight from their actual data, immediately.
- Faster campaign execution: the AI Editor lets teams build or adjust campaigns using natural-language instructions, with every change staying visible and reversible before it ships, faster time-to-live without giving up oversight.
Each of these shortens the distance between insight and action, and across every experiment, rollout, and personalization campaign a team runs in a year, that adds up to a meaningful difference in how much optimization actually gets done.
What Wingify delivers
Wingify’s value comes from bringing two suites together, AB Tasty’s personalization and AI-driven experience capabilities and VWO’s experimentation depth, into one data layer, one workflow, and one AI system spanning all of it.
For teams, the result is a tighter loop between understanding customers and improving their experience, running continuously instead of in occasional bursts whenever someone finds time to manually reconcile five dashboards.
That’s the business case for a unified Digital Experience Optimization suite. It’s exactly what Wingify delivers.
FAQs
Still have questions about Wingify? Here are the answers you need.
What is Wingify?
Wingify is the combined Digital Experience Optimization suite formed by AB Tasty and VWO following their 2026 merger.
What’s included in Wingify?
Wingify covers web, mobile, and server-side experimentation; personalization and product recommendations; feature management (progressive rollouts and kill switches included); behavioral insight tools like heatmaps, session recordings, and surveys; and Wandz, the suite’s shared AI layer.
Does Wingify support feature flags?
Yes. Feature management, including progressive rollouts and kill switches, is built into the suite, giving engineering and product teams a way to roll features out gradually and shut them off instantly if something goes wrong.
Does Wingify handle personalization?
Yes, it’s one of the suite’s core pillars, drawing heavily on AB Tasty’s strength in adaptive, behavior-based targeting, including Emotions AI for reading user emotional state and Adaptive CX for adjusting the experience as a visitor spends more time on-site.

About the Author
Stephanie Safdie
Stephanie Safdie holds a bachelor’s degree in English Language and Literature from the University of Maryland, specializing in multimedia studies. She has worked as a social media video creator, freelance copywriter, SEO copywriter at Greenly climate tech, and runs a travel blog Destination Dreamer Diaries.