In A/B tests where you can see the data coming in a continuous stream, it’s tempting to stop the experiment before the planned end. It’s so tempting that in fact a lot of practitioners don’t even really know why one has to define a testing period beforehand.
Some platforms have even changed their statistical tools to take this into account and have switched to sequential testing which is designed to handle tests this way.
Sequential testing enables you to evaluate data as it’s collected to determine if an early decision can be made, helping you cut down on A/B test duration as you can ‘peak’ at set points.
But, is this an efficient and beneficial type of testing? Spoiler: yes and no, depending on the way you use it.
Why do we need to wait for the predetermined end of the experiment?
Planning and respecting the data collection period of an experiment is crucial. Historical techniques use “fixed horizon testing” that establishes these guidelines for all to follow. If you do not respect this condition, then you don’t have the guarantee provided by the statistical framework. This statistical framework guarantees that you only have a 5% error risk when using the common decision thresholds.
Sequential testing promises that when using the proper statistical formulas, you can stop an experiment as soon as the decision threshold is crossed and still have the 5% error risk guarantee. The test user here is the sequential Z-test, which is based on the classical Z-test with an added correction to take the sequential usage into account.
In the following sections, we will look at two objections that are often raised when it comes to sequential testing that may put it at odds with CRO practices.
Sequential testing objection 1: “Each day has to be sampled the same”
The first objection is that one should sample each day of the week the same way. This is basically to have a sampling that represents reality. This is the case in a classic A/B test. However, this rule may be broken if you use sequential testing since you can stop the test mid-week but this is not always applicable. Since in reality there are seven different days, your sampling unit should be by week and not by day to account for behavioral differences over the course of a week.
As experiments typically last 2-3 weeks, then the promise of sequential testing saving days isn’t necessarily correct unless a winner appears very early in the process. However, it’s more likely that the statistical test yielded significance during the last week. In this case, it’s best to complete the data collection until each day is sampled evenly so that the full period is covered.
Let’s consider the following simulation setting:
- One reference with a 5% conversion rate
- One variation with a 5.5% conversion rate (a 10% relative improvement)
- 5,000 visitors as daily traffic
- 14 days (2 weeks) of data collection
- We ran thousands of such experiments to get histograms for different decision index
In the following histogram, the horizontal axis is the day when the sequential testing crosses the significance threshold. The vertical axis is the ratio of experiments which stopped on this day.

In this setting, day 10 is the most likely day for the sequential testing to reach significance. This means that you will need to wait until the planned end of the test to respect the “same sampling each day” rule. And it’s very unlikely that you will get a significant positive result in one week. Thus, in practice, determining the winner sooner with sequential testing doesn’t apply in CRO.
Sequential testing objection 2: “Yes, (effect) size does matter”
In sequential testing, this is often a less obvious problem and may need some further clarification to be properly understood.
In CRO, we consider mainly two statistical indices for decision-making:
- The pValue or any other confidence index, which is linked to the fact that there exists (or not) a difference between the original and the variation. This index is used to validate or invalidate the test hypothesis. But a validated hypothesis is not necessarily a good business decision, so we need more information.
- The Confidence Interval (CI) around the estimated gain, which indicates the size of the effect. It’s also central to business decisions. For instance, a variation can be a clear winner but with a very little margin that may not cover the implementation or operating costs such as coupon offerings that need to cover the coupon cost.
Confidence intervals can be seen as a best and worst case scenario. For example a CI = [1% ; 12%] means “in the worst case you will only get 1% relative uplift,” which means going from 5% conversion rate to 5.05%.
If the variation has an implementation or operating cost, the results may not be satisfying. In that case, the solution would be to collect more data in order to have a narrower confidence interval, until you get a more satisfying lower bound, or you may find that the upper bound goes very low showing that the effect, even if it exists, is too low to be worth it from a business perspective.
Using the same scenario as above, the lower bound of the confidence interval can be plotted as follows:
- Horizontal axis – the percentage value of the lower bound
- Vertical axis – the proportion of experiments with this lower bound value
- Blue curve – sequential testing CI
- Orange curve – classical fixed horizon testing
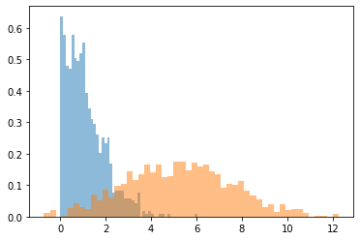
We can see that sequential testing has a very low confidence interval for the lower bound. Most of the time, this is lower than 2% (in relative gain, which is very small). This means that you will get very poor information for business decisions.
Meanwhile, a classic fixed horizon testing (orange curve) will produce a lower bound >5% in half of the cases, which is a more comfortable margin. Therefore, you can continue the data collection until you have a useful result, which means waiting for more data. Even if by chance the sequential testing found a variant reaching significance in one week, you will still need to collect data for another week to do two things: have a useful estimation of the uplift and sample each day equally.
This makes sense in light of the purpose of sequential testing: quickly detect when a variation produces results that differ from the original, whether for the worse or better.
If done as soon as possible, it makes sense to stop the experiment as soon as the gain confidence interval lays mostly either on the positive or negative side. Then, for the positive side, the CI lower bound is close to 0, which doesn’t allow for efficient business decisions. It’s worth noting that for other applications other than CRO, this behaviour may be optimal and that’s why sequential testing exists.
When does sequential testing in CRO make sense?
As we’ve seen, sequential testing should not be used to quickly determine a winning variation. However, it can be useful in CRO in order to detect losing variations as soon as possible (and prevent loss of conversions, revenue, …).
You may be wondering why it’s acceptable to stop an experiment midway through when your variation is losing rather than when you have a winning variation. This is because of the following reasons:
- The most obvious one: To put it simply, you’re losing conversions. This is acceptable in the context of searching for a better variation than the original. However, this makes little sense in cases where there is a notable loss, indicating that the variation has no more chances to be a winner. An alerting system set at a low sensitivity level will help detect such impactful losses.
- The less obvious one: Sometimes when an experiment is only slightly “losing” for a good period of time, practitioners tend to let this kind of test run in the hopes that it may turn into a “winner”. Thus, they accept this loss because the variation is only “slightly” losing but they often forget that another valuable component is lost in the process: traffic, which is essential for experimentation. For an optimal CRO strategy, one needs to take these factors into account and consider stopping this kind of useless experiment, doomed to have small effects. In such a scenario, an automated alert system will suggest stopping this kind of test and allocate this traffic to other experiments.
Therefore, sequential testing is, in fact, a valuable tool to alert and stop a losing variation.
However, one more objection could still be raised: by stopping the experiment midway, you are breaking the “sample each day the same” rule.
In this particular case, stopping a losing variation has very little chance to be a bad move. In order for the detected variation to become a winner, it first needs to gain enough conversions tobe comparable to the original version. Then it would need another set of conversions to be a “mild” winner and that still wouldn’t be enough to be considered a business winner (and cover the implementation or exploitation costs of that winner). To be considered a winner for your business, the competing variation will need another high amount of conversions with a sufficient margin. This margin needs to be high enough to cover the cost of implementation, localization, and/or operating costs.
All the aforementioned events should happen in less than a week (ie. the number of days needed to complete the current week). This is very unlikely, which means it’s safe and smart to stop such experiments.
Conclusion
It may be surprising or disappointing to see that there’s no business value in stopping winning experiments early as others may believe. This is because a statistical winner is not a business winner. Stopping a test early is taking away the data you need to reach a significant effect size that would increase your chances of getting a winning variation.
With that in mind, the best way to use this type of testing is as an alert to help spot and stop tests that are either harmful to the business or not worth continuing.
About the Author:
Hubert Wassner has been working as a Senior Data Scientist at AB Tasty since 2014. With a passion for science, data and technology, his work has focused primarily on all the statistical aspects of the platform, which includes building Bayesian statistical tests adapted to the practice of A/B testing for the web and setting up a data science team for machine learning needs.
After getting his degree in Computer Science with a speciality in Signal Processing at ESIEA, Hubert started his career as a research engineer doing research work in the field of voice recognition in Switzerland followed by research in the field of genomic data mining at a biotech company. He was also a professor at ESIEA engineer school where he taught courses in algorithmics and machine learning.