We’re in an era of banner blindness.
People increasingly ignore irrelevant ads while being more receptive to tailored online experiences that speak to their needs and wants. To keep a competitive edge, marketers need to focus on crafting personalized content and user experiences to increase their ad engagement and boost revenue.
Welcome to the world of behavioral targeting.
Let’s talk about how behavioral targeting is done, what data it involves, six examples of brands that are killing it with behavioral targeting, and some best practices to follow.
What is behavioral targeting?
Behavioral targeting is a marketing technique that segments audiences based on behaviors rather than just demographic parameters.
Simply put, website owners can use the data collected from user behavior to create profiles and hyper-target future advertising for specific groups of customers. Behavioral targeting allows brands and marketers to engage customers and rise above more traditional strategies.
Modern marketers use behavioral targeting to achieve greater engagement in an era where more and more online shoppers have developed strong avoidance habits toward most ad formats.
What data do you need for behavioral targeting in marketing and advertisement?
Behavioral targeting campaigns are data-driven. Behavioral data is often collected with:
- Your company’s web analytics tools
- Collected cookies
- Customers’ browsing history
- Collected IP addresses
The most common metrics collected for behavioral targeting are:
- Geographic location
- Type of devices used
- Visit data
- Transactional data
- Purchase history
- Browsing history
Basically, marketers use any type of data—provided that it delivers actionable insights—that can be used to increase engagement and conversions during a campaign.
The benefits of behavioral marketing and behavioral advertising
- Relevancy: By analyzing a customer’s past behavior, you can create more relevant ads to give users a better (and less spammy) experience.
- Efficiency: Targeting users who’ve shown an interest in your products/services ensures you spend your budget more efficiently.
- Improved ROI: Increasing the relevancy and efficiency of ads will, in turn, lead to a better ROI.
Behavioral targeting examples
Retargeting ads examples
You can use retargeting advertisements to show advertisements to your website users that are tailored to their actions on your website. Both Facebook and Google offer retargeting adverts. Retargeting adverts are an excellent way to encourage a website visitor to return to your website by showing the relevant ad based on their past behavior. Here’s how a couple of large brands use retargeting adverts to increase sales:
Neutrogena, a well-known beauty brand, used customers’ past shopping cart behavior to increase sales. Knowing that 75% of its customers were purchasing products from one segment of its range, Neutrogena decided to take action to increase the number of products purchased by existing customers.
The company used historic shopping cart data to create product pairings: products that went well together and also reflected historic customer buying patterns — think mascara and eye makeup remover, for example.

Armed with customers’ purchase behaviors, Neutrogena created banner advertisements and videos displaying product pairing, product information, and – last but not least – coupons to encourage sales.
Finally, these product pairing adverts were displayed to customers based on their past purchasing patterns. The results speak for themselves. Neutrogena got a £5.84 return on behavioral advertising spend (ROAS) and exceeded its own benchmark by 289%.
This luxury male watch brand used its users’ website behaviors and Facebook retargeting advertisements to increase sales and brand awareness.
The campaign segmented the company’s existing website users into three groups:
- People who had added an item to their baskets
- People who had viewed specific items
- People who had visited the website
As well as designing specific adverts for each group, Aurum Brothers tested different ad settings such as bid options and ad objectives.

Facebook retargeting based on customer behavior was highly successful for the company. They reported 100% increases month on month and an increase of 50% in revenue.
Behavioral Email Marketing
One example of behavioral marketing is behaviorally targeted email campaigns. Email campaigns can be triggered by actions taken on a website, such as subscribing to a newsletter, adding an item to the cart, or viewing the sales page.
Here’s an example of behavioral email marketing in real life:
A clever way to use behavioral targeting is to segment your customers based on their stage in the buying cycle, and then retarget them with email campaigns specific to their shopping journey.
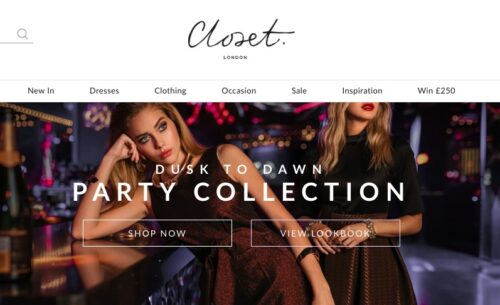
And that’s exactly what clothing brand Closet London did.
The company split its customer base into four groups based on their past purchases and implemented email marketing workflows specific to each group. The groups were:
- one-time purchases
- repeat purchases
- loyal customers
- dormant customers
If a customer is categorized as a dormant customer, they will be sent an email about the latest collection. Then, if no conversion takes place within two weeks, the brand encourages the user to re-engage by emailing them a discount offer.
But Closet London doesn’t stop there. The clever clothing brand also sends a variety of other email campaigns tailored to both new users (e.g. a welcome email campaign) and past customers (e.g. an email workflow based on the items they’ve purchased in the past).
If you’re concerned that too many emails may annoy your customers, don’t be.
By segmenting customers based on their actions on your website, you ensure that you’re sending well-timed, relevant, and useful emails to the correct segmentation of your customers. Do it successfully and you might get results like Closet London — an increase in revenue of 2900%.
Location-Based Advertising
By using location-based advertising (LBA) you can adapt your marketing message based on where your target consumers are geographically.
It even allows you to tailor your message based on the proximity to stores, the weather, transport routes, and so on. This means that you can create messages that make sense, given the location or the weather they are experiencing.
Here are some examples of brands using location-based advertising to generate sales and build brand awareness:
Timberland wanted to drive a younger demographic of customers to visit its physical stores and stockists.
Timberland used a combination of data, including whether a user had recently visited a brick-and-mortar store and how close they were to a store at the time.

The brand used technology to draw polygons around Timberland stores to target people in the “mindset to purchase footwear.”
The campaign results showed an increase in-store visits by 6.2%, with, notably, 20% of these visits within 24 hours of the user viewing the advertising campaign.
We’ve already discussed how Neutrogena used customers’ past shopping cart behaviors to increase its sales, so we know that the beauty brand is no stranger to behavioral targeting.
However, its next strategy – to advertise a new sunscreen – was rather ingenious.
Not happy to only target customers based on weather forecast apps, Neutrogena used real-time UV conditions, the time of day, and the proximity to shops selling Neutrogena to target potential customers.
Imagine browsing your phone on an unexpectedly hot summer’s day. You flick through Facebook and see a Neutrogena advert. You head to your nearest store and, surprise, surprise, it sells Neutrogena.
Which sunscreen will you purchase? I’m going to bet it’s Neutrogena.
Again, the results are stellar. Within a couple of months, the campaign increased awareness of the sunscreen from zero to 63% and increased purchase intent to more than 40%.
Suggested Selling Examples
Suggested selling is simply offering choices based on items that customers have already purchased. Suggested selling can come in the form of upselling or cross-selling, neither of which are new to the retail world.
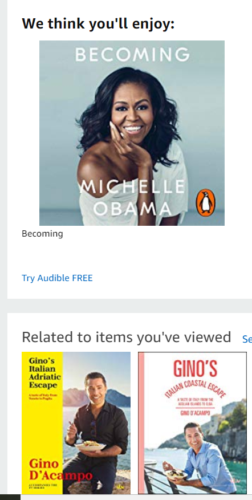
No article about suggested selling would be complete without discussing Amazon, arguably the Godfather of this technique.
According to this source, more than a third of Amazon’s revenue comes from its recommendation engine. That’s massive, but how does it work? Well, in a handful of ways.
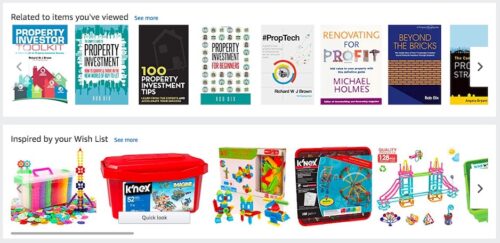
Recommended for You
On Amazon’s home page, you can click on a “Your Recommendations” link. This directs you to a page full of products recommended just for you. By suggesting a selection of products from the categories you’ve already viewed, Amazon aims to encourage you to click and buy additional items.
Frequently Bought Together
By adding a ‘frequently bought together’ section below your cart, Amazon successfully manages to increase your order value.
Browsing History
Amazon also shows you a history of the items you’ve purchased on Amazon. The fact that you’ve already viewed it signals that you’ve previously been interested in purchasing it, so it’s an easy way for Amazon to remind you of the product.
Sunuva may be a less well-known brand on the list, but its use of behavioral targeting has generated excellent results.
This UK-based kid’s clothing company wanted to increase sales, but with a small team, whatever the solution, it needed to be automated and easy to implement.
One of the core elements to increase sales was to focus on and reduce cart abandonment rates.
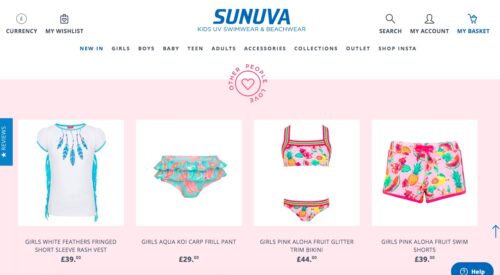
After a website redesign, Sunuva was able to use browsing behavior and real-time crowd-sourced data from other visitors.
This enabled the company to present its website visitors with relevant product recommendations, as well as email campaigns with content tailored to the customer, instead of generic offers.
Remarkably, the changes increased turnover by nearly 9% from the very first day.
Why is behavioral targeting slowly replacing demographic targeting?
Demographic data is limited.
Age, location, and income are all great factors in helping marketers create targeted messages. However, demographic data is fairly restricted when it comes to understanding the needs, wants, habits, and pain points of your customers.
Demographic data won’t tell you much about your customers’ behavior. Using strictly demographic data is often a hit-or-miss game.
Using behavioral data, marketers can target their own visitors by knowing which pages they’ve visited and what they’ve left in their carts. It allows for extremely precise targeting that cannot be achieved using demographic data.
Getting customers’ attention is harder than ever.
With more and more people ignoring generic ad formats, marketers worry that traditional PPC advertising and display ads are losing momentum.
Demographic data is used by everyone
Most demographic data can be accessed by anyone, including your competitors.
To keep their edge, marketers should use their own customer’s data to create more personalized online experiences. That way, marketers can achieve greater ROAS and ROI while ensuring their customers are exposed to the right ads, at the right time.
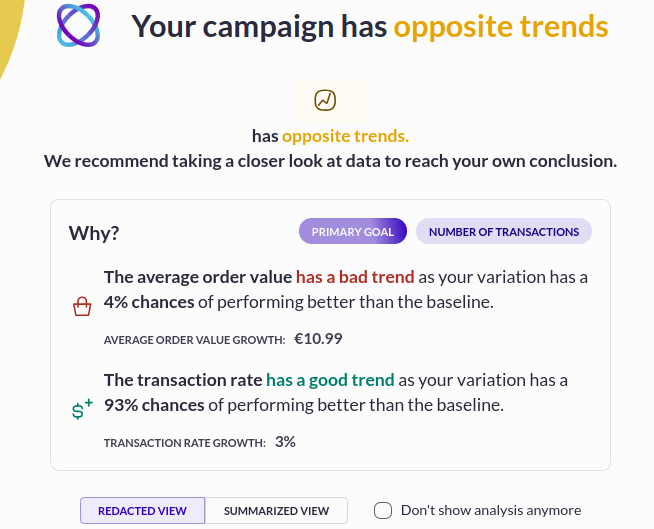
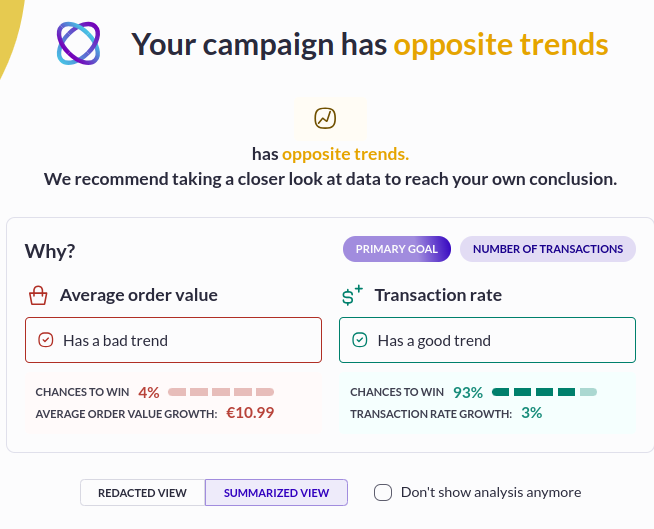
The next step of behavioral marketing: emotional personalization
Emotions play a pivotal role in every step of the buying process. To truly connect with consumers, brands must decode not just their behaviors, but also the emotional motivations behind their decisions. Purchasing decisions are not always rational, and not everyone reacts in the same way.
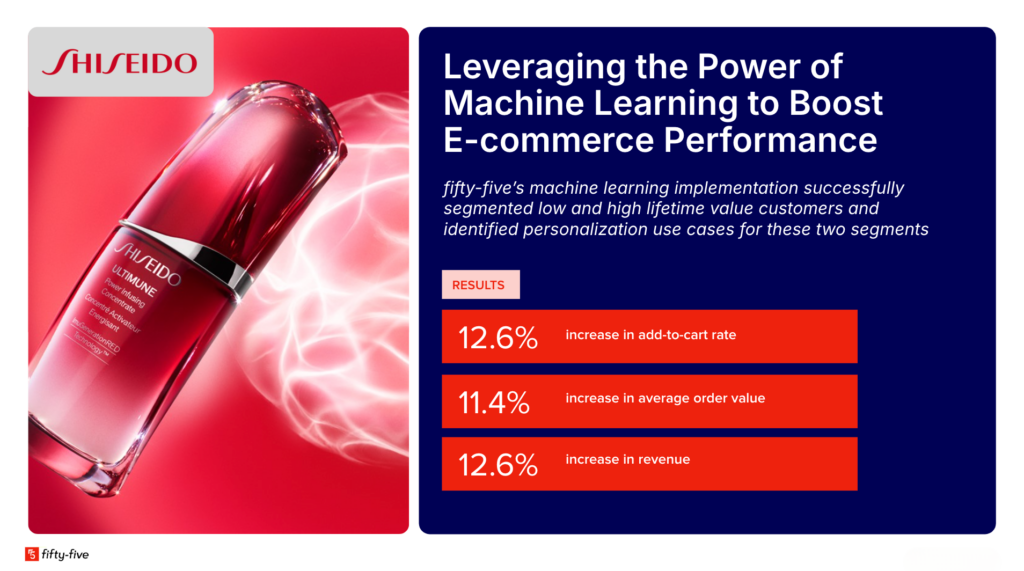
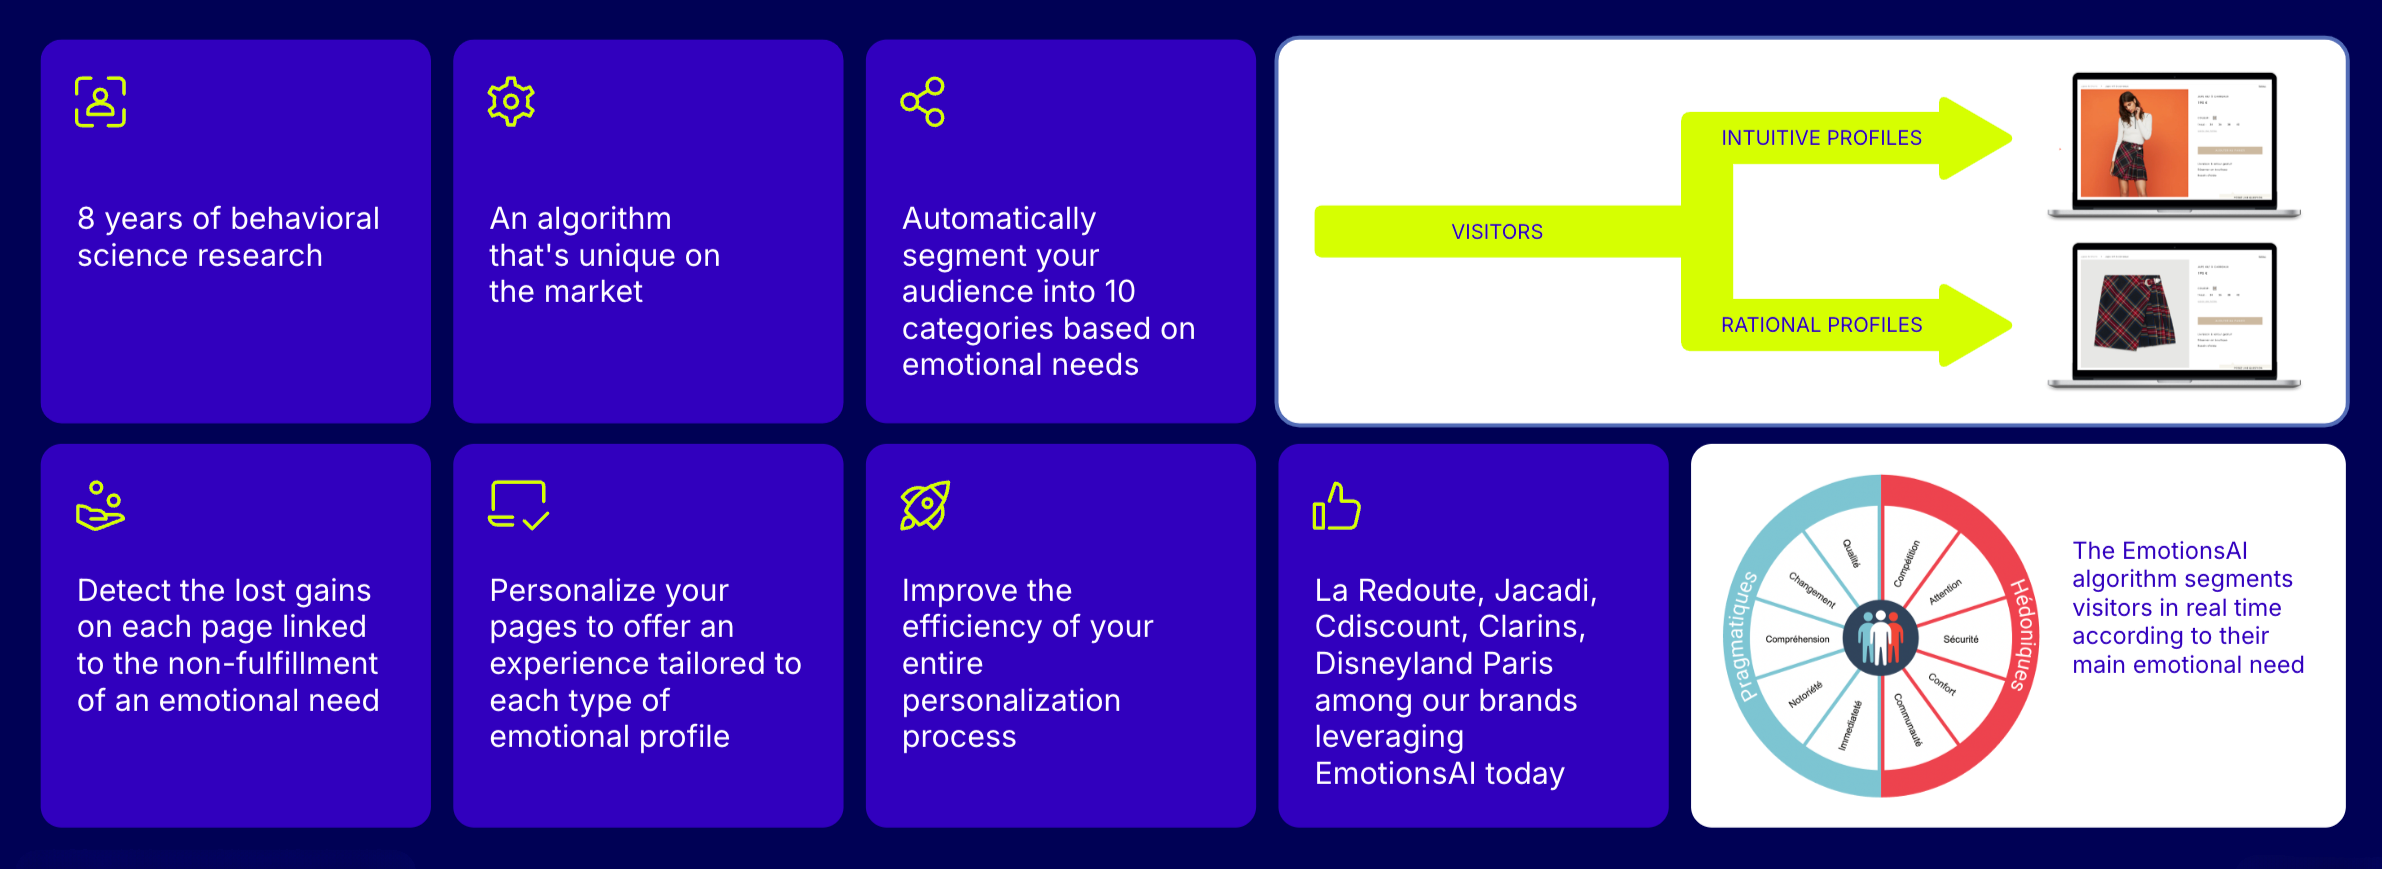
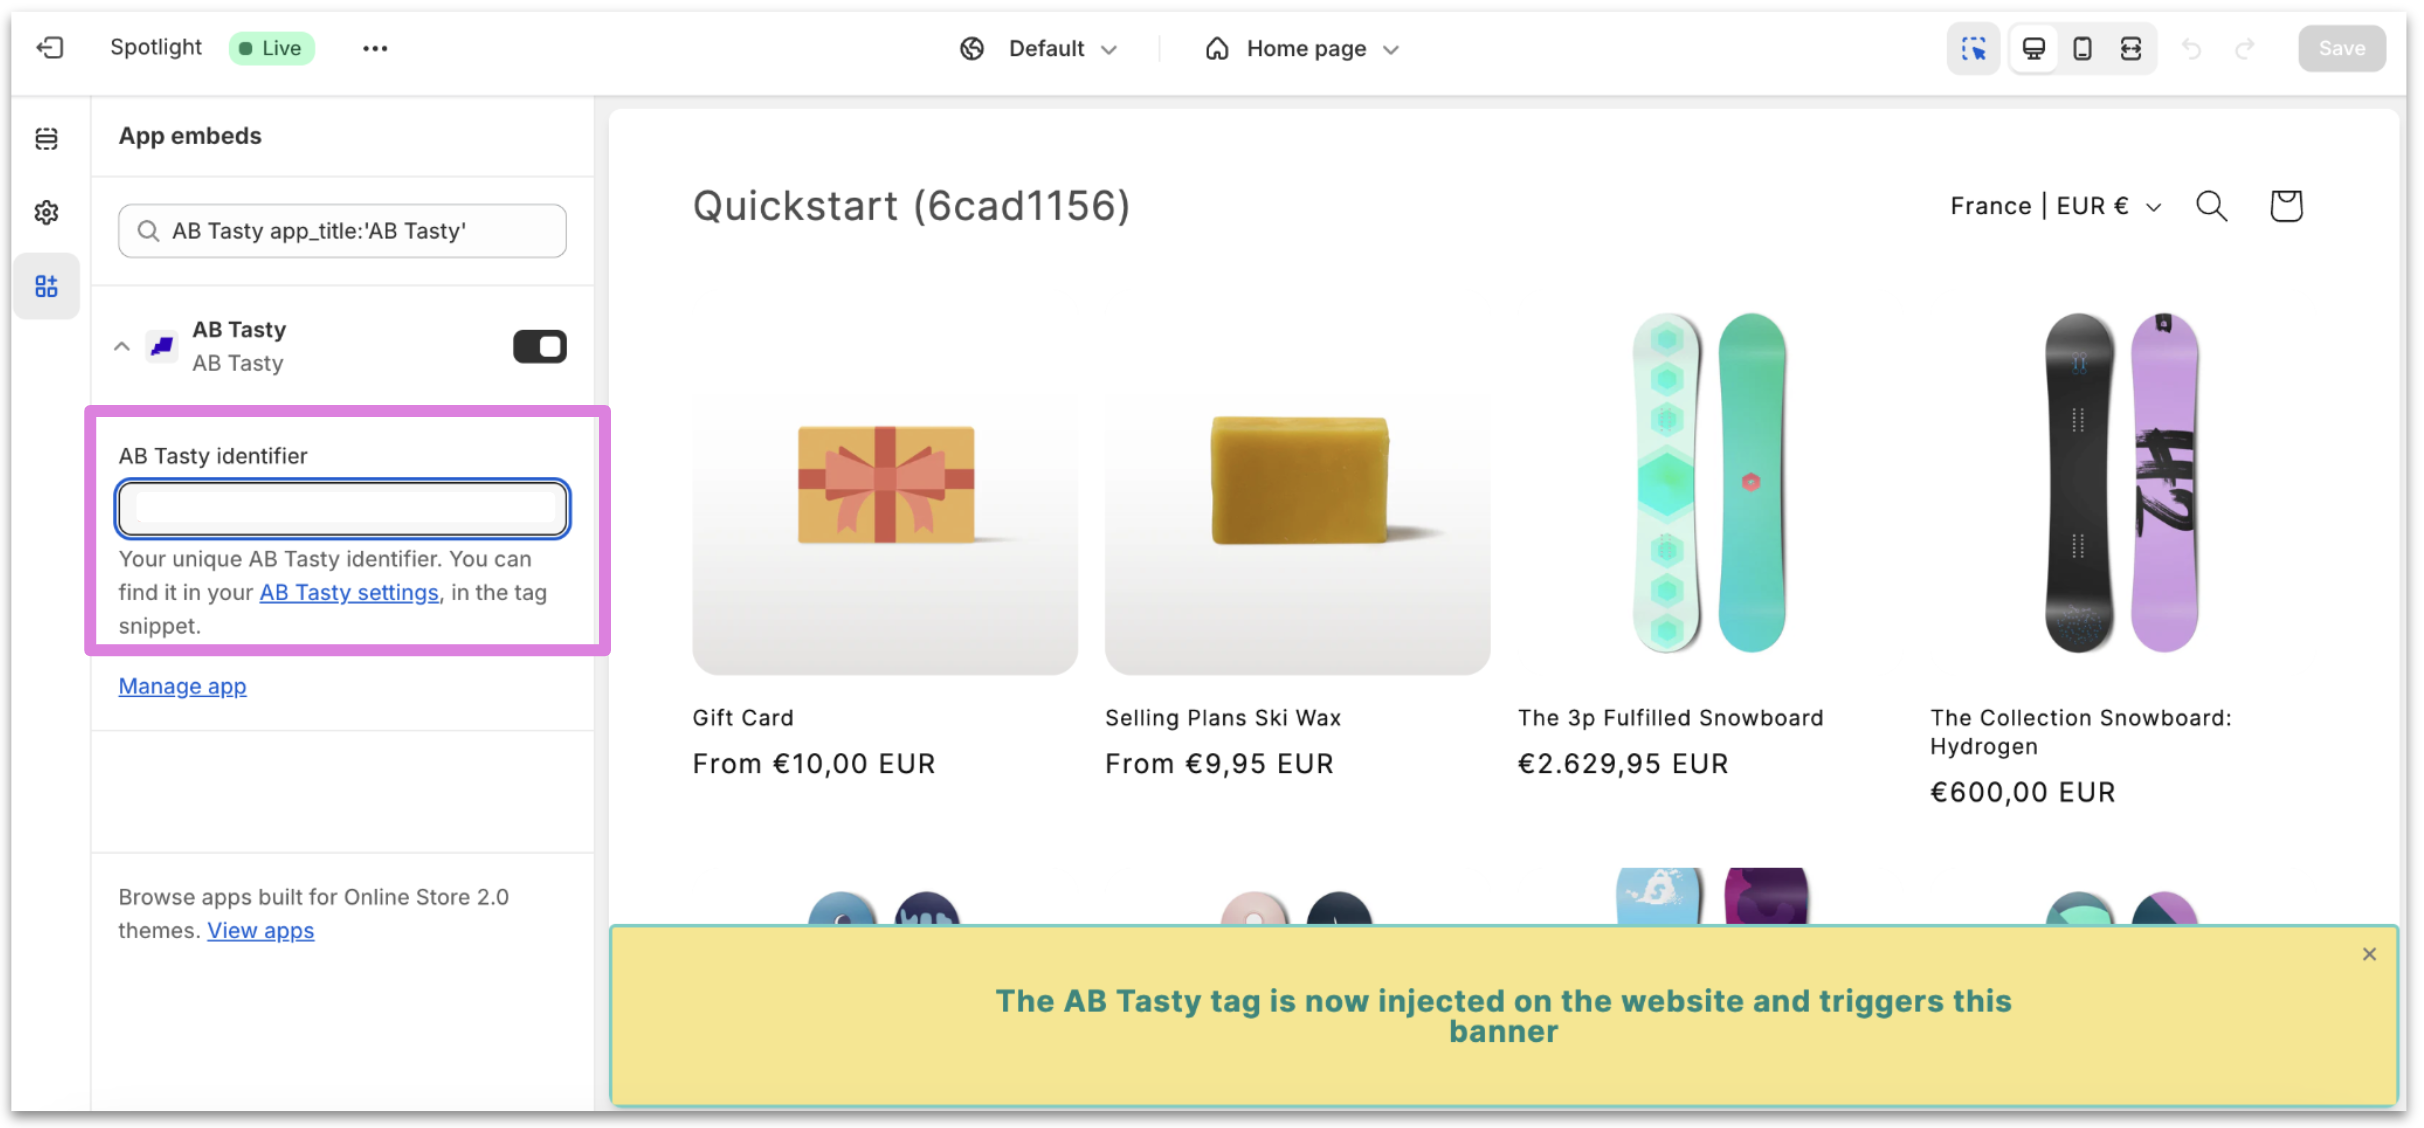
With AB Tasty’s new hyper personalization software, EmotionsAI, you can craft tailored messages for each visitor type, analyze data to discern their desires, conduct experiments to refine messaging and design personalized journeys that cater to specific emotional triggers.
Stay ahead of the curve in experience optimization with EmotionsAI – the ultimate tool for mastering emotional personalization. Dive into emotional personalization with sophisticated algorithms to anticipate buying patterns and tailor experiences accordingly.
5 Behavioral targeting marketing and advertisement tactics
- Leverage upselling & cross-selling
Knowing what your customers love and how they interact with your business is a massively powerful tool to suggest additional products to them.
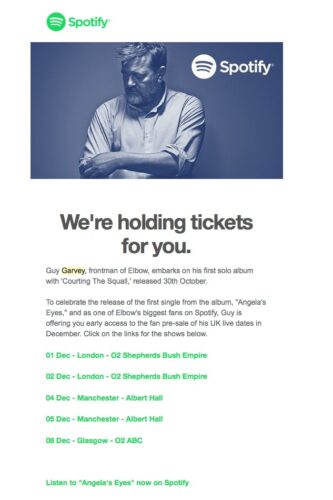
Take Spotify. They track the music we listen to and the frequency at which we do it, and then craft personal ads based on our preferences to sell concert tickets and bring us back to their app. Behavioral marketing is that powerful.
If your company has any e-commerce activities, then you’re likely already familiar with cross-selling and suggested products: techniques that are also powered by behavioral marketing.
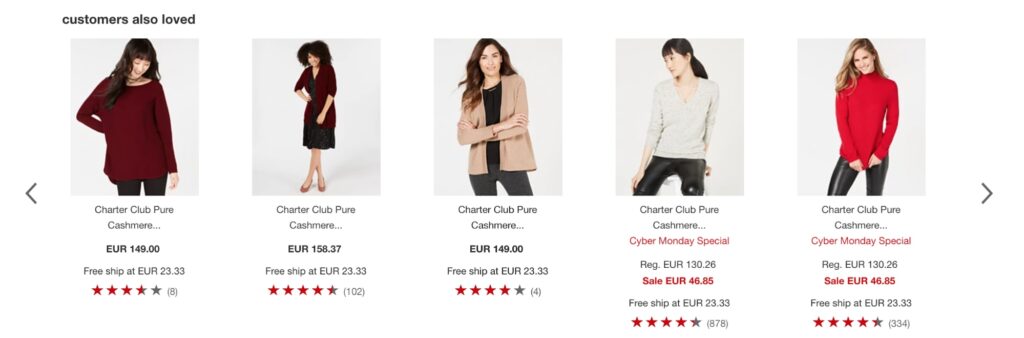
As an example, Macy’s uses product recommendations to promote related products based on customers’ data, to increase basket value.
2. Use behavioral email marketing campaigns
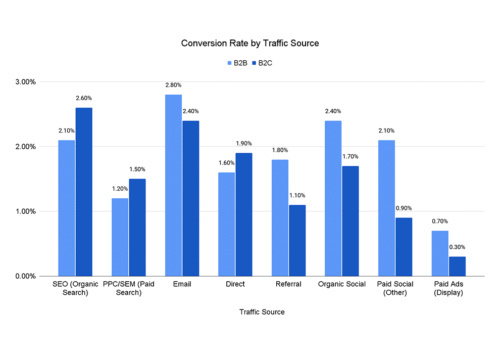
According to FPS research insights, email marketing still delivers the highest conversion rates when it comes to selling products and services.
Knowing this, marketers can strengthen their email marketing campaigns by using behavioral targeting tactics.
Basically, behavioral email marketing consists of sending targeted emails to users based on their past actions on a website (cart abandonment, pages visited, newsletter subscription, etc.).
Take this example: Quora’s goal is for you to return to their website as much as possible.

By knowing which pages you’ve read in the past, Quora is able to send personalized emails highlighting similar topics to pique your interest and draw you back to their site.
This is behavioral targeting on an individual scale.
3. Leverage Facebook, Google, and other retargeting services
Retargeting and remarketing are common tactics used to target potential customers who’ve previously visited your website by showing them ads on other websites (like online publications, social networks, or even game sites).
There are several ad networks that support retargeting.
Among them, Facebook and Google are the most common options because they reach large audiences and provide accurate data and analysis on the generated sales. They also boast a lot of integrations with third-party data analysis tools.
Nowadays, the number of factors that can be tracked is impressive:
- Which pages have been visited?
- How long were the sessions?
- Which products were bought?
- What was the average order value?
- How many products were purchased?
- How long has it been since a visitor’s last session?
- Which customers have added a product to the cart and then abandoned it?
Once marketers have gathered enough behavioral data, they can proceed to create user segments based on behavioral traits and show them highly relevant ads.
Here’s an example of retargeting:
Let’s say your e-commerce generates high cart abandonment rates.
You can create a user segment based on people who have abandoned a specific product (say, your best seller) in their cart and create an ad that will target these users. To increase its efficiency, you can create a sense of urgency by offering them a discount provided that they buy the item now.
If you successfully target the right people, your ad’s audience is now exclusively composed of potential customers who already know your product, thus generating much higher conversion rates.
Although we’ve talked a lot about Facebook and Google’s retargeting features, do not forget that other advertising platforms (like Outbrain or Criteo) can also provide remarketing services.
Your retargeted ads can appear on many websites, including major online publications such as Forbes or WSJ, depending on your audience’s habits and digital media consumption.
4. Go granular with precise geographic targeting
Whether you’re selling products or services, knowing the precise geolocation of your visitors (thanks to their IP addresses) can make a huge difference in your campaign’s success.
Let’s pretend that you run a clothing company that sells year-round fashion. Using your data analytics tool, you could create user segments based on their geolocation to advertise clothes that are relevant to them, given their current browsing location.
Geo-targeted ads can also be served at a city level, meaning that marketers can tailor ads to reach a restricted but qualified audience. This can be especially useful for companies that rely on their respective offices to carry out their business activities.
Using geo-targeted advertising, marketers are able to create specific, tailored audiences that leverage both behavioral and demographic parameters to ensure their campaign’s success.
5. Experiment with personalized coupons, offers, and discounts
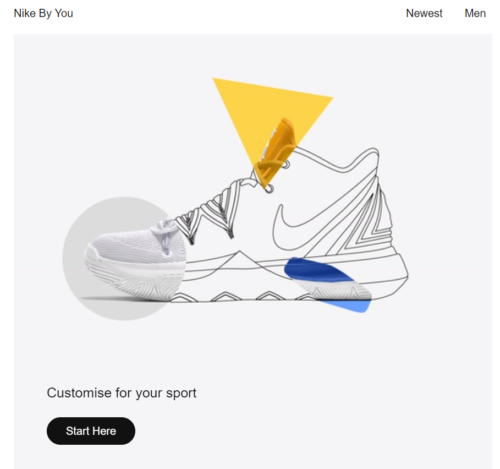
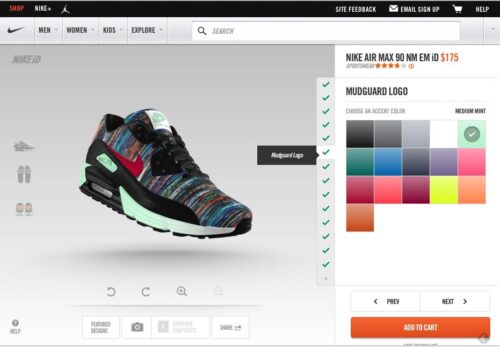
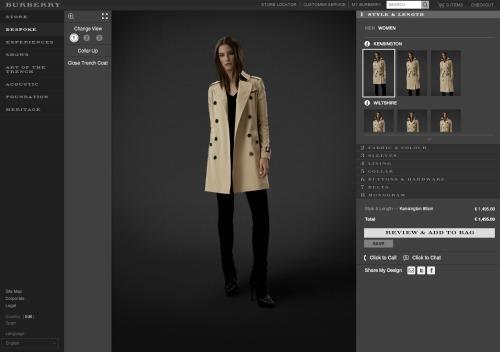
Website personalization consists of crafting customized experiences based on consumers’ wants, needs, and past actions as opposed to offering a single, generic experience to all consumers regardless of their preferences.
Retail and tech giants like Amazon have long started to implement some level of website personalization (like wishlists and recommended products). Displaying different content based on a visitor’s personal preferences has become an essential marketing technique.
People don’t hate ads, they hate irrelevant ads.
Knowing this, marketers can create segment-based ads to increase relevancy and boost engagement.
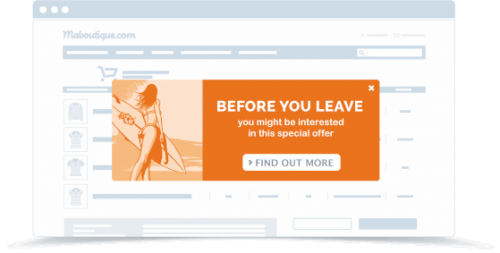
This targeted pop-up ad has an offer enclosed to deter users from leaving the site. By using an all-in-one CRO solution (like AB Tasty) you can implement customized content on any page you want and craft your own display rules based on your consumers’ data.
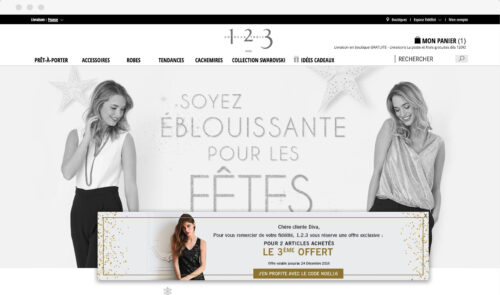
How to create a personalized experience
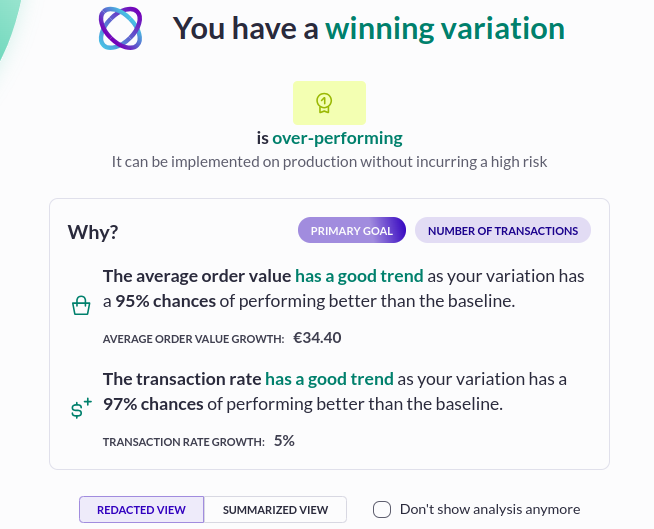
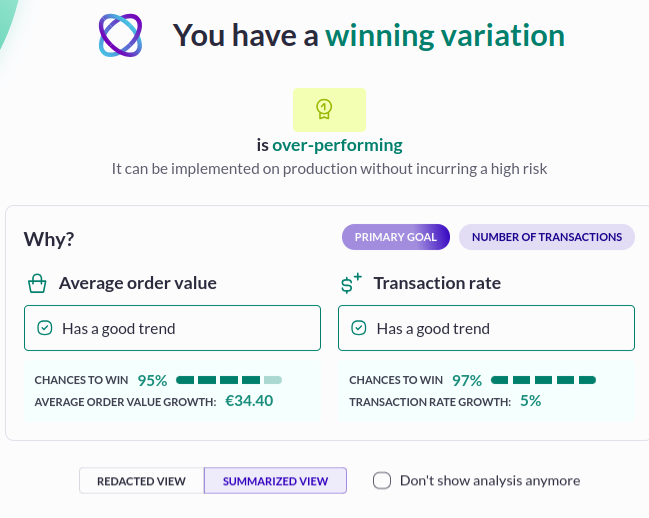
Our team at AB Tasty knows how much of an impact customized experiences can make on our clients’ online revenue. So, we implemented a loyalty overlay pop-up for one of our French fashion retailers. This overlay pop-up would only appear for loyal customers and reward them with a limited discount.
Our goal was to increase customer retention while maximizing revenue from returning customers, boosting brand loyalty in the very competitive French fashion environment.
Getting Started with Behavioral Marketing
Behavioral marketing is a powerful way to carry out your marketing strategy. It uses the behaviors of your website visitors and customers to create highly relevant content that encourages them to make a purchase at your website or even in your online store.
This article has discussed some examples of brands successfully using behavioral marketing, but now it’s over to you to try it out for yourself.
Start by choosing one of the tactics shown in this article and see how it can make your advertising more relevant and successful.