E-commerce has completely changed the way shoppers interact with their favorite brands.
From the continued rise of mobile commerce to virtual-reality try-on tools and AI customer service, some consumer trends have proven to be evergreen while others fall out of fashion in a season. As e-commerce marketers, it can be hard to know when to chase a trend or stick to being consistent.
To help you better understand the mind of today’s consumers, we’ve broken down 10 key insights for e-commerce from our 2025 global report. Based on feedback from 4,000 consumers across the U.S., U.K., France, Italy, and Australia, this snapshot reveals how people discover new products, engage with AI, make purchase decisions, and much more.
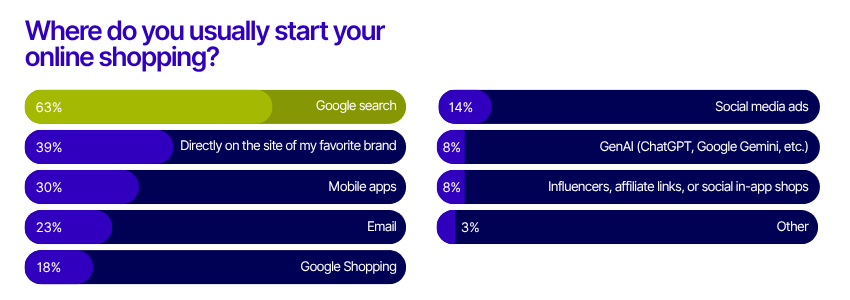
1. Google Search is the first place for discovery
When it comes to starting an online shopping journey, Google Search is still king. Nearly two-thirds (63%) of global shoppers begin their hunt for a new product or service with a Google search.
This underscores the ongoing importance of SEO for e-commerce brands. If your product pages aren’t optimized, you risk missing out on a massive audience at the very first step of their journey.
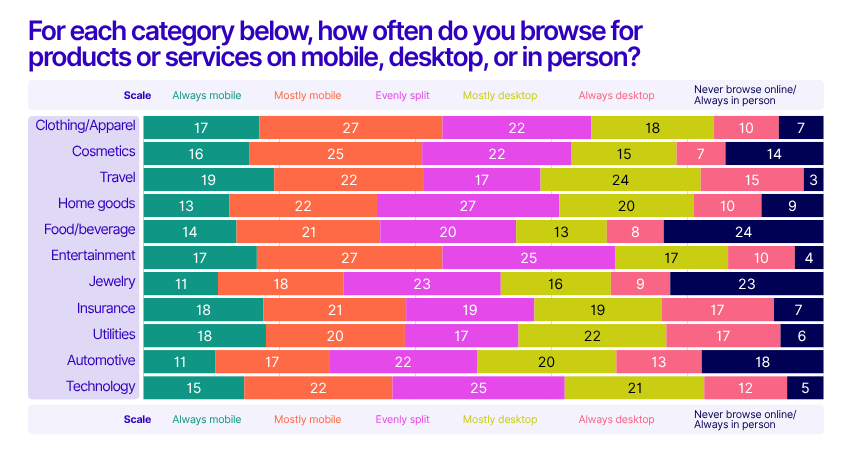
2. Mobile takes over, but desktop still matters
By the end of 2024, smartphones accounted for nearly 80% of global retail site traffic and over two-thirds of online orders. Mobile is now the primary device for browsing and purchasing in categories like clothing, cosmetics, and entertainment.
However, desktop still plays a significant role in sectors such as travel and utilities, especially among older generations. Brands should continue to prioritize mobile-first design, but not neglect the desktop experience—especially for high-consideration purchases.
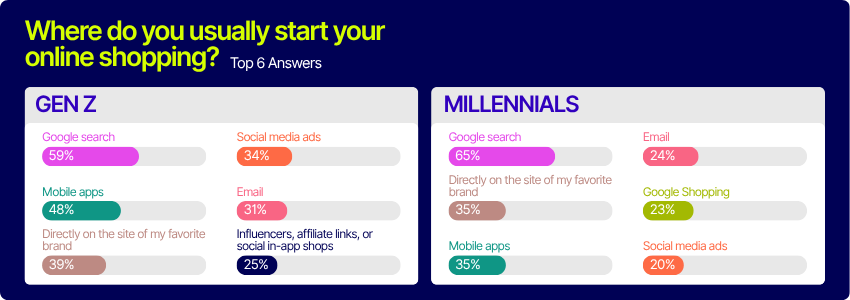
3. Millennials vs. Gen Z: Mobile app habits
Generational differences are shaping the future of e-commerce. For Gen Z, mobile apps are the second most popular starting point for shopping (48%), just behind Google. Millennials, on the other hand, split their preference between apps and brand websites (both at 35%). This means younger shoppers are more likely to use apps for discovery, while Millennials are equally comfortable with apps and direct website visits.
Brands need more than just a mobile presence to capture Gen Z’s attention. They need apps built for exploration, speed, and flexibility. With Feature Experimentation and Rollouts from AB Tasty, teams can continuously test and optimize in-app experiences without a full redeploy, ensuring their app evolves alongside user expectations.
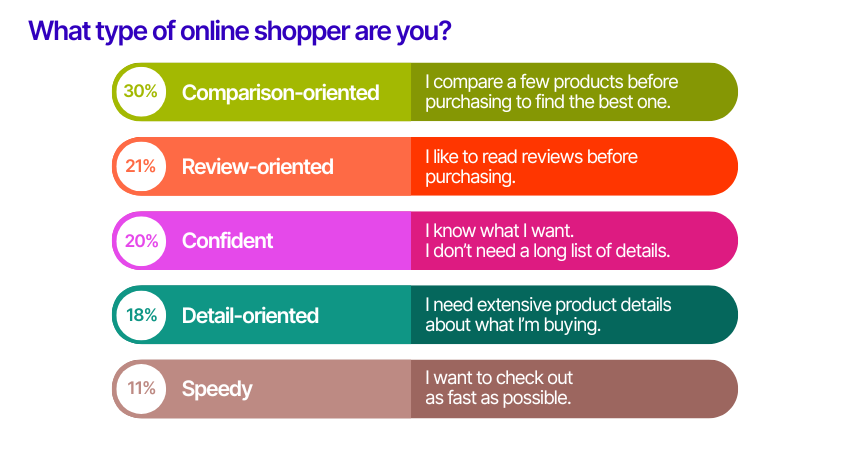
4. Comparison shoppers lead the pack
Not all online shoppers are the same. Our research found that the most common shopper persona is “comparison-oriented”—30% of respondents compare multiple products before making a purchase. Only 11% identify as “speedy” shoppers who want to check out as quickly as possible. The rest fall somewhere in between, with 21% being “review-oriented,” 20% “confident,” and 18% “detail-oriented.” This diversity highlights the need for flexible site experiences that cater to different decision-making styles.
If one size doesn’t fit all, then understanding your audience is the first step to building experiences that truly convert.
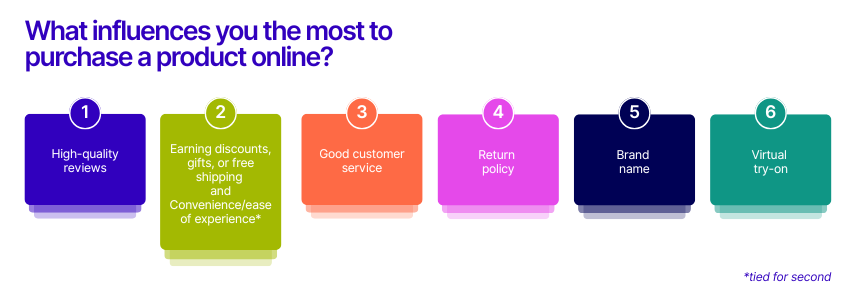
5. Reviews are more influential than discounts or brand names
When it comes to influencing purchase decisions, high-quality reviews top the list globally. Shoppers trust peer validation more than discounts, convenience, or even brand names. Written testimonials and customer photos are especially valued, providing the authenticity and detail shoppers crave.
Make sure your reviews are visible, filterable, and packed with real customer insights to boost trust and conversions.
E-commerce moves fast. Get the insights that help you move faster. Download the 2025 report now.
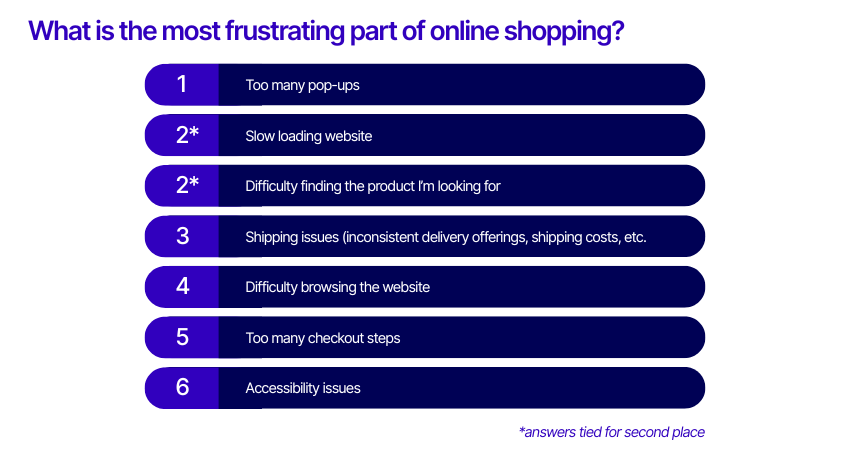
Think you’re converting more by hitting new visitors with an email sign-up pop-up right away? Think again.
Too many pop-ups are the number one frustration for online shoppers worldwide, followed closely by slow-loading websites and difficulty finding products. While pop-ups can be effective for capturing leads or promoting offers, overuse can drive customers away. Use them strategically and ensure your site is fast and easy to navigate to keep shoppers engaged.
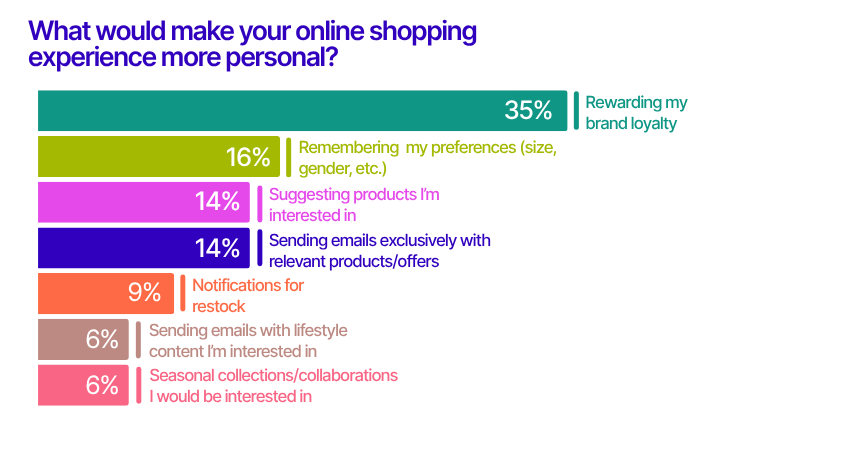
7. Loyalty is the key to better personalization
Personalization is more than just a buzzword—it’s a key driver of customer satisfaction and loyalty. The top way to make online shopping feel more personal, according to 35% of respondents, is by rewarding brand loyalty. Remembering preferences and suggesting relevant products also rank highly.
Brands that recognize and reward repeat customers with exclusive perks or early access to new products can turn shoppers into advocates.
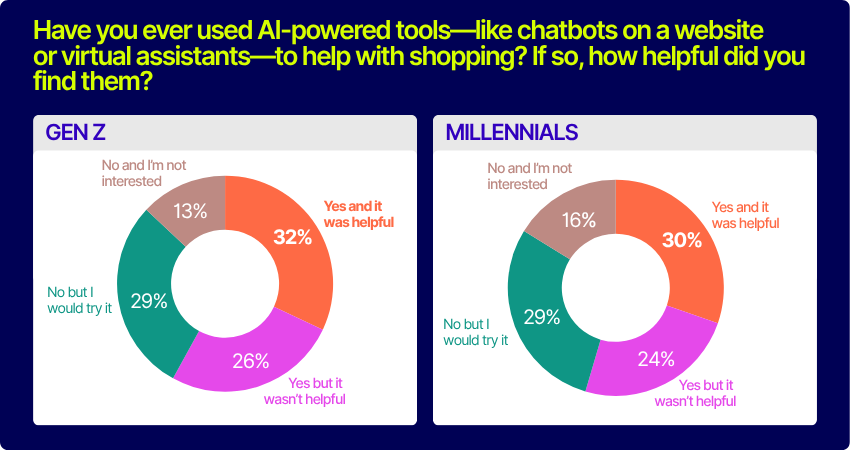
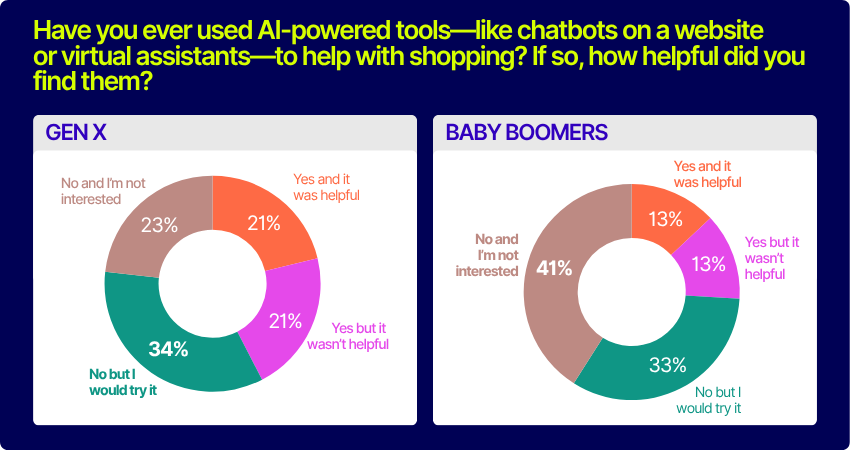
8. AI adoption is growing, especially among younger shoppers
AI-powered tools like chatbots and virtual assistants are gaining traction, but there’s still room for improvement. Just under a quarter (23%) of shoppers have used AI tools and found them helpful, while 32% haven’t tried them but are open to it. Younger generations are more receptive: 32% of Gen Z and 30% of Millennials found AI tools helpful, compared to just 13% of Baby Boomers.
To win over skeptics, brands need to ensure AI support is fast, relevant, and seamlessly integrated with human assistance.
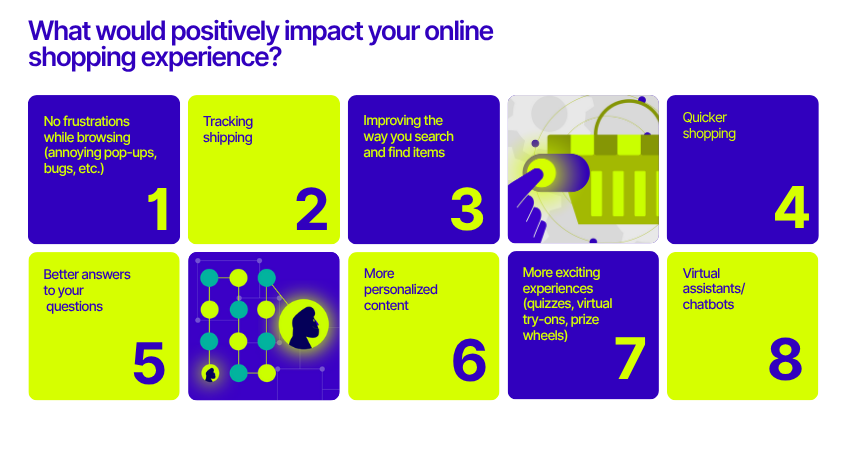
9. Shoppers just want frictionless experiences
When asked what would most improve their online shopping experience, the top answer was simple: removing frustrations like pop-ups, bugs, and broken pages. Tracking shipping, improving product search, and speeding up the shopping process were also highly valued.
Before investing in flashy features, brands should focus on getting the basics right—smooth, intuitive journeys are what keep customers coming back.
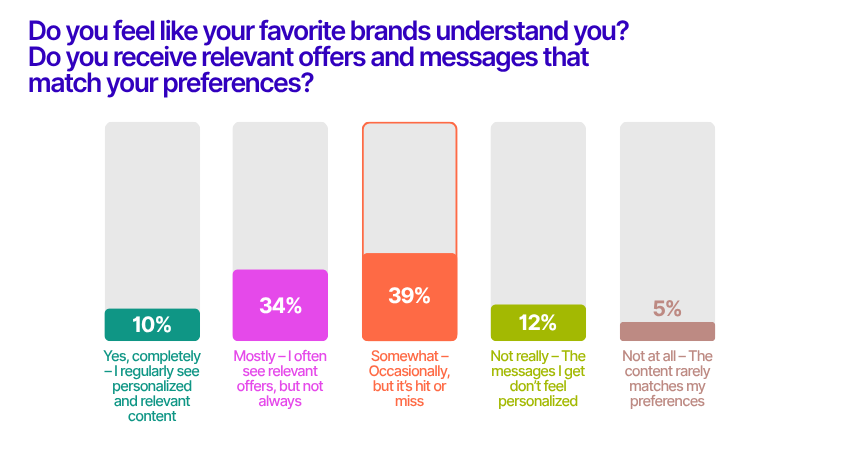
10. The gap between personalization and perception
Personalization is supposed to make shoppers feel seen—but only 1 in 10 consumers say their favorite brands truly “get” them. In fact, the most common answer was “somewhat,” as 39% of respondents said the messages and offers they receive are hit or miss. Another 34% said brands mostly deliver relevant content, but not always. For the majority, the digital experience feels inconsistent.
When personalization doesn’t land, it can come off as surface-level or even off-putting. The takeaway? Personalization isn’t just about using data—it’s about using it meaningfully, so relevance feels intentional, not accidental.
Conclusion
The bar for digital shopping experiences keeps rising, and today’s consumers are quicker than ever to click away when expectations aren’t met.
From discovery to checkout, each step in the customer journey has the potential to shape customer loyalty and long-term value. Our 2025 E-commerce Consumer report dives even deeper into generational trends, regional differences, and actionable strategies for optimizing your digital experience.
Average Order Value (AOV) is a widely used metric in Conversion Rate Optimization (CRO), but it can be surprisingly deceptive. While the formula itself is simple—summing all order values and dividing by the number of orders—the real challenge lies within the data itself.
The problem with averaging
AOV is not a “democratic” measure. A single high-spending customer can easily spend 10 or even 100 times more than your average customer. These few extreme buyers can heavily skew the average, giving a limited number of visitors disproportionate impact compared to hundreds or thousands of others. This is problematic because you can’t truly trust the significance of an observed AOV effect if it’s tied to just a tiny fraction of your audience.
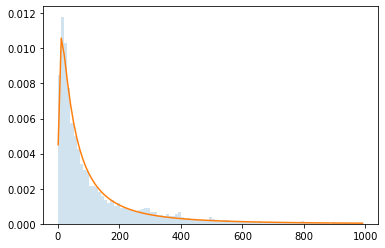
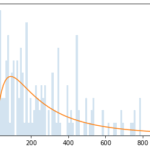
Let’s look at a real dataset to see just how strong this effect can be. Consider the order value distribution:
The horizontal axis represents the order value.
The vertical axis represents the frequency of that order value.
The blue surface is a histogram, while the orange outline is a log-normal distribution approximation.
This graph shows that the most frequent order values are small, around €20. As the order value increases, the frequency of such orders decreases. This is a “long/heavy tail distribution,” meaning very large values can occur, albeit rarely.
A single strong buyer with an €800 order value is worth 40 times more than a frequent buyer when looking at AOV. This is an issue because a slight change in the behavior of 40 visitors is a stronger indicator than a large change from one unique visitor. While not fully visible on this scale, even more extreme buyers exist.
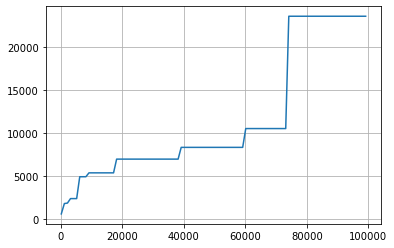
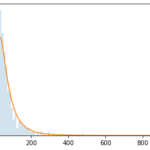
The next graph, using the same dataset, illustrates this better:
The horizontal axis represents the size of the growing dataset of order values (roughly indicating time).
The vertical axis represents the maximum order value in the growing dataset in €
At the beginning of data collection, the maximum order value is quite small (close to the most frequent value of ~€20). However, we see that it grows larger as time passes and the dataset expands. With a dataset of 10,000 orders, the maximum order value can exceed €5,000. This means any buyer with an order above €5,000 (they might have multiple) holds 250 times the power of a frequent buyer at €20. At the maximum dataset size, a single customer with an order over €20,000 can influence the AOV more than 2,000 other customers combined.
When looking at your e-commerce metrics, AOV should not be used as a standalone decision-making data.
E-commerce moves fast. Get the insights that help you move faster. Download the 2025 report now.
The problem intensifies when considering the random splits used in A/B tests.
Imagine you have only 10 very large spenders whose collective impact equals that of 10,000 medium buyers. There’s a high probability that the random split for such a small group of users will be uneven. While the overall dataset split is statistically even, the disproportionate impact of these high spenders on AOV requires specific consideration for this small segment. Since you can’t predict which visitor will become a customer or how much they will spend, you cannot guarantee an even split of these high-value users.
This phenomenon can artificially inflate or deflate AOV in either direction, even without a true underlying effect, simply depending on which variation these few high spenders land on.
What’s the solution?
AOV is an unreliable metric, how can we effectively work with it? The answer is similar to how you approach conversion rates and experimentation.
You don’t trust raw conversion data—one more conversion on variation B doesn’t automatically make it a winner, nor do 10 or 100. Instead, you rely on a statistical test to determine when a difference is significant. The same principle applies to AOV. Tools like AB Tasty offer the Mann-Whitney test, a statistical method robust against extreme values and well-suited for long-tail distributions.
AOV behavior can be confusing because you’re likely accustomed to the more intuitive statistics of conversion rates. Conversion data and their corresponding statistics usually align; a statistically significant increase in conversion rate typically means a visibly large difference in the number of conversions, consistent with the statistical test. However, this isn’t always the case with AOV. It’s not uncommon to see the AOV trend and the statistical results pointing in different directions. Your trust should always be placed in the statistical test.
The root cause: Heavy tail distributions
You now understand that the core issue stems from the unique shape of order value distributions: long-tail distributions that produce rare, extreme values.
It’s important to note that the problem isn’t just the existence of extreme values. If these extreme values were frequent, the AOV would naturally be higher, and their impact would be less dramatic because the difference between the AOV and these values would be smaller. Similarly, for the splitting problem, a larger number of extreme values would ensure a more even split.
At this point, you might think your business has a different order distribution shape and isn’t affected. However, this shape emerges whenever these two conditions are met:
You have a price list with more than several dozen different values.
Visitors can purchase multiple products at once.
Needless to say, these conditions are ubiquitous and apply to nearly every e-commerce business. The e-commerce revolution itself was fueled by the ability to offer vast catalogues.
Furthermore, the presence of shipping costs naturally encourages users to group their purchases to minimize those costs. It means that nearly all e-commerce businesses are affected. The only exceptions are subscription-based businesses with limited pricing options, where most purchases are for a single service.
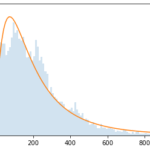
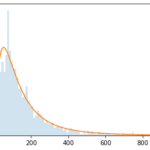
Here’s a glimpse into the order value distribution across various industries, demonstrating the pervasive nature of the “long tail distribution”:
Cosmetic
Transportation
B2B packaging (selling packaging for e-commerce)
Fashion
online flash sales
AOV, despite its simple definition and apparent ease of understanding, is a misleading metric.Its magnitude is easy to grasp, leading people to confidently make intuitive decisions based on its fluctuations. However, the reality is far more complex; AOV can show dramatic changes even when there’s no real underlying effect.
Conversely, significant changes can go unnoticed. A strong negative effect could be masked by just a few high-spending customers landing in a poorly performing variation. So, now you know: just as you do for conversion rates, rely on statistical tests for your AOV decisions.
Hello! I’m Léo, Senior Product Manager at AB Tasty. I’m in charge of AB Tasty’s JavaScript tag that is currently running on thousands of websites around the world. As you can guess, my roadmap is full of topics around data collection, privacy, and… performance.
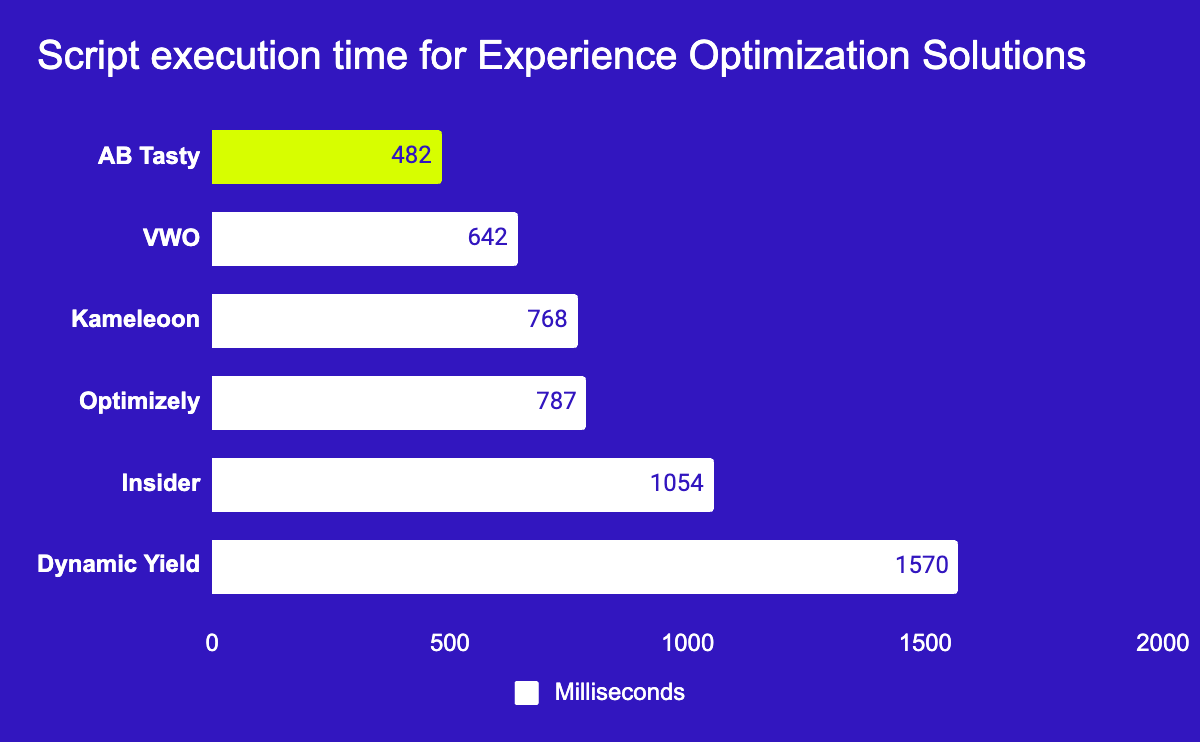
It’s why I’m so excited to give an update on our performance, and how we’ve worked hard to be the best. We’re now providing loading times up to 4 faster than other solutions on the market.
In a world where every second counts, slow-loading pages are the fast track to lost revenue. At AB Tasty, we know that speed isn’t just about convenience; it’s about delivering the smooth, reliable experience that today’s consumers expect.
That’s why we’re thrilled to be recognized by ThirdPartyWeb.today for having one of the lowest impacts on web performance among top experimentation and personalization platforms. This acknowledgment affirms our commitment to speed, scalability, and brand satisfaction.
But what does this actually mean for brands using AB Tasty?
Let’s dive into how prioritizing performance can improve your SERP rankings, customer experience (CX), and overall campaign effectiveness.
Why Web Performance Impacts Your Bottom Line
Imagine clicking on a page that seems to take forever to load. Chances are, you’d be out of there faster than you could say “conversion rate.” And you wouldn’t be alone: slow page load times can lead to increased bounce rates, missed opportunities, and, ultimately, frustrated visitors.
Good performance translates into smoother customer journeys, which leads to better engagement and, most importantly, higher conversion rates.
ThirdPartyWeb.today: The Performance Benchmark
ThirdPartyWeb.today is an independent performance data visualization initiative that analyzes the impact of various platforms on page speed. It ranks tools according to their performance cost, drawing data from nearly 4 million websites to create an unbiased performance benchmark. For brands aiming to deliver a seamless experience without sacrificing speed, ThirdPartyWeb.today provides a reliable guide for evaluating the performance impact of their tools.
Being recognized as one of the most performance-friendly Experience Optimization platforms by ThirdPartyWeb.today means our clients know they’re partnering with a technology designed with speed in mind.
What Makes AB Tasty the Fastest?
Our tech teams have worked tirelessly to make AB Tasty not only an intuitive experimentation and personalization platform, but one that prioritizes high performance. Here’s a quick look at the innovations that make AB Tasty so fast and reliable:
Modular Architecture with Innovative Dynamic Importing and Smart Caching Technology Our platform is built with a modular architecture, where only essential code is loaded for each campaign. This keeps file sizes lean, reducing load time and resource consumption.Our proprietary smart caching technology ensures that visitors only need to load the data they haven’t accessed before. By minimizing redundant data calls, we significantly reduce load times across all devices. We also provide worldwide API endpoints and have a global CDN presence with multiple Edge locations and regional Edge caches for fast response times no matter where you and your site visitors are.
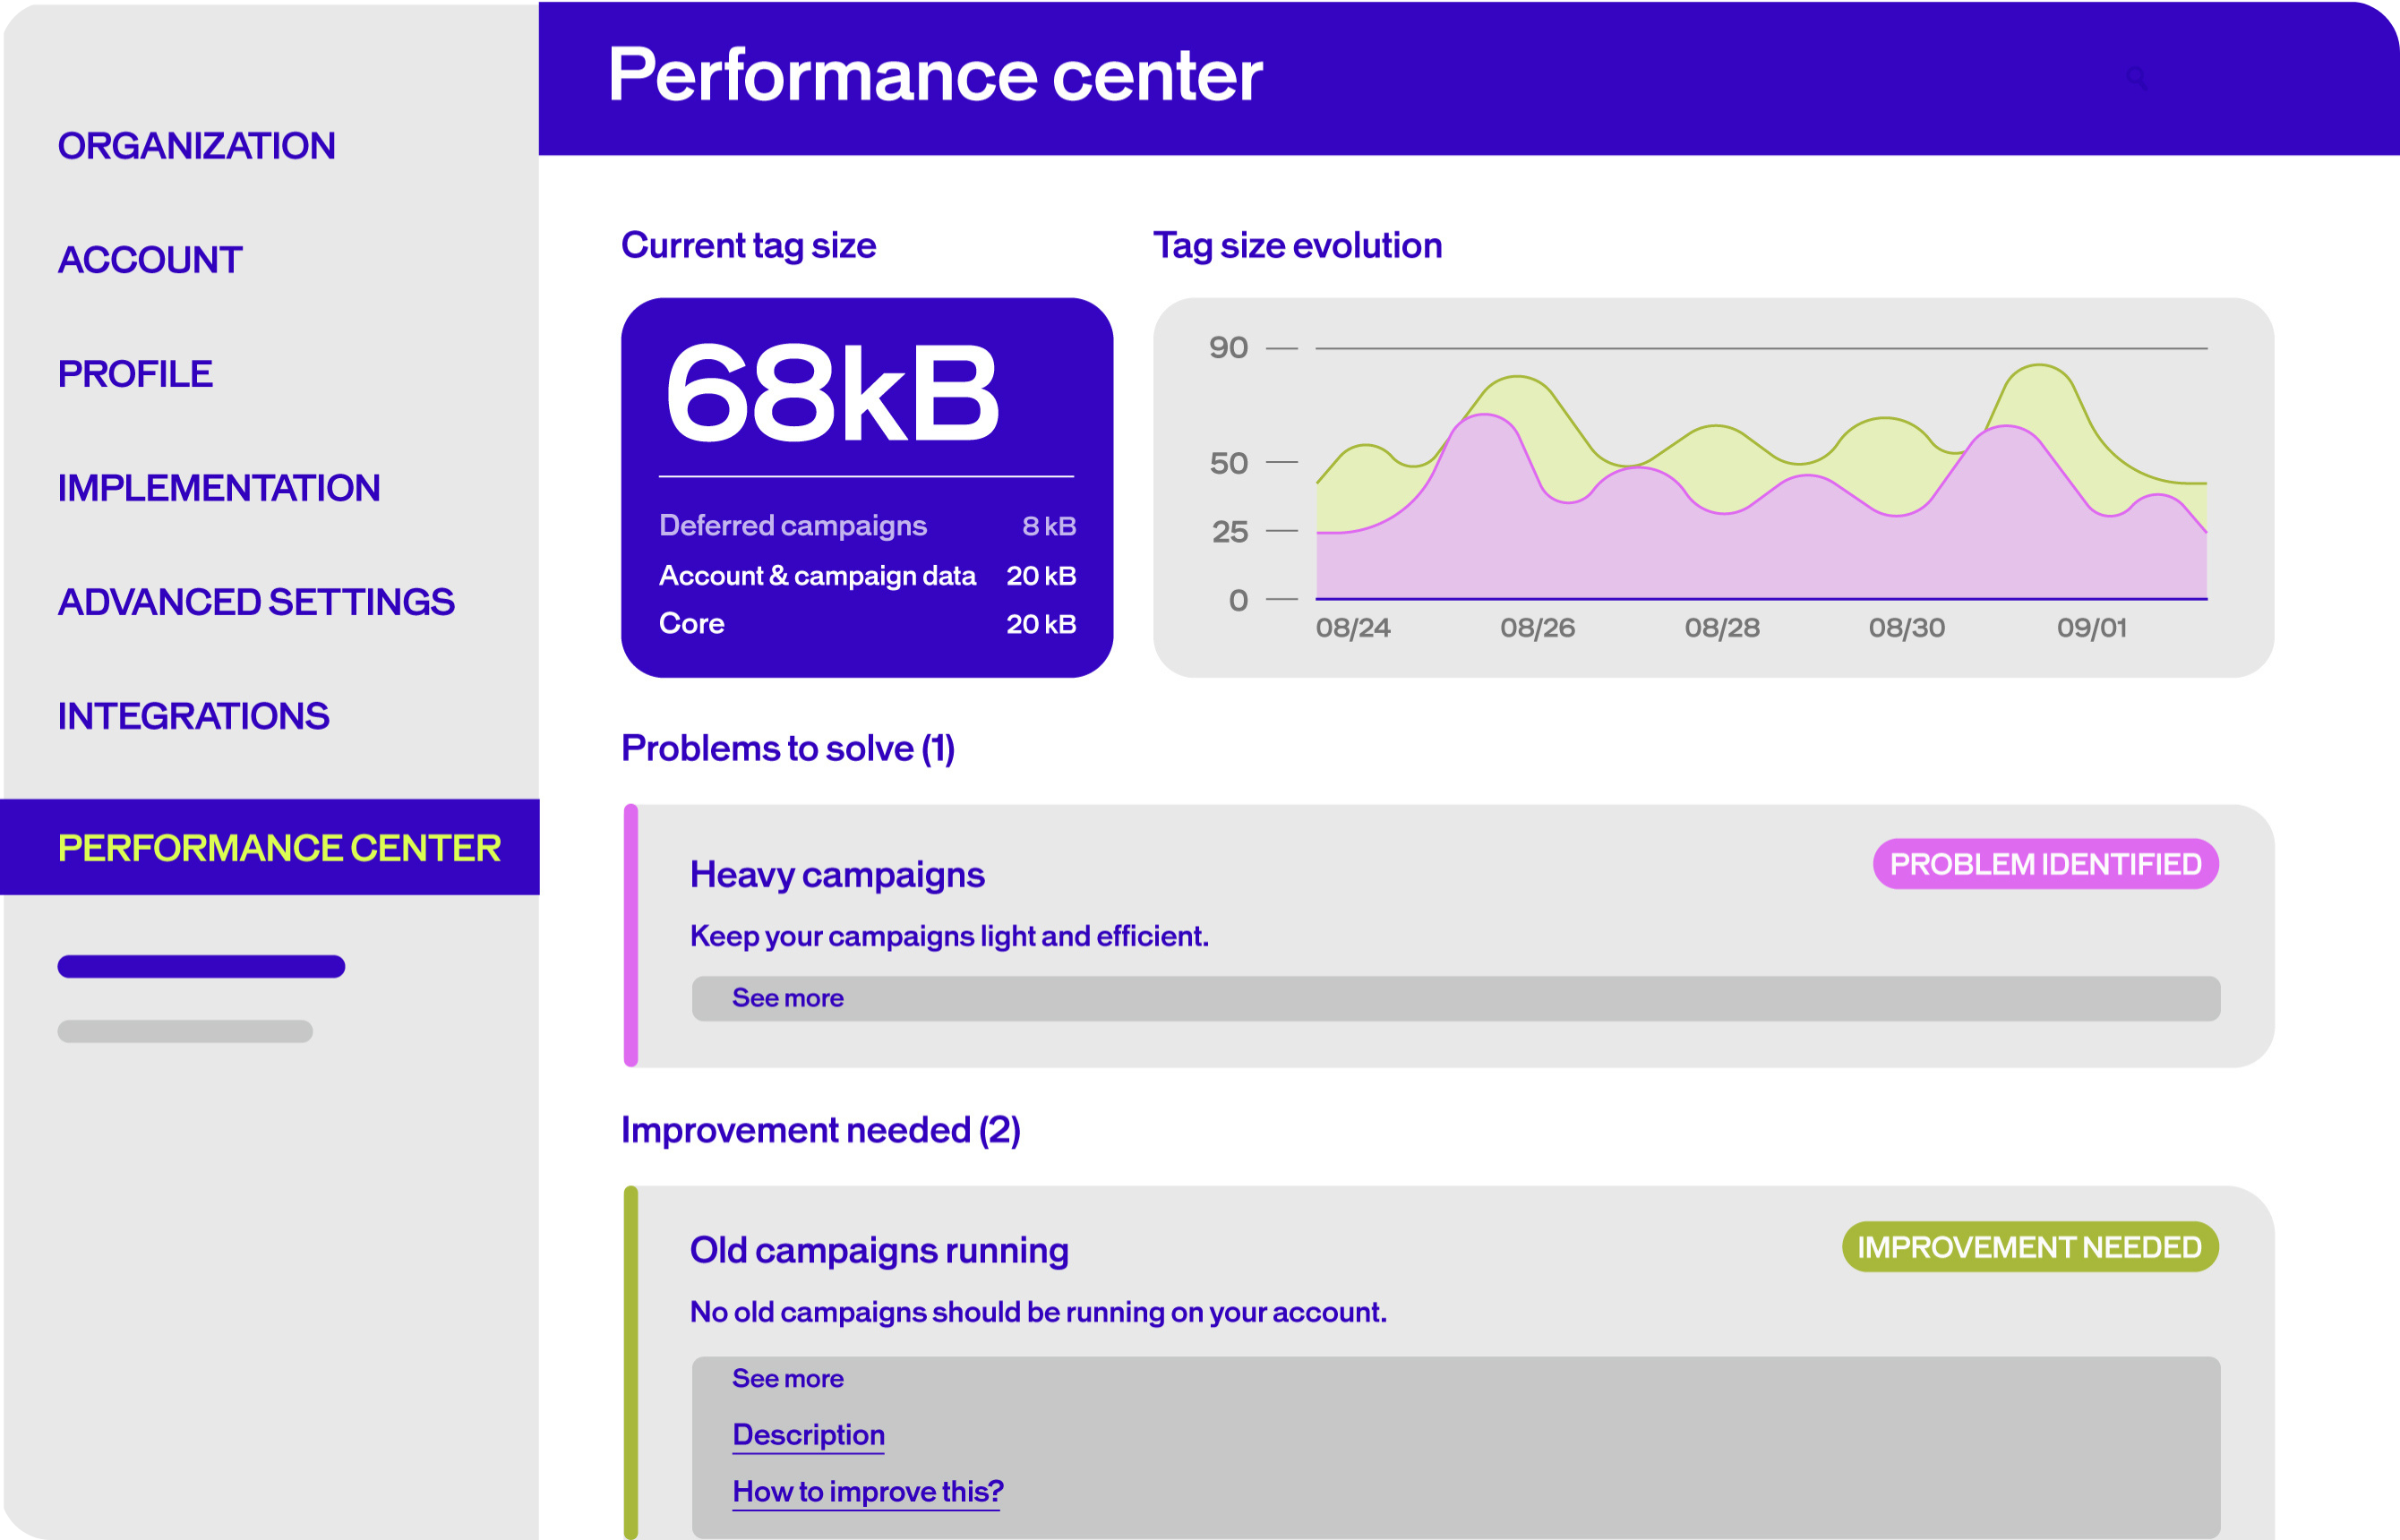
Performance Center AB Tasty’s dedicated Performance Center allows you to monitor your campaign performance in real-time. This tool gives you full transparency into what’s happening behind the scenes, so you can make adjustments as needed to keep things running smoothly. It provides recommendations to help you monitor and improve tag weight. Learn all about it here.
Single-Page Application (SPA) Compatibility AB Tasty’s platform is SPA-compatible without requiring custom code, making it easier for developers to integrate AB Tasty into their tech stack. AB Tasty is running on a native Vanilla TypeScript framework. Our tag is compatible with modern JS frameworks, including React, Angular, Vue, Meteor or Ember. The tag is unique for all environments and doesn’t require any additional implementation. Many of our customers have left their previous provider due to challenges with SPA pages. In these tools, changes are often not “sticky” or flicker when there is a dynamic content load. SPA tests in these environments often require custom code for each test, which makes testing more complicated and less user-friendly.
Flicker-Free Experiences AB Tasty’s tag uses a blended approach of both synchronous and asynchronous scripts to eliminate flicker, while maintaining optimised performance. Other solutions will prescribe “anti-flicker” snippets to eliminate flicker, which is not a recommended practice. It means hiding the body’s content while the tag loads, which ultimately delays the rendering of the site. This causes a worse user experience, increases your Largest Contentful Paint (LCP) metric, and may ultimately lead to increased bounce rates and decreased conversions. In contrast, AB Tasty’s synchronous tag uses 3kb of render-blocking to allow the tag to execute quickly before the page loads, as opposed to blocking the visibility of the page for the full package size.
And that translates to…
First loading time < 100ms Caching loading time < 10ms Execution time < 500 milliseconds Minimal Lighthouse Core Web Vitals impact
Cheers to Our Product and Tech Teams
This wouldn’t be possible without the dedication of our Product and Tech teams (thanks team!). We’ve dared to innovate, pushing the limits of what’s possible with web performance in the experimentation and personalization space.
The Bottom Line
When brands choose AB Tasty, they’re choosing a platform that prioritizes both innovation and performance. By minimizing impact on web performance, we’re helping brands deliver faster, better experiences that delight customers and drive results.
Curious to learn more about? Contact us today to discover what else sets us apart.
Building a culture of experimentation requires an appetite for iteration, a fearless approach to failure and a test-and-learn mindset. The 1000 Experiments Club podcast digs into all of that and more with some of the most influential voices in the industry.
From CEOs and Founders to CRO Managers and more, these experts share the lessons they’ve learned throughout their careers in experimentation at top tech companies and insights on where the optimization industry is heading.
Whether you’re an A/B testing novice or a seasoned pro, here are some of our favorite influencers in CRO and experimentation that you should follow:
Ronny Kohavi
Ronny Kohavi, a pioneer in the field of experimentation, brings over three decades of experience in machine learning, controlled experiments, AI, and personalization.
He was a Vice President and Technical Fellow at Airbnb. Prior to that, he was Technical Fellow and Corporate Vice President at Microsoft, where he led the analysis and experimentation team (ExP). Before that, he was Director of Personalization and Data Mining at Amazon.
Ronny teaches an online interactive course on Accelerating Innovation with A/B Testing, which was attended by over 800 students
Ronny’s work has helped lay the foundation for modern online experimentation, influencing how some of the world’s biggest companies approach testing and decision-making.
He advocates for a gradual rollout approach over the typical 50/50 split at launch:
“One thing that turns out to be really useful is to start with a small ramp-up. Even if you plan to go to 50% control and 50% treatment, start at 2%. If something egregious happens—like a metric dropping by 10% instead of the 0.5% you’re monitoring for—you can detect it in near real time.”
This slow ramp-up helps teams catch critical issues early and protect user experience.
Talia Wolf is a conversion optimization specialist and founder & CEO of Getuplift, where she helps businesses boost revenue, leads, engagement, and sales through emotional targeting, persuasive design, and behavioral data.
She began her career at a social media agency, where she was introduced to CRO, then served as Marketing Director at monday.com before launching her first agency, Conversioner, in 2013.
Talia teaches companies to optimize their online presence using emotionally-driven strategies. She emphasizes that copy and visuals should address customers’ needs rather than focusing solely on the product.
For Talia, emotional marketing is inherently customer-centric and research-based. From there, experiments can be built into A/B testing platforms using a clear North Star metric—whether checkouts, sign-ups, or add-to-carts—to validate hypotheses and drive growth.
Elissa Quinby is the Head of Product Marketing at e-commerce acceleration platform Pattern, with a career rooted in retail, marketing, and customer experience.
Before joining Pattern, she led retail marketing as Senior Director at Quantum Metric. She began her career as an Assistant Buyer at American Eagle Outfitters, then spent two years at Google as a Digital Marketing Strategist. Elissa went on to spend eight years at Amazon, holding roles across marketing, program management, and product.
Elissa emphasizes the importance of starting small to build trust with new customers. “The goal is to offer value in exchange for data,” she explains, pointing to first-party data as the “secret sauce” behind many successful companies.
She encourages brands to experiment with creative ways of gathering customer information—always with trust at the center—so they can personalize experiences and deepen customer understanding over time.
Lukas Vermeer, Director of Experimentation at Vista, is an expert in designing, implementing, and scaling experimentation programs. He previously spent over eight years at Booking.com, where he held roles as a product manager, data scientist, and ultimately Director of Experimentation.
With a background in machine learning and AI, Lukas specializes in building the infrastructure and processes needed to scale testing and drive business growth. He also consults with companies to help them launch and accelerate their experimentation efforts.
Given today’s fast-changing environment, Lukas believes that roadmaps should be treated as flexible guides rather than rigid plans: “I think roadmaps aren’t necessarily bad, but they should acknowledge the fact that there is uncertainty. The deliverable should be clarifications of that uncertainty, rather than saying, ‘In two months, we’ll deliver feature XYZ.’”
Instead of promising final outcomes, Lukas emphasizes embracing uncertainty to make better, data-informed decisions.
Jonny Longden is the Chief Growth Officer at Speero, with over 17 years of experience improving websites through data and experimentation. He previously held senior roles at Boohoo Group, Journey Further, Sky, and Visa, where he led teams across experimentation, analytics, and digital product.
Jonny believes that smaller companies and startups—especially in their early, exploratory stages—stand to benefit the most from experimentation. Without testing, he argues, most ideas are unlikely to succeed.
“Without experimentation, your ideas are probably not going to work,” Jonny says. “The things that seem obvious often don’t deliver results, and the ideas that seem unlikely or even a bit silly can sometimes have the biggest impact.”
For Jonny, experimentation isn’t just a tactic—it’s the only reliable way to uncover what truly works and drive meaningful, data-backed progress.
Ruben de Boer is a Lead CRO Manager at Online Dialogue and founder of Conversion Ideas, with over 14 years of experience in data and optimization.
At Online Dialogue, he leads the team of Conversion Managers—developing skills, maintaining quality, and setting strategy and goals. Through his company, Conversion Ideas, Ruben helps people launch their careers in CRO and experimentation by offering accessible, high-quality courses and resources.
Ruben believes experimentation shouldn’t be judged solely by outcomes. “Roughly 25% of A/B tests result in a winner, meaning 75% of what’s built doesn’t get released—and that can feel like failure if you’re only focused on output,” he explains.
Instead, he urges teams to shift their focus to customer-centric insights. When the goal becomes understanding the user—not just releasing features—the entire purpose of experimentation evolves.
David Mannheim is a digital experience strategist with over 15 years of expertise helping brands like ASOS, Sports Direct, and Boots elevate their conversion strategies.
He is the CEO and founder of Made With Intent, focused on advancing innovative approaches to personalization through AI. Previously, he founded User Conversion, which became one of the UK’s largest independent CRO consultancies.
David recently authored a book exploring what he calls the missing element in modern personalization: the person. “Remember the first three syllables of personalization,” he says. “That often gets lost in data.”
He advocates for shifting focus from short-term gains to long-term customer value—emphasizing metrics like satisfaction, loyalty, and lifetime value over volume-based wins.
“More quality than quantity,” David explains, “and more recognition of the intangibles—not just the tangibles—puts brands in a much better place.”
Marianne Stjernvall has over a decade of experience in CRO and experimentation, having executed more than 500 A/B tests and helped over 30 organizations grow their testing programs.
Marianne is the founder of Queen of CRO and co-founder of ConversionHub, Sweden’s most senior CRO agency. As an established CRO consultant, she helps organizations build experimentation-led cultures grounded in data and continuous learning.
Marianne also teaches regularly, sharing her expertise on the full spectrum of CRO, A/B testing, and experimentation execution.
She stresses the importance of a centralized testing approach:
“If each department runs experiments in isolation, you risk making decisions based on three different data sets, since teams will be analyzing different types of data. Having clear ownership and a unified framework ensures the organization works cohesively with tests.”
Ben Labay is the CEO of Speero, blending academic rigor in statistics with deep expertise in customer experience and UX.
Holding degrees in Evolutionary Behavior and Conservation Research Science, Ben began his career as a staff researcher at the University of Texas, specializing in data modeling and research.
This foundation informs his work at Speero, where he helps organizations leverage customer data to make better decisions.
Ben emphasizes that insights should lead to action and reveal meaningful patterns. “Every agency and in-house team collects data and tests based on insights, but you can’t stop there.”
Passionate about advancing experimentation, Ben focuses on developing new models, applying game theory, and embracing bold innovation to uncover bigger, disruptive insights.
André Morys, CEO and founder of konversionsKRAFT, has nearly three decades of experience in experimentation, digital growth, and e-commerce optimization.
Fueled by a deep fascination with user and customer experience, André guides clients through the experimentation process using a blend of data, behavioral economics, consumer psychology, and qualitative research.
He believes the most valuable insights lie beneath the surface. “Most people underestimate the value of experimentation because of the factors that are hard to measure,” André explains.
“You cannot measure the influence of experimentation on your company’s culture, yet that impact may be ten times more important than the immediate uplift you create.”
This philosophy is central to his “digital experimentation framework,” which features his signature “Iceberg Model” to capture both measurable and intangible effects of testing.
Jeremy Epperson is the founder of Thetamark and has dedicated 14 years to conversion rate optimization and startup growth. He has worked with some of the fastest-growing unicorn startups in the world, researching, building, and implementing CRO programs for more than 150 growth-stage companies.
By gathering insights from diverse businesses, Jeremy has developed a data-driven approach to identify testing roadblocks, allowing him to optimize CRO processes and avoid the steep learning curves often associated with new launches.
In his interview, Jeremy emphasizes focusing on customer experience to drive growth. He explains, “We will do better as a business when we give the customer a better experience, make their life easier, simplify conversion, and eliminate the roadblocks that frustrate them and cause abandonment.”
His ultimate goal with experimentation is to create a seamless process from start to finish.
Chad Sanderson is the CEO and founder of Gable, a B2B data infrastructure SaaS company, and a renowned expert in digital experimentation and large-scale analysis.
He is also a product manager, public speaker, and writer who has lectured on topics such as the statistics of digital experimentation, advanced analysis techniques, and small-scale testing for small businesses.
Chad previously served as Senior Program Manager for Microsoft’s AI platform and was the Personalization Manager for Subway’s experimentation team.
He advises distinguishing between front-end (client-side) and back-end metrics before running experiments. Client-side metrics, such as revenue per transaction, are easier to track but may narrow focus to revenue growth alone.
“One set of metrics businesses mess up is relying only on client-side metrics like revenue per purchase,” Chad explains. “While revenue is important, focusing solely on it can drive decisions that overlook the overall impact of a feature.”
With a background in Global Business Management and Marketing, Computer Science, and Industrial Engineering, Carlos founded Floqq—Latin America’s largest online education marketplace.
In 2014, he founded Product School, now the global leader in Product Management training.
Carlos believes experimentation has become more accessible and essential for product managers. “You no longer need a background in data science or engineering to be effective,” he says.
He views product managers as central figures at the intersection of business, design, engineering, customer success, data, and sales. Success in this role requires skills in experimentation, roadmapping, data analysis, and prototyping—making experimentation a core competency in today’s product landscape.
Bhavik Patel is the Data Director at Huel, an AB Tasty customer, and the founder of CRAP Talks, a meetup series connecting CRO professionals across Conversion Rate, Analytics, and Product.
Previously, he served as Product Analytics & Experimentation Director at Lean Convert, where he led testing and optimization strategies for top brands. With deep expertise in personalization, experimentation, and data-driven decision-making, Bhavik helps teams evolve from basic A/B testing to strategic, high-impact programs.
With a focus on experimentation, personalization, and data-driven strategy, Bhavik leads teams in creating better digital experiences and smarter testing programs.
His philosophy centers on disruptive testing—bold experiments aimed at breaking past local maximums to deliver statistically meaningful results. “Once you’ve nailed the fundamentals, it’s time to make bigger bets,” he says.
Bhavik also stresses the importance of identifying the right problem before jumping to solutions: “The best solution for the wrong problem isn’t going to have any impact.”
Rand Fishkin is the co-founder and CEO of SparkToro, creators of audience research software designed to make audience insights accessible to all.
He also founded Moz and co-founded Inbound.org with Dharmesh Shah, which was later acquired by HubSpot in 2014. Rand is a frequent global keynote speaker on marketing and entrepreneurship, dedicated to helping people improve their marketing efforts.
Rand highlights the untapped potential in niche markets: “Many founders don’t consider the power of serving a small, focused group of people—maybe only a few thousand—who truly need their product. If you make it for them, they’ll love it. There’s tremendous opportunity there.”
A strong advocate for risk-taking and experimentation, Rand encourages marketers to identify where their audiences are and engage them directly there.
Shiva Manjunath is the Senior Web Product Manager of CRO at Motive and host of the podcast From A to B. With experience at companies like Gartner, Norwegian Cruise Line, and Edible, he’s spent years digging into user behavior and driving real results through experimentation.
Shiva is known for challenging the myth of “best practices,” emphasizing that optimization requires context, not checklists. “If what you believe is this best practice checklist nonsense, all CRO is just a checklist of tasks to do on your site. And that’s so incorrect,” he says.
At Gartner, a simplified form (typically seen as a CRO win) led to a drop in conversions, reinforcing his belief that true experimentation is about understanding why users act, not just what they do.
Through his work and podcast, Shiva aims to demystify CRO and encourage practitioners to think deeper, test smarter, and never stop asking questions.
Running hundreds of experiments each year is a sign of a mature, data-driven organization – but it also comes with challenges.
How do you ensure that every test is running smoothly, and that critical issues don’t slip through the cracks?
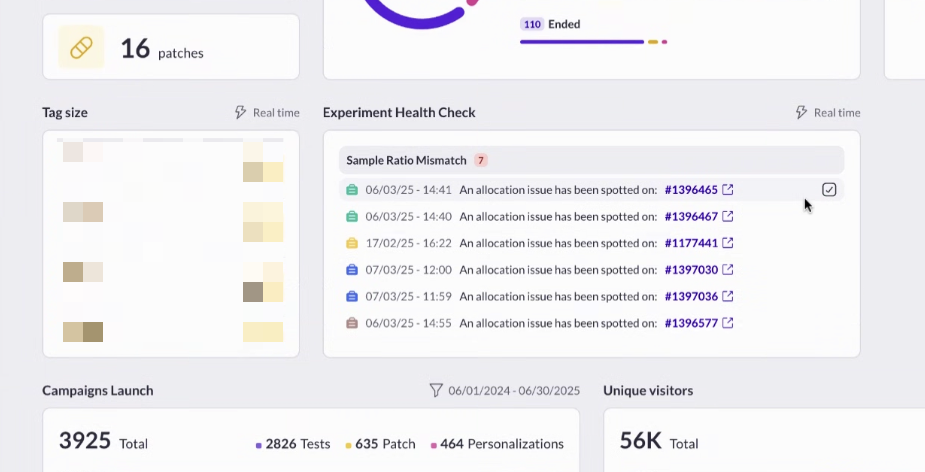
At AB Tasty, we’ve listened to our clients’ pain points and are excited to announce the launch of Experiment Health Check: a new feature designed to make experimentation safer, smarter, and more efficient.
The Challenge: Keeping Experiments Healthy at Scale
For leading brands running over 100 campaigns a year, experimentation is at the heart of digital optimization.
But with so many campaigns running simultaneously, manually checking reports every day to spot issues is time-consuming and inefficient. Worse, problems like underperforming variations or sample ratio mismatches (SRM) can go unnoticed, leading to lost revenue or inconclusive results.
Our Solution: Experiment Health Check
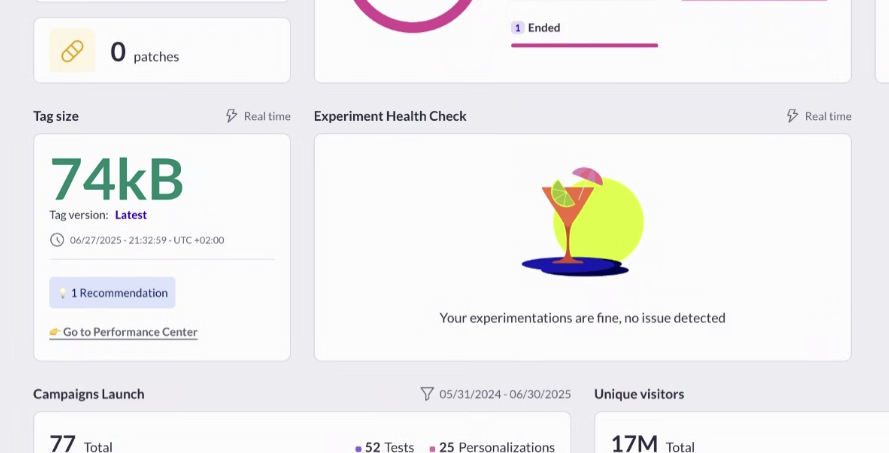
Experiment Health Check is an automated monitoring system built directly into AB Tasty. It proactively alerts you to issues in your experiments, so you can act fast and keep your testing program on track.
Key Features:
Automated Alerts: Get notified in-product (and by email, if you choose) when an experiment encounters a critical issue, such as:
Centralized Dashboard: Super-admins can view all alerts across accounts for a global overview.
Customizable Notifications: Choose which alerts to display and how you want to receive them.
Why It Matters
Proactive, Not Reactive: No more waiting until the end of a test or sifting through reports to find problems. Experiment Health Check surfaces issues as soon as they’re detected.
Saves Time: Focus on insights and strategy, not manual monitoring.
Peace of Mind: Most clients will rarely see alerts – only about 2% of campaigns encounter SRM issues – so you can be confident your experiments are running smoothly.
What’s Next?
Experiment Health Check is available to all AB Tasty clients as of June 2025.
Simply activate it in your dashboard to start benefiting from automated experiment monitoring. We’re committed to evolving this feature with more alert types and integrations based on your feedback.
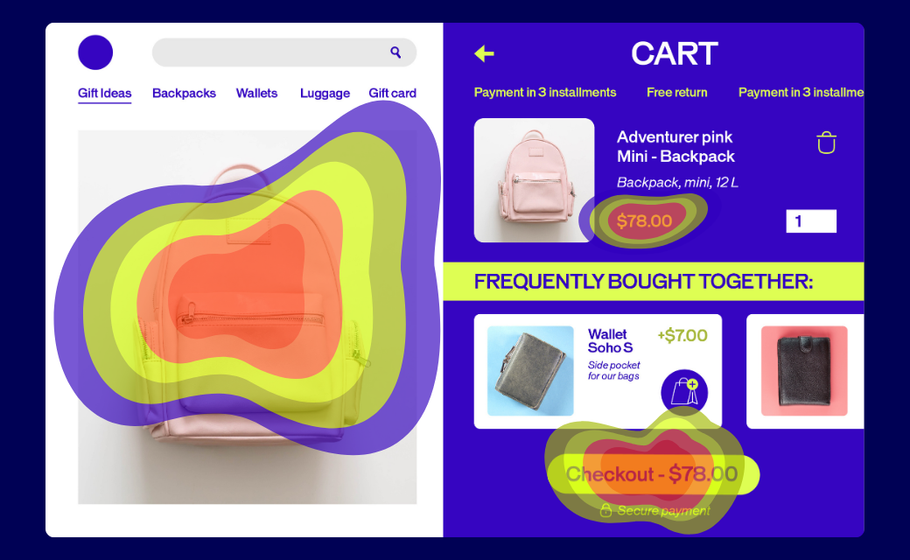
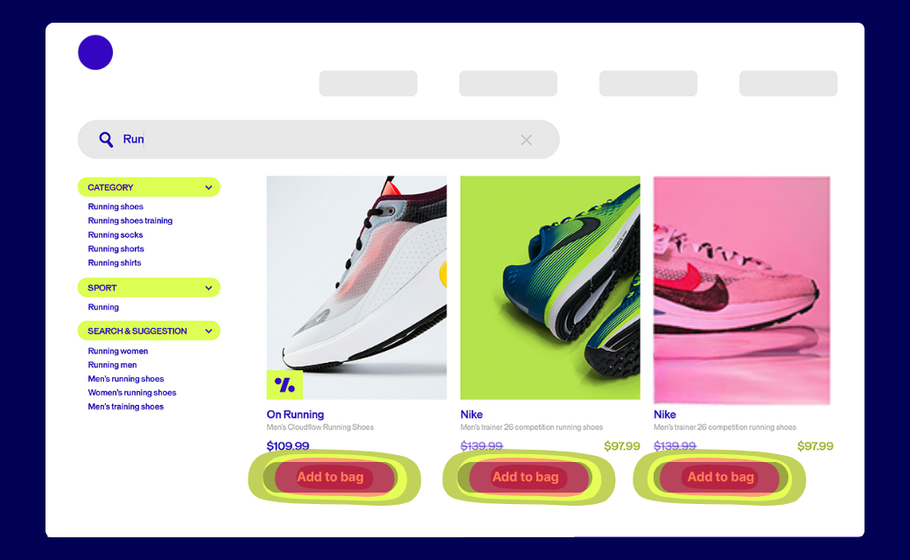
Think of heatmaps as your website’s truth-teller. They’re visual snapshots showing exactly where visitors click, scroll, and linger. No guesswork required.
Here’s how they work: Warm colors (reds, oranges) highlight the hotspots where users engage most. Cool colors (blues, greens) reveal the overlooked zones that might need attention.
The best part? Your visitors do all the heavy lifting. They show you what’s working and what’s not, so your team can make changes that actually move the needle.
Spot the signals: When to bring heatmaps into play
Heatmaps aren’t just pretty pictures—they’re your optimization toolkit’s MVP. Here’s how they deliver the biggest impact:
Measuring real engagement
Writing content that no one reads? Heatmaps show you exactly where readers drop off. If only 10% of visitors reach your CTA, it’s time to shake things up.
Tracking what matters: Actions
Are people clicking where you want them to? Heatmaps reveal if visitors complete your desired actions—or where they’re getting stuck instead.
Highlighting where attention sticks (and slips)
What grabs your attention first? What images distract from your main message? Heatmaps answer these questions so you can double down on what works.
Once you have these insights, bigger questions become easier to tackle:
Where should we place our most important content?
How can we use images and videos more effectively?
What’s pulling attention away from our goals?
The essential heatmap lineup every team needs
Most modern heatmap tools offer multiple views of user behavior. We partner closely with some of the major players already. Let’s break down the most common ones you’ll come across.
Click Heatmaps: The Action Tracker
These maps show every click on your page, with dense concentrations appearing as bright white areas surrounded by warm colors. Think of them as your conversion reality check.
What it tells you: Whether people click where you want them to—or if they’re trying to click non-clickable elements that look interactive.
How to use it: Look for clicks scattered around non-interactive text or images. These “frustrated clicks” signal design problems. If users are clicking on underlined text that isn’t a link, or images they expect to be clickable, you need to either make those elements functional or redesign them to look less interactive.
Pro tip: Compare click density on your primary CTA versus other page elements. If secondary elements are getting more clicks than your main conversion button, it’s time to redesign your visual hierarchy.
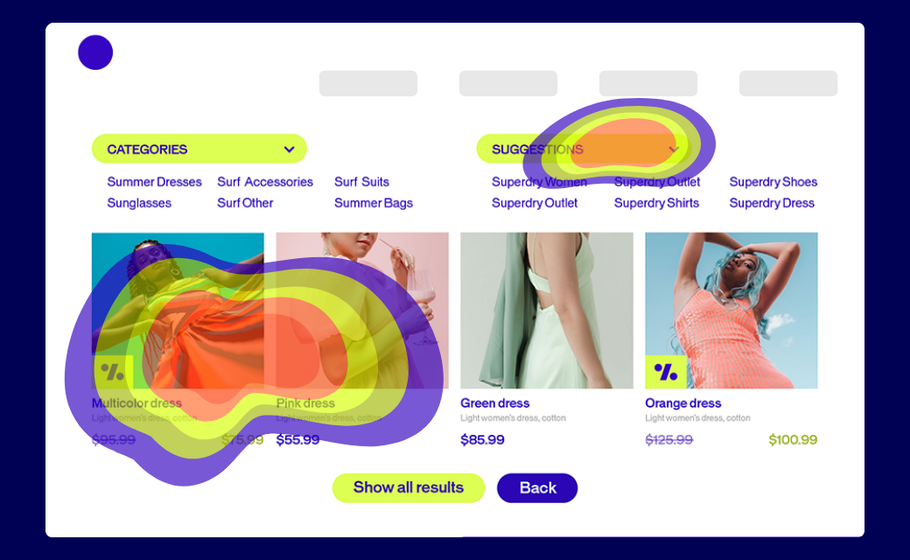
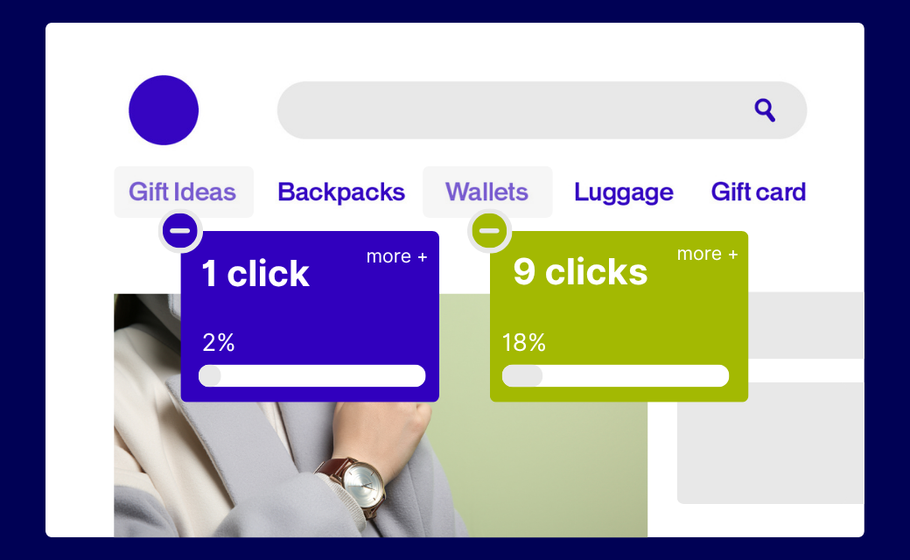
Scroll Heatmaps: The Attention Meter
See how far down visitors scroll and what percentage of users reach each section of your page. This is crucial for understanding whether your important content is actually being seen.
What it tells you: If users actually see your important content or bail before reaching your CTA. Most importantly, it shows you the “fold line”—where 50% of users stop scrolling.
How to use it: Identify the scroll percentage where you lose half your audience, then ensure all critical elements (value propositions, CTAs, key benefits) appear above that line. If your main CTA is only seen by 20% of visitors, move it higher or add secondary CTAs above the fold.
Pro tip: Use scroll maps to optimize content length. If 80% of users stop reading halfway through your blog post, either shorten the content or add more engaging elements (images, subheadings, interactive elements) to keep them scrolling.
Click Percentage Maps: The Element Analyzer
This view breaks down clicks by specific elements, showing exactly how many people clicked each button, image, or link as a percentage of total visitors.
What it tells you: Which elements deserve prime real estate and which ones are dead weight. You’ll see precise engagement rates for every clickable element on your page.
How to use it: Rank your page elements by click percentage to understand what’s actually driving engagement. If your newsletter signup gets 15% clicks but your main product CTA only gets 3%, you might need to redesign your primary call-to-action or reconsider your page goals.
Pro tip: Use this data to inform A/B tests. If one button consistently outperforms others, test applying its design (color, size, copy) to underperforming elements.
Confetti Maps: The Individual Click Tracker
Instead of showing click density, these maps display each individual click as a colored dot. Perfect for spotting users trying to click non-clickable areas or understanding click patterns in detail.
What it tells you: Where to add functionality or remove confusion. Each dot represents a real user’s intent to interact with something on your page.
How to use it: Look for clusters of dots over non-interactive elements—these represent frustrated users trying to click things that don’t work. Also watch for dots scattered far from any actual buttons or links, which might indicate responsive design issues or accidental clicks.
Pro tip: Filter confetti maps by traffic source or user segment. Mobile users might have different click patterns than desktop users, and organic traffic might behave differently than paid traffic.
Mobile-Specific Heatmaps: The Touch Tracker
Modern tools capture mobile-specific actions like taps, swipes, pinches, and multi-touch gestures—because mobile behavior is fundamentally different from desktop.
How to use it: Create separate heatmaps for mobile and desktop traffic. Mobile users typically scroll faster, have shorter attention spans, and interact differently with buttons and forms. Use this data to optimize button sizes, reduce form fields, and adjust content layout for mobile-first experiences.
Pro tip: Pay special attention to thumb-reach zones on mobile heatmaps. Elements that are easy to tap with a thumb (bottom third of screen, right side for right-handed users) typically get higher engagement rates.
Learn more about best practices for designing for mobile experiences with our Mobile Optimization Guide.
Eyes vs. clicks: Understanding the key differences
While heatmaps track mouse movements and clicks, eye-tracking follows actual gaze patterns. Eye-tracking gives deeper insights but requires specialized equipment most teams don’t have.
The good news? AI-powered tools like Feng-Gui and EyeQuant now simulate eye-tracking through algorithms, making this technology more accessible.
Bottom line: Start with heatmaps. They’re easier to implement and give you actionable insights right away.
Features that make or break your heatmapping game
Not all heatmap tools are created equal. Here’s what your team should prioritize:
Must-have features:
Audience Segmentation: Create maps for specific user groups (new vs. returning visitors, mobile vs. desktop)
Map Comparison: Easily compare results across different segments
Page Templates: Aggregate data for similar page types (crucial for e-commerce sites)
Mobile Optimization: Track touch, scroll, and swipe behaviors
Export Capabilities: Share results with your team effortlessly
Dynamic Element Tracking: Capture interactions with dropdowns, sliders, and AJAX-loaded content
Historical Data: Preserve old heatmaps even after design changes
Test smarter with heatmap insights
Here’s where things get exciting. Heatmaps show you the problems, but how do you know if your fixes actually work?
Enter A/B testing.
This three-step approach turns insights into results:
Identify problems with heatmaps
Test potential solutions with A/B testing
Choose the highest-performing solution based on data
Real Example:
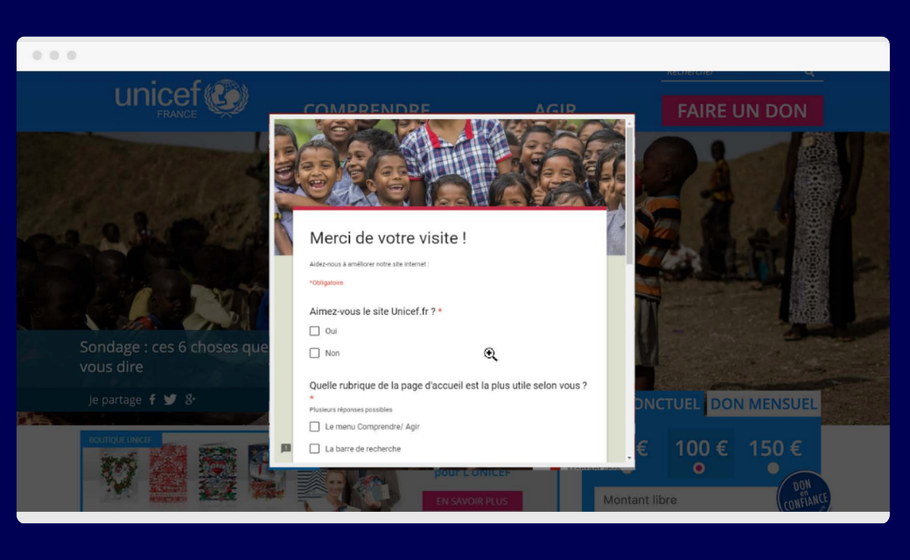
Nonprofit UNICEF France wanted to better understand how visitors perceived its homepage ahead of a major redesign.
Their move: UNICEF France combined on-site surveys with heatmapping to gather both qualitative feedback and visual behavioral data.
The result: Heatmaps showed strong engagement with the search bar, while surveys confirmed it was seen as the most useful element. Less-used features, like social share icons, were removed in the redesign—resulting in a cleaner, more user-focused homepage.
Ready to put heatmaps to work? Here’s your game plan:
Start small. Pick one high-traffic page and run your first heatmap analysis.
Look for patterns. Are users clicking where you expect? Scrolling to your key content? Getting stuck somewhere?
Test your hunches. Use A/B testing to validate any changes before rolling them out site-wide.
Iterate forward. Heatmaps aren’t a one-and-done tool but part of your ongoing optimization process.
Remember: every click tells a story. Every scroll reveals intent. Your visitors are already showing you how to improve—you just need to listen.
Ready to see what your visitors are really doing? Heatmaps give you the insights. A/B testing helps you act on them. Together, they’re your path to better conversions and happier users.
What if you could describe your vision and watch it come to life? What if understanding your visitors’ emotions was as simple as a 30-second scan? What if your reports could tell you not just what happened, but why it mattered?
That’s where AI steps in – not to replace your creativity, but to amplify it.
At AB Tasty, we’ve built AI tools that work the way teams actually think: curious, collaborative, and always moving forward. Here are nine features that help you test bolder, learn faster, and connect deeper with the people who matter most.
Insight: If you’re already an AB Tasty customer, you’ve already got access to some of our most popular AI features! But don’t stop scrolling yet, there’s more to discover.
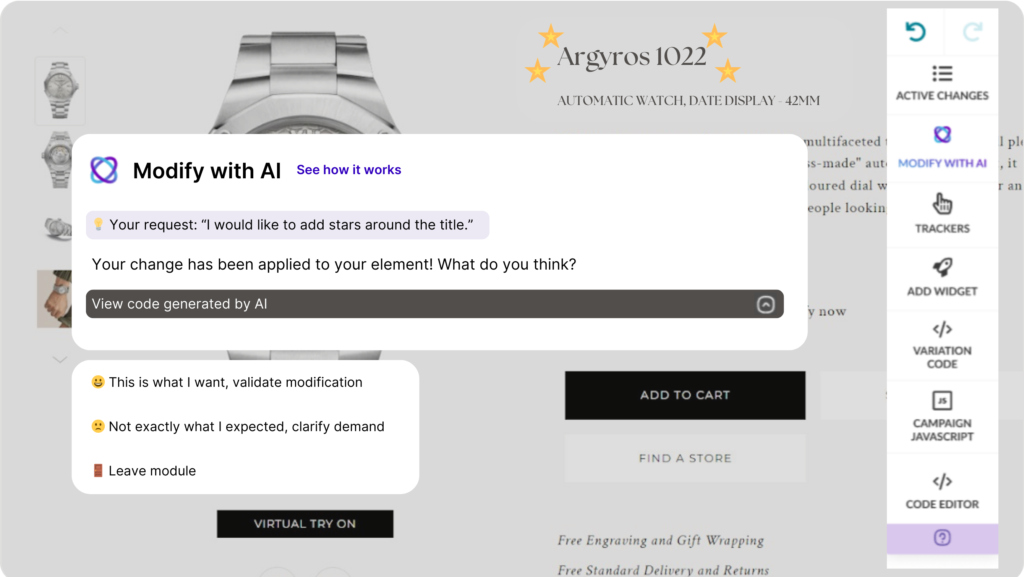
1. Visual Editor Copilot: Your vision, our AI’s creation
Visual Editor Copilot turns your ideas into reality without the endless clicking. Just describe what you want – “make that button green,” “add a fade-in animation,” or “move the CTA above the fold” – and watch our AI bring your vision to life.
No more wrestling with code or hunting through menus. Your creativity leads. Our AI follows.
EmotionsAI Insights gives you a free peek into 10 emotional profiles that reveal what your visitors actually feel. Not just what they click – what moves them.
See the missed opportunities hiding in plain sight. Understand the emotional drivers that turn browsers into buyers. It’s personalization that goes beyond demographics to tap into what people really want.
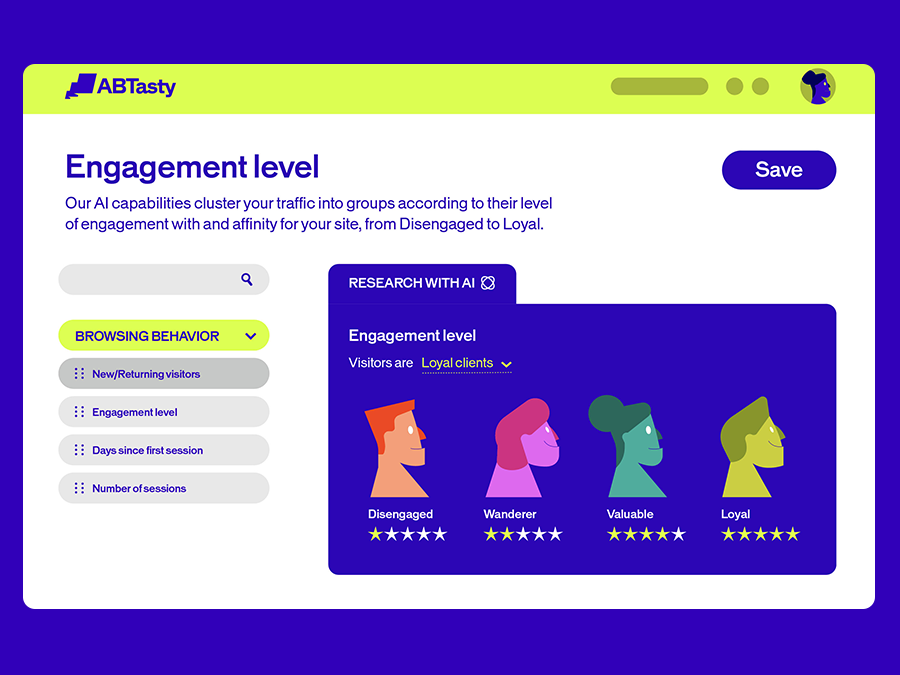
3. Engagement Levels: Segment traffic for affinity and engagement
Our engagement-level segmentation uses AI to cluster visitors based on how they connect with your site. New visitors get the welcome they deserve. Returning customers get the recognition they’ve earned.
It’s traffic segmentation that makes sense – grouping people by affinity, not just attributes.
4. EmotionsAI: The future of personalization
EmotionsAI is personalization with emotional clarity. In just 30 seconds, see what drives your visitors at a deeper level. Turn those insights into targeted audiences and data-driven sales.
Your visitors have unique needs and expectations. Now you can meet them where they are – emotionally and practically.
5. Recommendations and merchandising
Recommendations and Merchandising turns the right moment into new revenue. Our AI finds those perfect opportunities to inspire visitors – whether it’s a complementary product or an upgrade that makes sense.
You stay in control of your strategy. AI accelerates the performance. The result? A delightful experience that drives higher average order value.
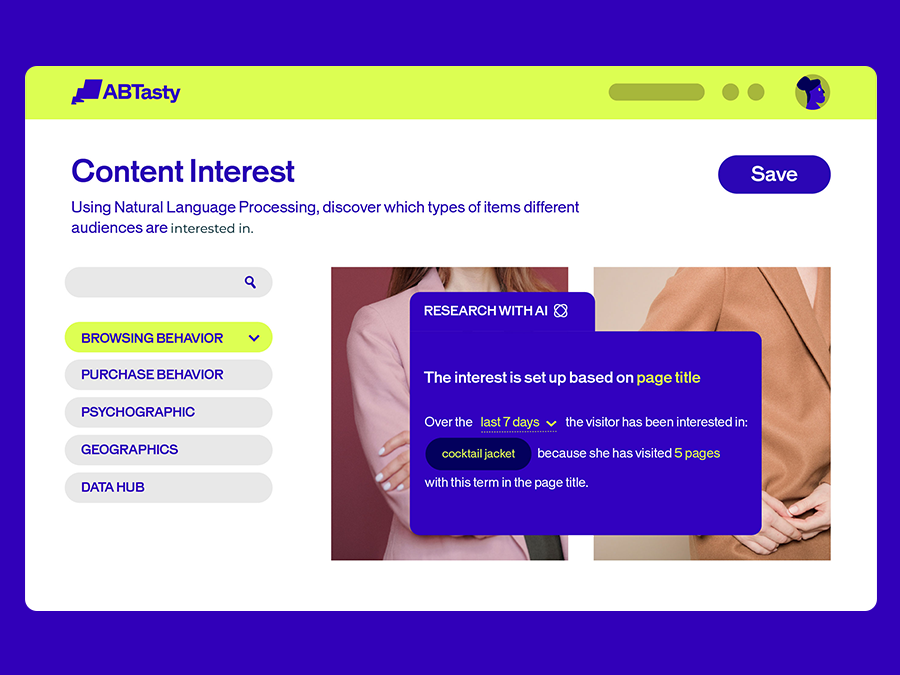
6. Content Interest: No more struggling to connect
Content engagement AI identifies common interests among your visitors based on their browsing patterns – keywords, content, products. Build experiences that feel personal because they actually are.
It’s not about pushing content. It’s about finding the connections that already exist and making them stronger.
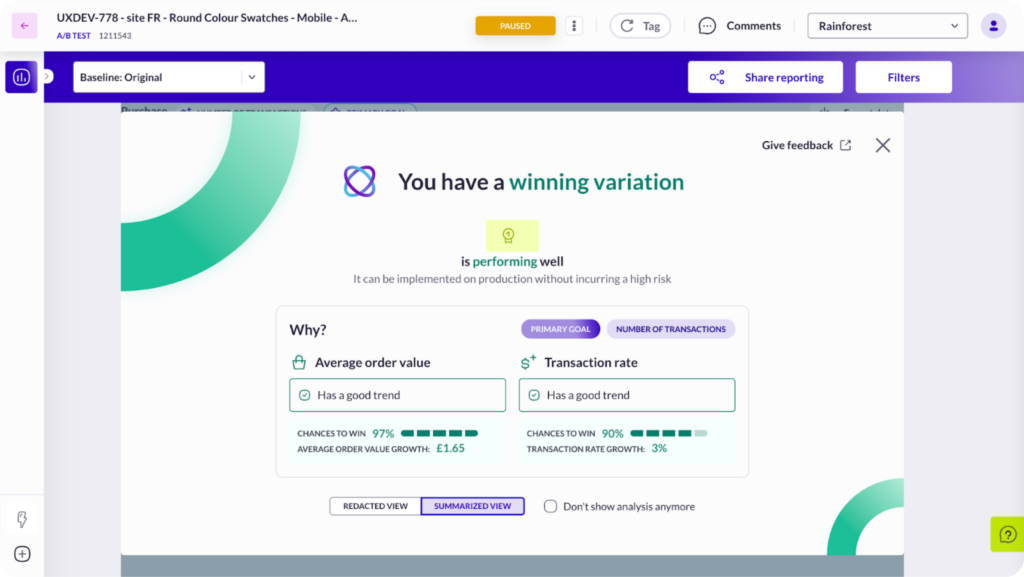
7. Report Copilot: Meet your personal assistant for reporting
Report Copilot is your personal assistant for making sense of data. It highlights winning variations and breaks down why they drove transactions – so you can feel confident in your next move.
No more staring at charts wondering what they mean. Get clear insights that move you forward.
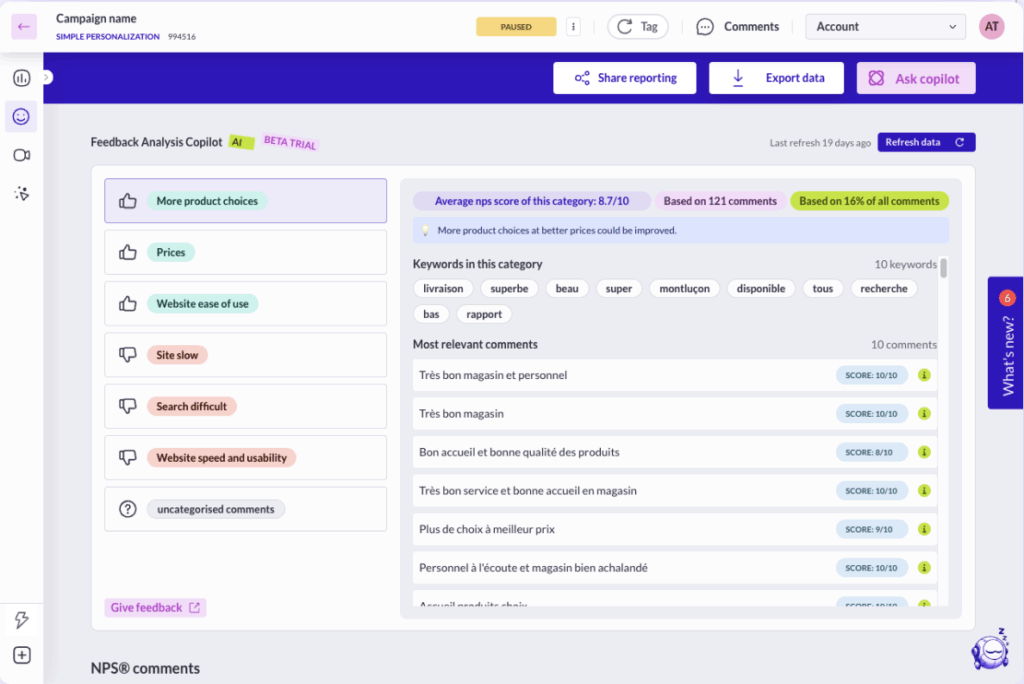
8. Drowning in feedback? Feedback Analysis Copilot saves you time
Feedback Analysis Copilot takes the heavy lifting out of NPS and CSAT campaigns. Our AI analyzes responses right within your reports, identifying key themes and sentiment trends instantly.
High volumes of feedback? No problem. Get the insights you need without the manual work that slows you down.
9. Struggling to craft the perfect hypothesis for your experiments?
Hypothesis Copilot helps you craft experiments that start strong. Clear objectives, richer insights, better structure – because every great test begins with a rock-solid hypothesis.
No more struggling with the “what if” – start testing with confidence.
AI That Amplifies Human Creativity
These aren’t just features – they’re your teammates. AI that understands how teams really work: with curiosity, collaboration, and the courage to try something new.
Every tool we build asks the same question: How can we help you go further?
Whether you’re crafting your first experiment or your thousandth, these AI features meet you where you are and help you get where you’re going. Because the best optimization happens when human insight meets intelligent tools.
Ready to see what AI-powered experimentation feels like? Let’s test something bold together.
FAQs about AI in digital experimentation
How is AI used in digital experimentation and A/B testing?
AB Tasty offers clients multiple AI features to enhance A/B testing by automating test setup, analyzing emotional responses, segmenting audiences, and generating data-driven recommendations—all aimed at faster insights and better personalization.
What are the benefits of using AI in website optimization?
AI reduces guesswork, accelerates testing, improves personalization, and turns raw data into actionable insights. It empowers teams to learn faster and create better digital experiences.
How does AI help marketing and product teams test and learn faster?
AB Tasty empowers marketing and product teams with AI tools like Report Copilot and Hypothesis Copilot to streamline data analysis and test planning, helping teams move from idea to iteration quickly and confidently.
What AI features does AB Tasty offer for experimentation and personalization?
AB Tasty offers features like Visual Editor Copilot, EmotionsAI, Content Interest segmentation, and Report Copilot to streamline testing, personalization, and reporting.
Traffic is getting more expensive and more competitive.
Organic traffic is down by 5.7%.
Paid traffic now makes up 39% of visits.
More worrying? Overall traffic is down 3.3%, even as ad spend rises by 13.2%. Consumers are migrating toward closed ecosystems like TikTok, and search engine changes are squeezing unpaid visibility.
“If someone does land on your site,” said Evan, “you can’t afford to lose them to a clunky experience.”
2. Earning Loyalty
Retention is getting tougher and more expensive:
30-day retention is down 7%
Bounce rates for returning paid traffic are rising
Brands are spending more to re-acquire the same users
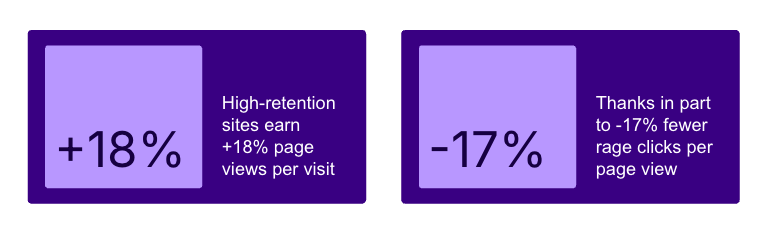
But here’s the good news: Sites with the highest retention also had:
Retention isn’t about loyalty programs anymore. It’s about immediate value:
If the first experience isn’t seamless, fast, and relevant, there might not be a second chance.
As John pointed out:
“Customers are overwhelmed. Consent banners, pop-ups, chatbots… all stacked on each other. The more you push, the more they bounce.”
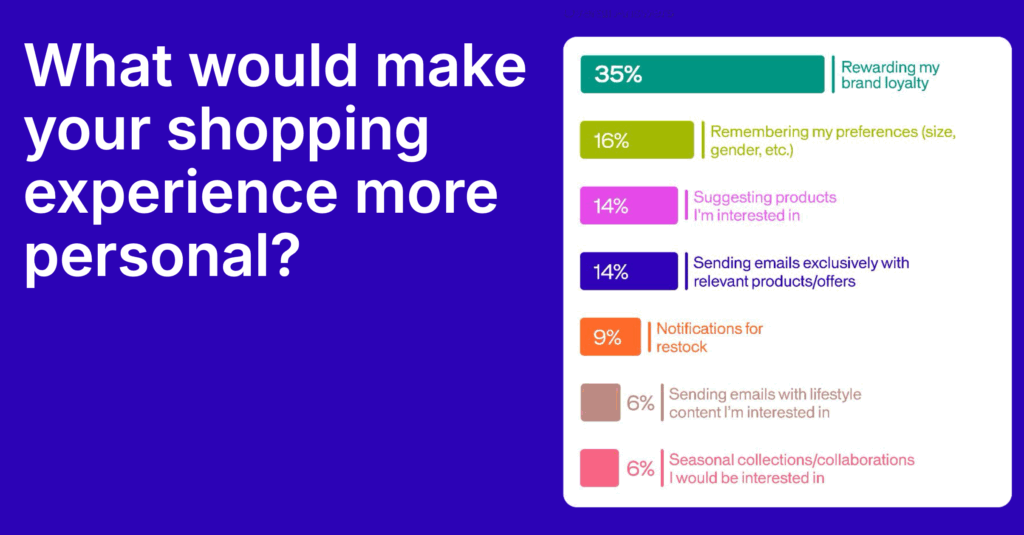
3. Personalization = Relevance
Our 2025 Consumer Trends research confirms it: Shoppers now expect relevance, not just recognition. What moves the needle?
“It’s not just about product recs. It’s about respect. Show people you’re paying attention, and they’ll come back.” – John
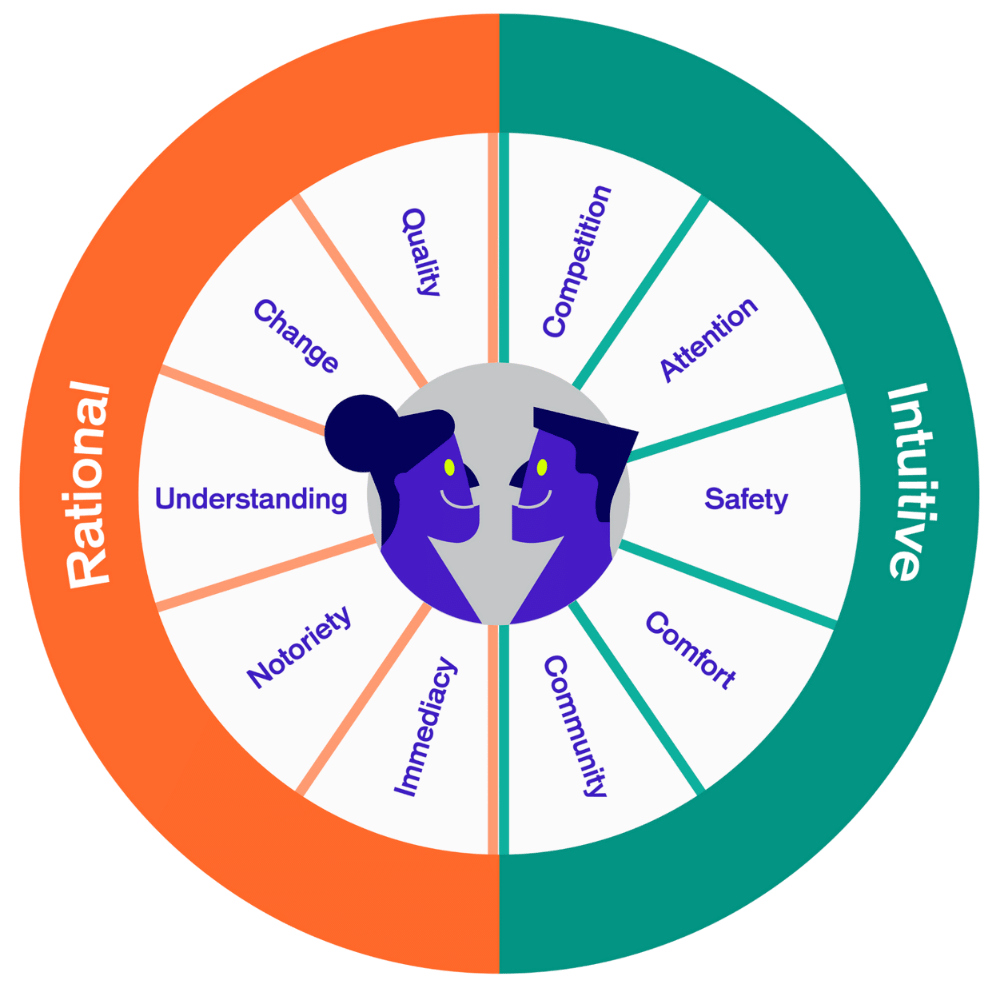
With EmotionsAI, brands can now tailor experiences based on what really motivates visitors:
Safety Seekers: need reassurance (trust signals, easy returns)
Fast-Trackers: want speed (minimal steps to checkout)
Community-Driven: respond to peer validation (“others bought this”)
Comfort Seekers: look for clarity and low friction
These insights can shape everything from PDP content to CTA language. And best of all? It’s not guesswork, it’s behavior-based.
4. Attention Is Dropping – Especially for New Visitors
Consumers are seeing less of your site, unless you’re earning their attention.
From Contentsquare:
Overall site consumption (time, scroll rate, pages viewed) is down 6.5%
Returning visitors consume 19% more pages and spend one minute longer on site than new visitors
More landing pages are nowproduct pages, not homepages
This shift reinforces something we’ve known for a while: homepages are branding, product pages are business. If you want to improve conversion, that’s where you optimize.
5. AI: The Secret Weapon to Optimize Digital Experiences
Both AB Tasty and Contentsquare are embracing AI to help marketers do more with less:
At AB Tasty:
OurAI Copilot helps teams quickly generate test ideas, reword content, promote blocks, or personalize experiences with natural language prompts.
At Contentsquare:
Chat with Sense makes it easy to explore analytics in plain English
The goal? Speed up insight, scale up experimentation, and automate repetitive tasks – without sacrificing control.
6. Experiment Often, Act Fast
The most successful teams aren’t just collecting data. They’re closing the loop:
1. Contentsquare shows what’s broken
2. AB Tasty helps you test, fix, and personalize
3. AI helps you move faster, with less effort
Whether it’s launching 1:1 recommendations, fixing high-friction journeys, or adapting content to emotional profiles, the brands that win in 2025 are those that act quickly and optimize constantly.
Key Takeaways
In 2025, optimizing digital experiences isn’t just a nice-to-have – it’s a survival strategy. With rising acquisition costs and falling attention spans, brands need to ensure every visit delivers real value. That means fixing friction fast, personalizing with emotional and behavioral insight, and using AI to move from insight to action at speed. Retention now begins with the first impression, and product pages, not homepages, are where real conversions happen.
The brands that will win are those that test often, personalize with purpose, and close the loop between data and decision-making.
This guest blog on the European Accessibility Act is written by Dr. Thomas Hein, Head of Digital Inclusion at Arc Inclusion and Head of Customer Research at REO Digital. With a background in decision-making psychology and over a decade of experience, Thomas helps organisations embed accessibility and user insight into their design systems, development workflows, and leadership practices. He’s worked across sectors including finance, retail, utilities, and healthcare, and is known for making accessibility and UX practical, evidence-based, and commercially relevant.
Arc Inclusion is a consultancy that partners with organisations to build inclusive digital products and services — combining accessibility expertise with deep design and delivery know-how.
REO Digital is a user research and service design agency that helps teams deliver digital services grounded in real user needs — ensuring they are not only usable but inclusive by design.
In this blog, Thomas shares practical guidance on navigating one of the biggest shifts in digital accessibility policy to date: the European Accessibility Act.
The countdown is on: by 28 June 2025, the European Accessibility Act (EAA) will come into full effect across the EU. For organisations offering digital products and services, it marks a decisive shift. No longer optional, accessibility will become a legal requirement for doing business in Europe. Yet for many, the specifics remain unclear — and misconceptions are rife.
1. Why the European Accessibility Act Matters — and Who Can’t Afford to Ignore It
The European Accessibility Act is an EU directive designed to harmonise accessibility requirements across member states. It covers both physical and digital goods and services — from banking apps to e-commerce platforms, transport ticketing systems to e-books — and aims to ensure that people with disabilities can use and interact with them on equal terms.
But it doesn’t stop at EU-based companies. If your business sells to EU customers, the EAA applies to you, even if you’re based in the UK or elsewhere. Whether you’re an online retailer shipping to Berlin, a banking app available in Madrid, or a ticketing platform used in Paris — the legislation counts.
Failing to comply could mean more than a slap on the wrist. Each EU country has the power to set and enforce its own penalties. That means fines can pile up — ranging from €5,000 to €500,000 depending on the market — and, in some cases, your product could be banned from sale altogether.
And if you’re trying to secure public sector contracts — or selling into other businesses as a B2B supplier or SaaS provider — forget it: non-compliance is a non-starter.
More and more organisations, not just governments, are embedding accessibility requirements into procurement processes, meaning your product won’t even make it onto the shortlist without meeting the EAA.
2. Think WCAG Is Enough? Think Again.
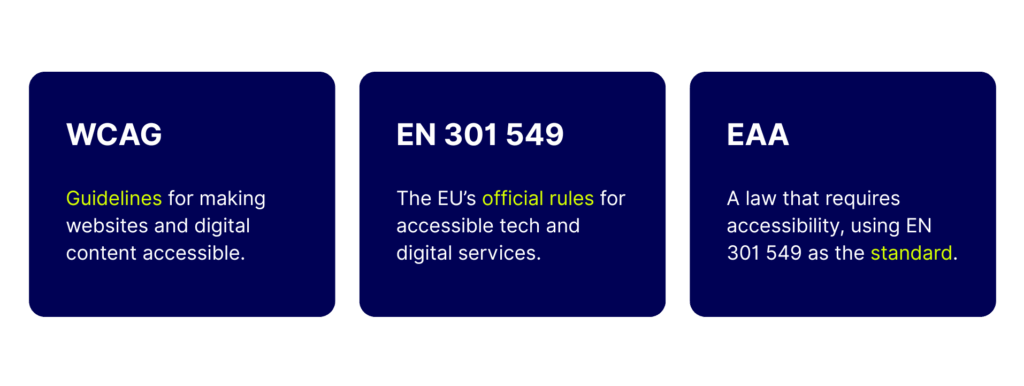
To understand what the EAA demands, it’s important to get clear on two key standards:
WCAG (Web Content Accessibility Guidelines) is a globally recognised framework developed by the W3C. It outlines best practices for making web content more accessible to people with disabilities — covering things like text alternatives, keyboard navigation, and colour contrast. It’s a strong foundation for digital accessibility, but it’s not a law.
EN 301 549 is the official European standard for accessibility of ICT (Information and Communication Technologies) products and services — including websites, apps, documents, software, and hardware. It references WCAG, but also goes beyond it to cover additional requirements such as assistive tech compatibility, non-web software, hardware interfaces, and support services. EN 301 549 is the technical benchmark the EAA uses to define compliance.
Here’s where things get tricky — and where many agencies, consultancies, and suppliers get it wrong.
Some will tell you that WCAG 2.2 AA compliance is all you need to meet the EAA’s requirements. But that’s a dangerously oversimplified take.
Let’s break it down with a metaphor:
Think of building an accessible digital product like organising a music concert.
WCAG is your production handbook — it helps you plan things like lighting, stage layout, and how to ensure clear signage and smooth crowd flow. It’s full of best practices, but it’s not the law.
EN 301 549 is the venue inspection checklist — it’s what the safety inspectors go through to ensure things like accessible seating, fire exits, and hearing loop systems are in place. It’s technical and detailed, and helps you prove you’re meeting the requirements.
The European Accessibility Act (EAA) is the legal permit to run the show — no matter how good the performance is, if the venue isn’t accessible to disabled fans, the event can be cancelled, fined, or banned from future bookings.
You can plan with the best of intentions, but if wheelchair users can’t get to their seats, or if blind fans can’t navigate the ticketing system, it’s not just a bad experience — it’s a legal failure.
Accessible experiences aren’t just about following a checklist. They’re about making sure everyone gets to enjoy the show.
Importantly, following WCAG alone won’t make you compliant. Using overlays will make things worse. And automated tools alone are unlikely to even get you close.
If your vendor says otherwise, be wary. Either they don’t understand the EAA or they’re trying to sell you an easy fix that doesn’t deliver. The risk? Your organisation spends money on remediation — and still faces penalties, brand damage, and restricted access to EU markets.
3. How to Prepare for European Accessibility Act Compliance: Key Steps for 2025
The truth is, we’re basically almost there! While 2025 might have felt far off, the truth is that compliance isn’t a one-off task. It’s a journey (an Arc, a story) — and one that requires technical, organisational, and sometimes cultural change.
Here are the key steps every business should be considering now:
1. Audit Beyond WCAG
Start with a comprehensive audit — but make sure it goes beyond WCAG. Check content, functionality, and code against EN 301 549. This includes things like voice control support, modifiable captions, multi-channel ICT and hardware like public terminals, and accessible customer support channels.
2. Check Your Entire Ecosystem
Accessibility isn’t just about websites. If you provide a mobile app, self-service kiosk, e-book, or even real-time transport updates — you’re likely within the EAA’s scope.
3. Map Internal Capabilities
Do your teams have the knowledge and skills to implement accessibility best practices? If not, now’s the time to train developers, designers, and product teams. Ensure that accessibility is baked into your sprints, not bolted on later.
4. Update Procurement & Partnerships
If you rely on vendors or third parties for platforms, customer service tools, or payment infrastructure, check their compliance too. You are responsible for what your customers experience, even if a supplier built it.
Accessibility isn’t static. Conduct regular user testing — ideally with disabled users who use assistive technologies — to catch issues that automated tools miss. Screen reader compatibility, captions, contrast, and keyboard access should all be part of your checklist. And don’t stop at audits — experiment. Try small changes, test them, and see what actually improves the experience. Tools like AB Tasty make it easier to run inclusive A/B tests and make sure your updates work for everyone.
4. Compliance Is Just the Start — Accessibility Is a Business Superpower
It’s easy to see the EAA as just a legal hurdle — but accessibility is a strategic advantage, not a sunk cost. It’s a long-term investment in growth, resilience, and relevance: here’s why:
Inclusive design broadens your market — especially in Europe, where over 135 million people live with disabilities and millions more experience temporary, age-related, or situational impairments.
Accessibility also improves usability for everyone, enhances brand reputation, and drives innovation (think captions, voice interfaces, dark mode — all born from accessibility).
Demonstrating a commitment to inclusion and equity builds brand trust and aligns your brand with modern values.
Customers increasingly expect inclusive digital experiences, and organisations that lead in this space enjoy stronger loyalty, better SEO, and increased conversions.
Accessibility reduces legal and reputational risk — but more than that, it’s simply good business.
In the race toward compliance, those who see accessibility as an enabler, not a burden, will pull ahead.
Final Thought
The European Accessibility Act isn’t just about avoiding fines — it’s about recognising that inclusive design is better design. The businesses that succeed won’t just be those that hit the compliance deadline, but those that embed accessibility into their core values, the way they work, and their working culture.
If your teams are overwhelmed or don’t know where to start, don’t fall for quick fixes or checkbox audits. The right partner will help you build lasting capabilities — and a digital experience that works for everyone.
In an era where privacy regulations tighten, browser restrictions escalate, and trust is hard-won, brands need more than great ideas to drive their digital experiments — they need full control over how their technologies behave.
That’s why AB Tasty is proud to introduce Domain Delegation, a groundbreaking feature designed to place independence, performance, and compliance at the heart of your experimentation strategy.
Why Domain Delegation changes the game
The digital landscape is constantly shifting at a fast pace. With evolving browser privacy policies (like ITP and ETP), widespread ad blockers, and stricter data regulations, third-party scripts are increasingly vulnerable — slowing down your site, triggering blockers, or worse, being outright rejected.
For enterprises operating under rigorous security standards, these challenges can make it nearly impossible to deploy tools like AB Tasty efficiently.
That’s where Domain Delegation steps in.
This powerful new feature allows you to serve the AB Tasty tag from a custom subdomain you control (e.g., abt.yourdomain.com), while AB Tasty takes care of the heavy lifting behind the scenes.
What you can do with Domain Delegation
Host the AB Tasty tag on your own subdomain (e.g., abt.brand.com)
Easily delegate DNS management to AB Tasty through an intuitive guided setup
Bypass blockers, improve load speed, and boost reliability
Deliver the tag under your own brand, reinforcing trust and compliance
Minimal technical effort, fully managed from the AB Tasty interface
What’s in It for You
✅ Higher tag reliability ⚡ Better site performance & Core Web Vitals 🔐 Stronger data governance & security posture 🤝 More brand trust with white-labeled tag delivery
Who benefits the most?
Highly regulated industries: Finance, healthcare, government
Privacy-first brands: Total data flow ownership
Tech teams optimizing performance and autonomy
Any organization battling browser or ad blockers
Why Now?
Privacy restrictions aren’t going away. Ad blockers aren’t easing up. With Domain Delegation, AB Tasty empowers you to take back control over your experimentation stack — ensuring you stay compliant, performant, and trusted.
This isn’t just a technical feature. It’s a strategic foundation for the next era of digital experimentation.
How It Works
Define your subdomain (e.g., abt.mybrand.com)
Follow the easy delegation flow in AB Tasty’s interface
Let us handle the rest (provisioning, certificates, delivery)
Your tag. Your domain. All powered by AB Tasty.
Domain Delegation Availability
Interested in Domain Delegation? Contact your AB Tasty Customer Success Manager to get started.