Customer experience optimization (EXO) used to be your secret weapon. Go the extra mile, win the customer. Simple. But the game has changed, and now everyone’s optimizing. It’s no longer about gaining an edge; it’s about staying relevant in a market where a solid customer experience strategy isn’t just nice to have, it’s the baseline for survival.
What does that actually mean? It means shaping every interaction a customer has with your brand across all touchpoints, from website browsing and mobile app experiences to in-store interactions, chatbot conversations, and tablet interfaces. Every touchpoint matters because these interactions don’t just influence purchasing decisions; they shape loyalty, trust, and whether someone comes back or walks away for good.
Why Does EXO Matter Now More Than Ever ?
Deliver solid experiences, and you’ll build a reputation that sticks. Conversion rates climb. Customer loyalty strengthens. But here’s the catch: you can’t stop moving. Stand still, and you’ll get overtaken. Fast. So what does it take to stay ahead?
You need to:
- Figure out what your customers actually want – not what you think they want
- Find the sweet spot between their needs and what you offer
- Keep evolving your interactions on an ongoing basis
That’s where superior experiences live. That’s where business success happens.
Optimization isn’t a one-time project. It’s the bare minimum. To stay competitive and stay ahead, the work never stops.
You need a continuous feedback loop:
- Test hypotheses
- Gather behavioral data
- Analyze results
- Iterate improvements
This is how you maximize customer experience and hold onto your edge. Not through one big launch. Through brave, ongoing iteration.
Why Must You Optimize Your CX Strategy Continuously ?
Technology shifts every second, and customer attitudes evolve even faster. The only way to keep pace is by adapting continuously. Your optimization practices need to respond to customer demands in real time—unlocking value, building loyalty, and staying relevant.
When teams work together, everything clicks. Living and breathing this approach means your teams collaborate seamlessly:
- Marketing teams understand user behavior
- Product teams prioritize features that matter
- Tech teams implement changes efficiently
They share the same mission. They work from the same experimentation roadmap. And when they do resources unlock, improvements roll out at the right time and, most importantly, your business stays on the road to success.
Why Is Digital Customer Experience Optimization Essential?
At the core, every business—no matter the product or sales channel—tries to satisfy customers. Customer centricity isn’t new.
But customer experience optimization really took flight when technology advanced and brand touchpoints multiplied. Add in the fact that data is everywhere—collectible, analyzable, actionable—and suddenly you have the means to understand your customers better than they understand themselves.
Still not convinced it matters? The numbers tell the story. According to PwC’s Customer Experience Survey and Future of CX research:
- One in three consumers will walk away from a brand after just one bad experience
- 73% of consumers say their experience with a brand is a major factor in purchasing decisions
- Customers will pay up to 16% more for products and services from brands that deliver better experiences
Think about your own habits. Pause for a moment. Think about your own online shopping:
- Which brands do you gravitate toward? Which ones leave you cold?
- Do they see you as a person—or just another transaction?
It only takes a second to realize: optimizing customer experiences isn’t just important. It’s essential.
How to improve digital customer experience: 10 Proven Strategies
Improving digital customer experience isn’t a one-and-done project—it’s an ongoing commitment to making every online interaction better. Whether you’re optimizing your website, mobile app, or omnichannel strategy, these proven tactics will help you deliver seamless, personalized experiences that keep customers coming back.
1. Map the Digital Customer Journey
Start by understanding every touchpoint your customers encounter—from discovery to purchase and beyond. Customer journey mapping helps you identify pain points, friction, and opportunities to improve the experience.
Use tools and frameworks to visualize each phase of the journey, then prioritize the touchpoints that matter most to your audience. Resources like AB Tasty’s Digital Customer Journey Kit offer practical guidance for mapping and optimizing these paths.
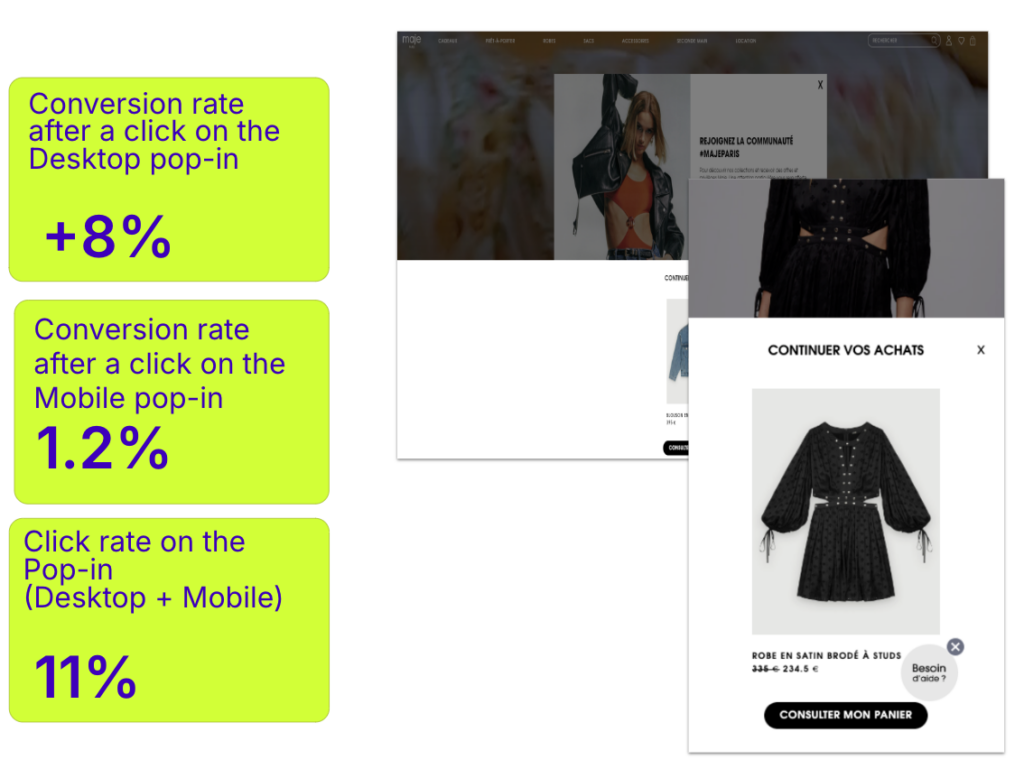
2. Personalize Every Interaction
Personalization is the foundation of exceptional digital CX. In fact, 66% of consumers say they’ll stop buying from a brand if their experience isn’t personalized. Use behavioral data, preferences, and analytics to tailor content, product recommendations, and messaging to individual users.
Advanced segmentation—including emotional and behavioral insights—can help you address different customer needs and motivations more effectively. Learn how AI-powered personalization works in AB Tasty’s EmotionsAI case studies.
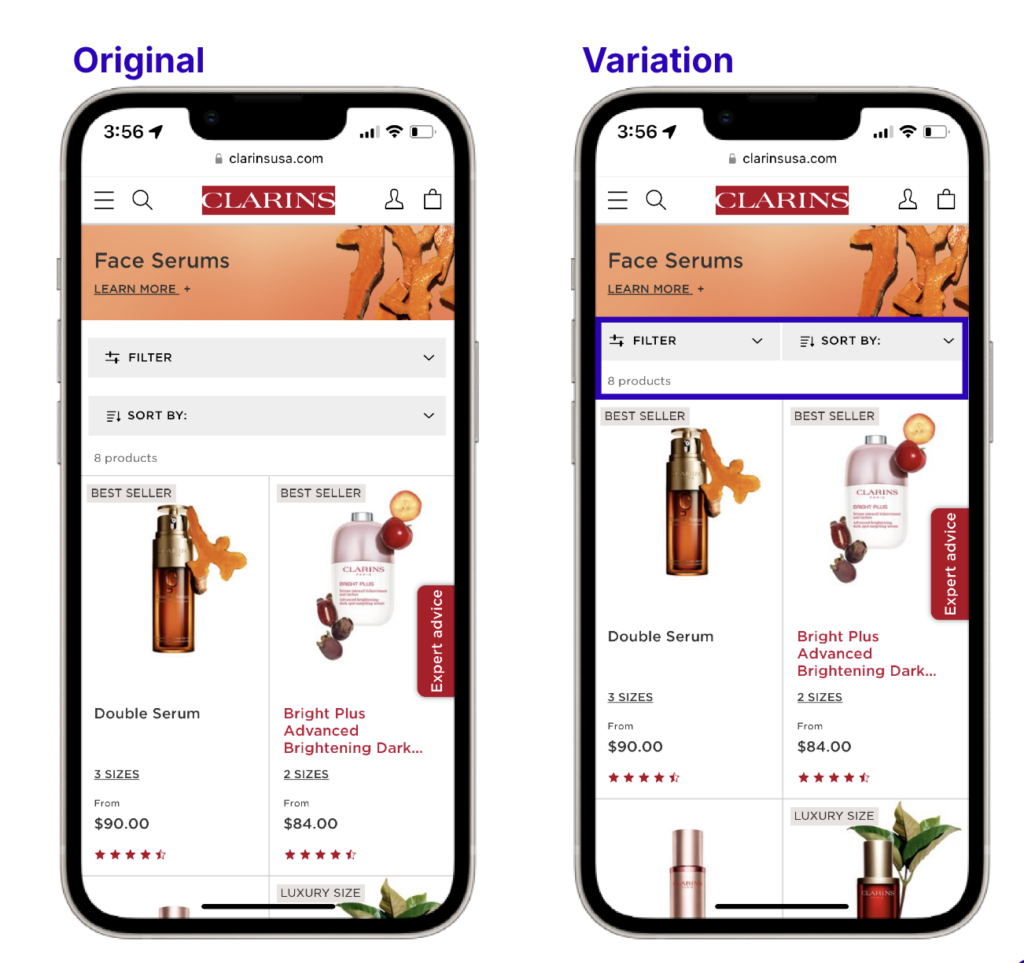
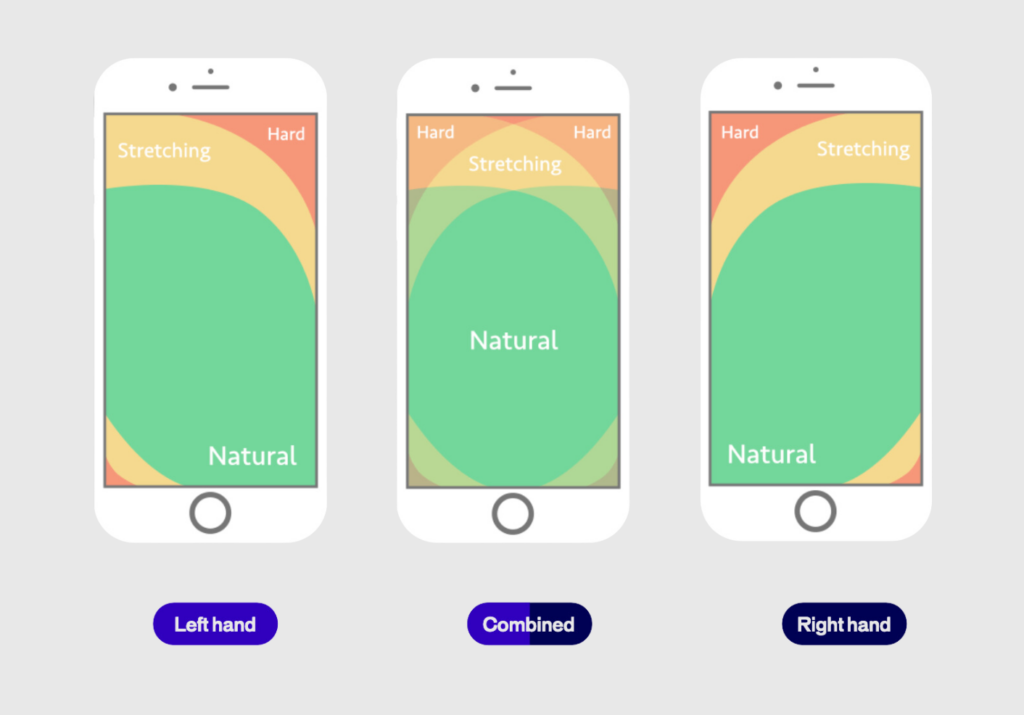
3. Optimize UX Across All Devices
Your website and app should be intuitive, visually appealing, and easy to navigate—especially on mobile. Mobile optimization is non-negotiable, as more customers interact with brands on smartphones than ever before.
Streamline navigation, simplify checkout processes, and remove any friction points that slow users down. A well-optimized UX directly impacts conversion rates and customer satisfaction.
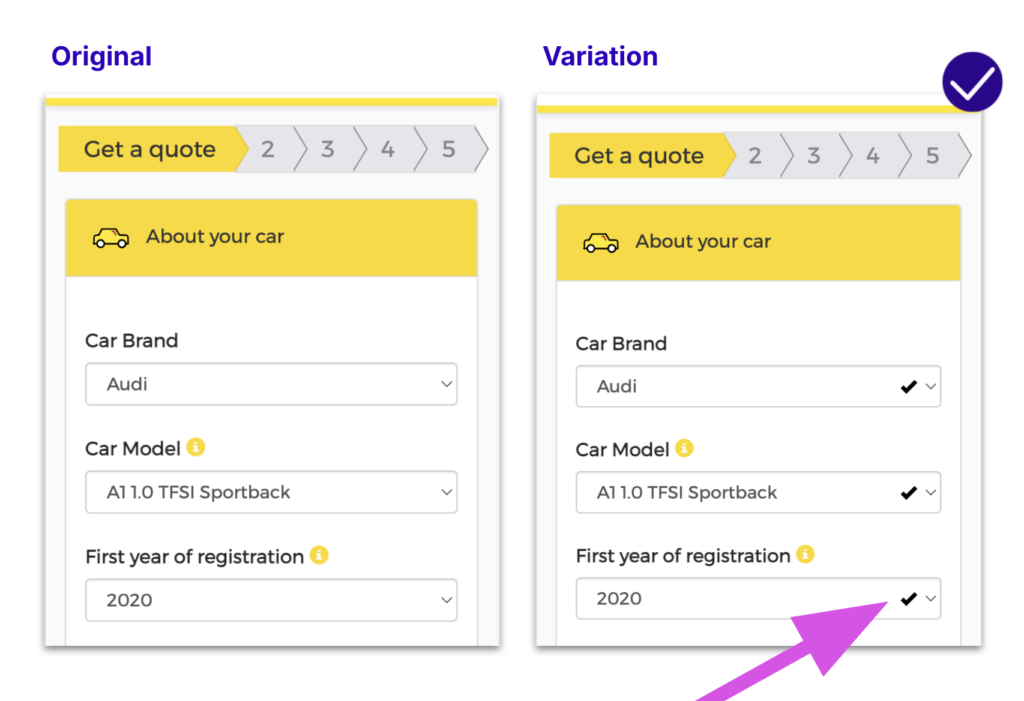
4. Test, Learn, and Iterate Continuously
A/B testing and experimentation are essential for digital customer experience optimization. Continuously test different layouts, messaging, CTAs, and features to discover what resonates best with your audience.
Use the results to refine your digital experiences over time. Remember: even small improvements can lead to big wins in engagement and conversions.
5. Ensure Omnichannel Consistency
Provide a unified, seamless experience whether customers engage via desktop, mobile, app, social media, or chat. Omnichannel customer experience builds trust and makes transitions between channels effortless.
Consistency in branding, messaging, and service quality across all digital touchpoints is critical for customer retention and loyalty.
6. Leverage AI and Automation
AI-powered tools can transform how you deliver digital experiences. Use AI to automate personalization, product recommendations, and customer support—boosting both efficiency and satisfaction.
Automation frees up your team to focus on higher-value activities while ensuring customers get fast, relevant responses at every stage of their journey.
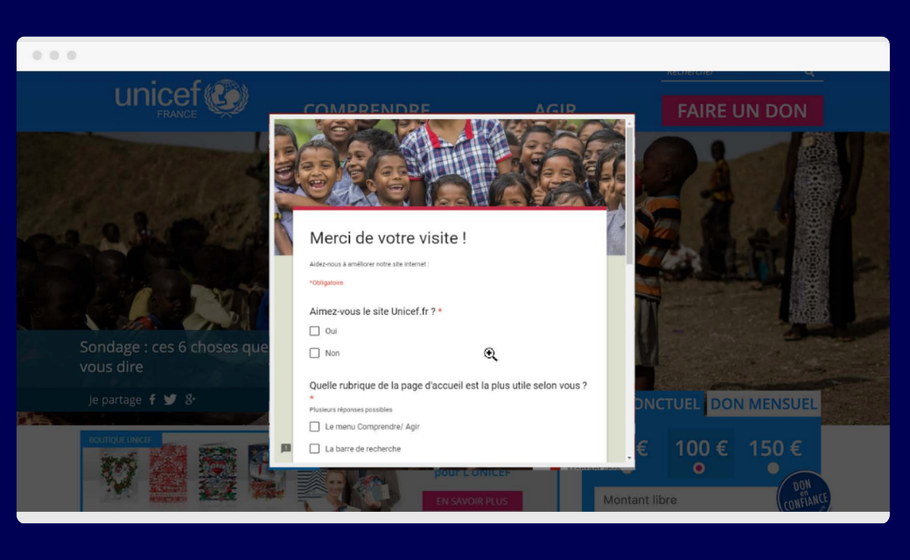
7. Collect and Act on Customer Feedback
Regularly gather feedback through surveys, reviews, and direct interactions. Use tools like Net Promoter Score (NPS), Customer Satisfaction (CSAT), and Customer Effort Score (CES) to measure digital CX performance.
More importantly, act on what you learn. Customer feedback is one of the most valuable resources for continuous improvement.
8. Simplify Processes and Reduce Friction
Make every process—from sign-up to checkout to support—as simple and fast as possible. Reducing friction means removing unnecessary steps, providing clear guidance, and ensuring smooth, intuitive flows.
Speed and ease of use are non-negotiable for modern customers. The easier you make it, the more likely they are to convert and return.
9. Use Data and Analytics to Drive Decisions
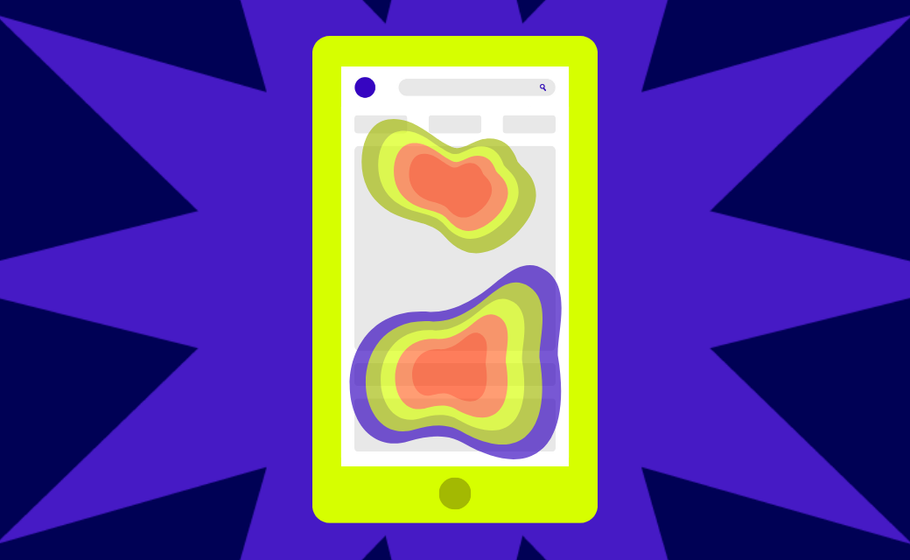
Data-driven insights are critical for shaping exceptional digital customer experiences. Track user behavior, conversion funnels, and engagement metrics using tools like Google Analytics and heatmaps.
Analyze performance regularly, identify trends, and use these insights to inform your optimization strategy.
10. Foster a Customer-Centric Culture
Improving digital CX isn’t just the job of one team—it requires cross-functional collaboration. Share data, insights, and goals across departments to align everyone around the mission of delivering better experiences.
When customer experience becomes an organization-wide priority, the results speak for themselves: higher satisfaction, stronger loyalty, and sustained growth.
Read our strategies and tips on EXO →
3 Key Ingredients to Supercharge Your Customer Experience Optimization Strategy
1. Optimize Your User Experience (UX)
Know your customer journey—and dial it up. When a customer lands on your site, they’re on a mission: searching for products, comparing options, learning more about features, and making purchase decisions.
Each step they take is part of a path—one filled with opportunities and pitfalls. The more you understand that journey and remove friction along the purchase funnel, the better your site performs.
Here’s how to make it happen:
- Gather data about customer behavior and preferences
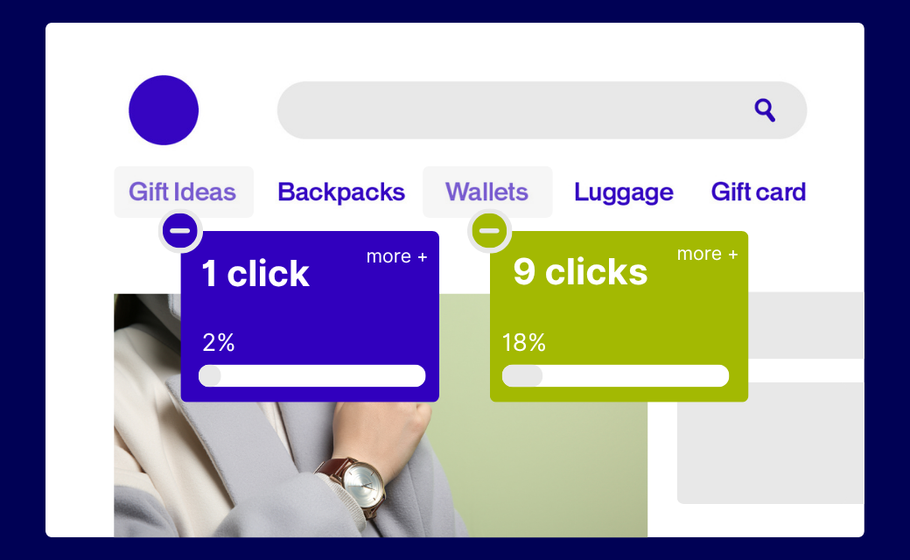
- Run experiments using A/B testing to find the optimal setup
- Test everything – calls-to-action, landing page configurations, product images, navigation structure, form length
Not sure if your CTAs have the best wording? Test them. Trying to nail the perfect landing page? Run an experiment. Debating whether product images should be cropped or full body? We can examine that too.
Ultimately, you’re aiming for one thing: more conversions. Driving UX optimization on an ever-changing customer pathway keeps you ahead.
2. Improve Your Personalization Efforts
Know your customers—and tailor to their needs. Personalizing digital brand interactions builds loyalty and drives repeat business. In the experience economy, you’re not just selling a product—you’re selling the interaction, the purchase moment, the entire journey.
The user experience when acquiring and consuming your product is just as important as what it does. So personalizing these digital exchanges is key to long-term retention.
To understand customers on a personal level:
- Build a solid data foundation to collect behavioral insights
- Identify their needs through analytics and feedback
- Deliver personalized experiences that keep shoppers returning
- Iterate based on results to refine your approach
Because personalization is about getting to the root of what customers have shown you they want—and delivering against that.
As with your customer journey, responding to ever-changing desires can be challenging. Knowing your customers intimately is crucial. Get it right, and the impact is huge. So don’t leave any stone unturned when exploring improvement opportunities.
3. Implement Server-Side Testing and Feature Management
Bring in the tech teams to expand your optimization activities. This is where we bring in the heavy hitters.
While A/B testing can be rapidly implemented by marketing teams, server-side experimentation requires the buy-in and expertise of tech teams and developers. Collaboration between the two is essential to deliver seamless customer experiences.
Think of it this way:
- The front-end (client-side) lures customers in with compelling design
- The back-end (server-side) runs smoothly to ensure effortless shopping
For instance: presenting a promotional offer (front-end) only delivers results if the payment gateway runs glitch-free and page loading times are fast (back-end).
Lukas Vermeer, director of experimentation at Vista, champions testing both sides:
“A lot of the value from experimentation comes from two things: One is not shipping the bad stuff—a huge value point. The other is figuring out strategically, going forward, what you should invest in.”

Listen to the insightful Lukas Vermeer episode on our podcast, The 1000 Experiments Club →
If your business has reached a certain level of maturity, maximizing both client and server-side testing ensures your optimization efforts work as hard as they possibly can.
Customer Experience Optimization Across Industries
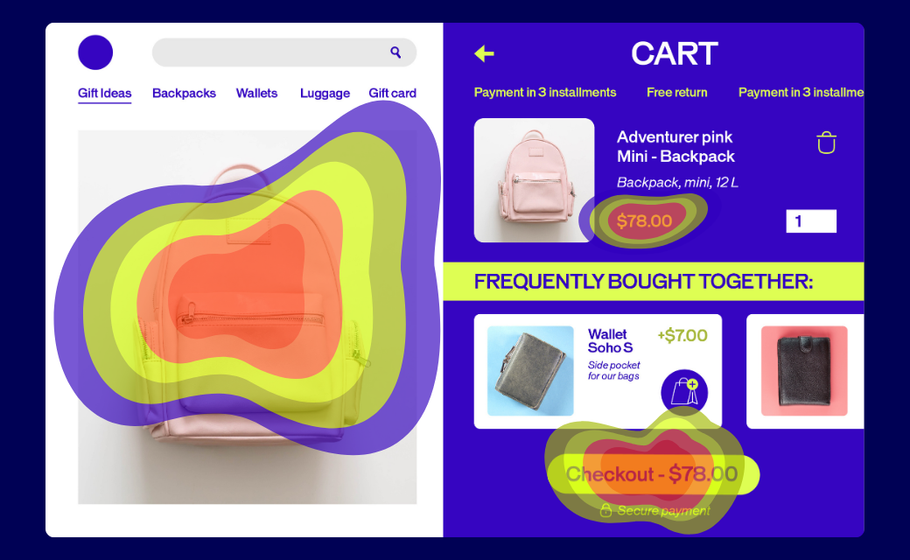
E-Commerce Optimization
Drive transactions and boost conversion rates through continuous experimentation. Test and optimize:
- Product page layouts
- Checkout flow
- Cart abandonment recovery
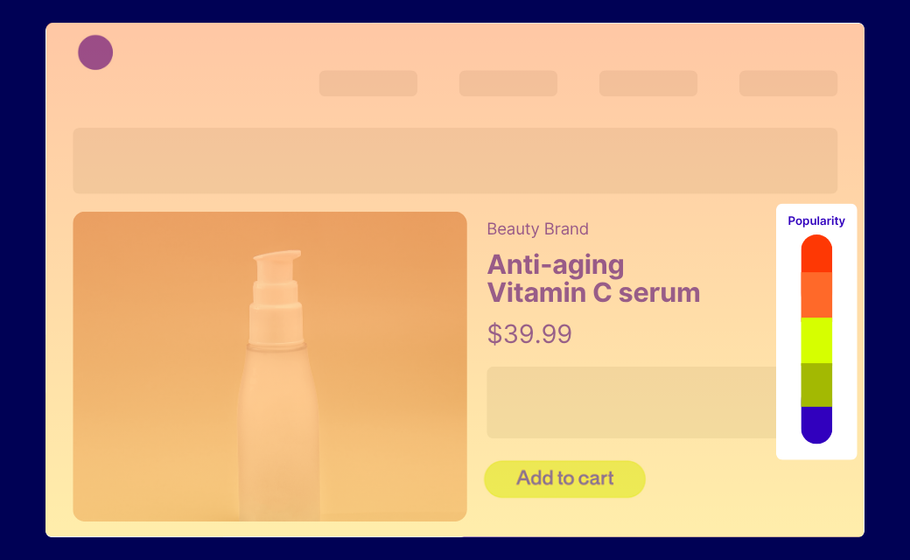
- Product recommendations
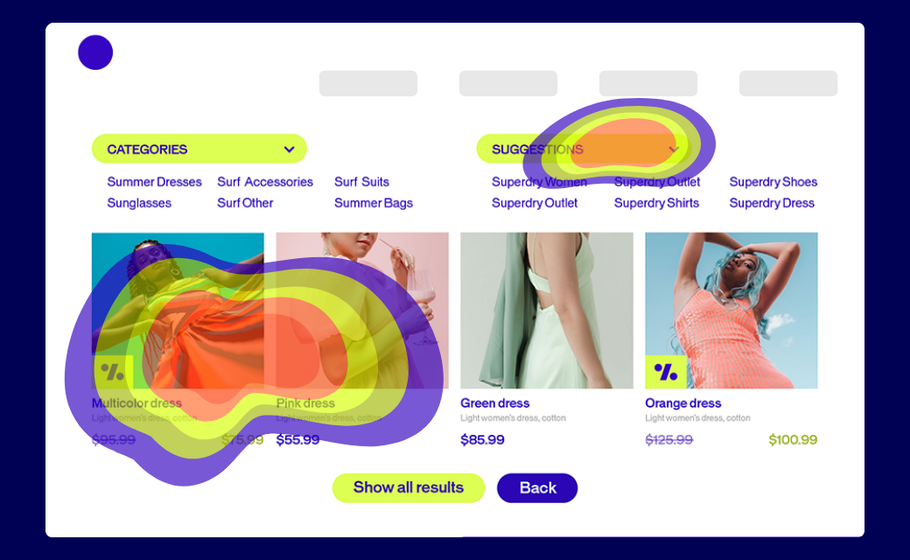
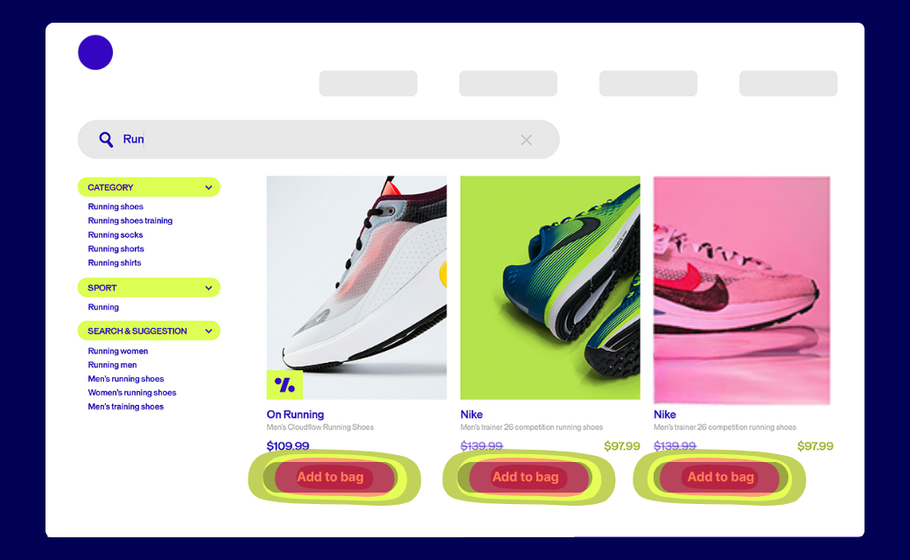
- Search functionality
Goal: A smoother purchasing experience that caters to your users’ every need.
Discover how Ulta Beauty drives results in this experimentation case study →
B2B Lead Generation
Not every website is for purchasing right then and there. Sometimes site visits are the first step on a longer journey.
Optimize for lead generation on big-ticket purchases—automotive, bedroom furniture, holiday rentals—by focusing on:
- Site layout and navigation
- Call-to-action placement
- Access to product information
- Store locator functionality
- Contact forms and lead capture
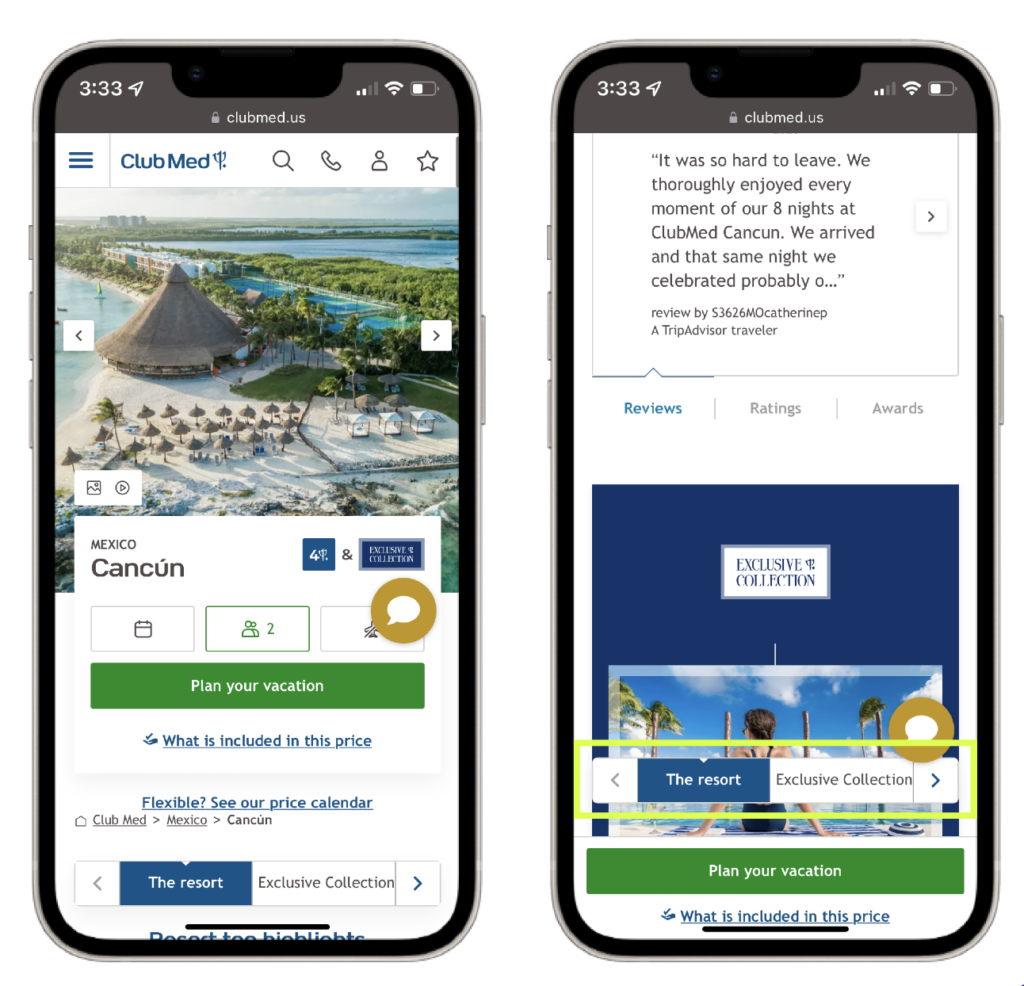
Travel and Hospitality
Travel offers a range of solutions—from individual bookings (hotels, transport) to comprehensive packages. When bundling items together, finding that pricing sweet spot is key.
Server-side testing is particularly relevant here. It helps you:
- Curate product offerings based on user preferences
- Optimize pricing strategies
- Test package combinations
- Improve booking flow
- Increase conversion rates
Check out AB Tasty’s EXO Travel Kit to gain a deeper understanding of our approach →
Conclusion
Experience optimization isn’t optional anymore—it’s how you stay competitive. Every test you run, every insight you uncover, every iteration you make moves you closer to experiences that truly resonate.
The path forward is clear: map your customer journeys, personalize boldly, test continuously, and let data guide your decisions. Whether you’re optimizing e-commerce checkout flows, refining B2B lead generation, or perfecting travel booking experiences, the principles remain the same—understand your customers deeply, remove friction relentlessly, and never stop improving.
Here’s the truth: your competitors are already optimizing. The question isn’t whether to start—it’s how fast you can move and how brave you’re willing to be with your experiments.
Ready to go further? Let’s build better experiences together →