Undoubtedly, feature flags provide a lot of value for software development teams looking to mitigate risk and have more control over the release process. By wrapping code (or features) in a flag, teams can enable and disable a feature thereby controlling who has (and doesn’t have) access to it. Feature flags also allow you to progressively roll out new features and test in production to obtain feedback so you can optimize accordingly before a general release.
However, feature flags do come with some degree of risk and so certain best practices apply in order to get their full benefits. Here is a checklist of dos and don’ts to follow to ensure your feature flagging usage is as smooth and as productive as possible.
Click on the image to view the full-sized infographic in a new tab
The Ultimate Guide to Experience Rollouts Using Feature Flags
Rowan Haddad
In modern software development, DevOps teams have shifted their attention on the continuous delivery of features to keep up with fast-changing market and consumer demands.
Teams now more than ever have to be in the driver’s seat when it comes to delivering these features and to whom.
This is why feature flags (or feature toggles) have become the ultimate tool to manage the release of new features.
What are experience rollouts?
When we talk about experience rollouts, we’re referring to the risk-free deployment of features that improve and optimize the customer experience.
This could be in the form of progressive deployments where features are gradually released to reduce the risk of big bang releases or by targeting new features to the most relevant users in order to personalize their experience.
But how do you ensure you’re delivering optimal experiences without negatively impacting the user experience? How can you minimize risk when rolling out new features and ensure that they actually meet your customers’ needs and expectations?
The answer to both these questions is feature flags.
Feature flags are a great solution to allow you to continuously deliver new features while limiting user access to these features, thereby reducing risk.
By decoupling deployment from release, feature flags give teams the power to choose who to send new features to and when. Thus, teams can continuously develop and deliver new features without having to make them available to all users.
What are feature flags?
Let’s start with the most basic definition of feature flags.
Feature flags are a software development tool that enable teams to turn functionalities on or off in order to safely test new features by separating code deployment from feature release.
They can also be referred to as feature toggles as they allow you to toggle a feature on or off by hiding that feature behind a flag and then deciding who to make this feature visible for.
This is particularly useful when you’re looking to personalize the customer experience according to the type of user. This means you can enable features to only target certain users to display the right content to the right audience at the right time, while tracking their performance over time.
With AB Tasty Rollouts, you can configure personalization campaigns, for example, to personalize the user experience for new visitors on mobile only and show them discount codes as a welcome offer. Therefore, you can define the targeted users and the flag (with its value) that will activate the discount code for a particular scenario; in this case, new users on mobile while monitoring the relevant KPIs.
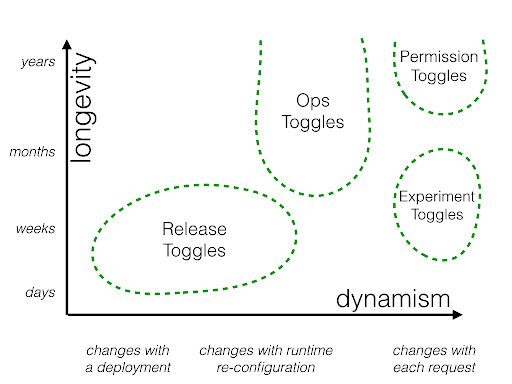
Feature flags can be leveraged across different use cases. This is because there are many different types and categories of feature flags as seen in the image below and which one you choose depends on the purpose of using the flag in the first place.
For example, release toggles support dev teams as they write new features while experiment toggles are primarily used by product and marketing teams to facilitate A/B testing.
For this reason, feature flags can be used across a wide variety of use cases by multiple teams across an organization, especially when you have a feature management solution to manage all your flags.
In particular, feature flags give teams a very granular level of control and risk management over code, which can be important when modifying backend features that have a wide-ranging impact on how your system performs.
The following section will provide further details on what the term “experience rollouts” entails and discuss how feature flags can help you regain control of how you roll out experiences to your customers at the flip of a switch.
Progressive deployment and rollouts
Perhaps one of the greatest benefits of feature flags is their ability to mitigate risk when it comes to new feature releases.
This is because feature flags empower teams to release their features to any user groups of their choice.
Therefore, teams can safely test out their new features on a preselected number of users, whether with internal or external users, to validate functionality and gather feedback in order to make any necessary changes and optimize future feature releases. By continuously iterating features in real time during the release process, companies can provide more value to their customers and ensure customer satisfaction.
Sophisticated feature flagging functionalities give you the ability to closely monitor metrics that indicate how a new feature is performing and how well-received it is by users.
This way, should anything go wrong with a release, teams can minimize the blast radius and any negative impact due to a faulty feature. This also gives them the time necessary to address the issue by disabling the flag before releasing it to everyone else.
The best thing about progressive deployments and rollouts is that teams are essentially in the driver’s seat: they have control over who sees what and when, allowing them to maintain the momentum of CI/CD but with less risk.
Another great advantage of progressive rollouts is that it increases both the velocity of the development lifecycle and testing as teams can roll out releases in phases, they can quickly test on their chosen user group, make the iterations necessary and then run more tests.
Rollbacks
Just as you can roll out new features and experiences to your users, you can also easily roll back these features whenever needed with the help of feature flags.
This means that if anything goes wrong with any feature you’ve rolled out to your chosen users, you can quickly disable the flag so that users no longer have access to the feature.
Releasing new features to real-world users is always a risky endeavor and can cause real harm to your brand’s user relationships but it doesn’t have to be.
Now, after any feature release, teams can isolate the faulty or buggy individual feature(s) that have and perform a targeted rollback on them. With advanced third-party feature management platforms, you can roll back a feature in real-time by just toggling a single field with just one click.
AB Tasty is one such tool that allows you to roll out new features to subsets of users by assigning specific flag values to different user segments and comes with an automatic triggered rollback in case something goes wrong.
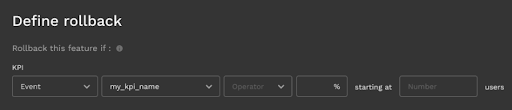
The automatic rollback option enables you to stop the deployment of a feature and to revert all the changes that have been made in order to ensure that your feature isn’t breaking your customer experience. This is done by defining the business KPI you want to track that would indicate the performance of your feature.
When this KPI is set, you will then associate a value (in %) which, if exceeded or reached, will trigger the rollback. To make the rollback significant, you must define a specific number of visitors from which the rollback comparison will be triggered.
When the conditions are met, the progressive rollout feature will be rolled back, which means that no more targeted users will see the feature.
Targeting
We’ve talked a lot about how you can use feature flags to allow certain users to see a feature while hiding it from others.
When you do a targeted rollout, you’re basically releasing new features to a predefined set of users rather than opting for the riskier big bang release.
Here’s a look at some targeting scenarios where feature flags do their best work:
Alpha and beta testing
A/B testing
Managing entitlements
Blocking users
Canary deployments/percentage rollouts
Ring deployments
There are many ways teams can progressively deploy and roll out features to a select audience. With the help of feature flags, teams can manage and streamline these deployment methods to perform highly granular user targeting.
AB Tasty Rollouts allows you to target users based on certain identifying attributes like beta testers, age group, or any other user attributes you have access to.
Furthermore, our integrations with third-party tools such as Segment, GA4, Mixpanel and Heap means that you can also target your test and personalization use cases with audiences built in these tools and then exporting these user groups or cohorts to AB Tasty to target them.
Flag management
To truly reap the benefits of feature flags, you have to know how to manage them effectively. Otherwise, you will end up with so many flags in your system that you start to lose track of which flag does what. This could ultimately lead to the most dangerous pitfall of feature flags: technical debt.
At that point, your code could become too complex that it will be difficult to manage and could negatively affect the quality of your code.
This is why feature management and feature management solutions are so essential today for modern software development teams. With such solutions, teams have access to advanced features to enable them to work with feature flags at scale and avoid the most common problems associated with them.
AB Tasty is one solution packed full of features that can help you avoid the dreaded technical debt with a clear, easy-to-use dashboard that all your teams, from development to product, can easily use to efficiently track and manage feature flags usage across your organization no matter how far along you are in your feature flag journey.
Furthermore, flags can be controlled from another platform using AB Tasty’s Remote Control API allowing teams to work from just one tool without having to log onto the platform. This saves a lot of time and effort as you can perform all AB Tasty tasks directly with API calls, including managing your projects, use cases, variations, variation groups, users, targeting keys, and your flags.
Experience rollouts with feature flags
As we’ve seen, the idea of experience rollouts revolves around rolling out your best features to end-users. This is when feature flags become the most powerful tool to ensure you’re only releasing optimal features that provide the best customer experience possible.
This is because feature flags give you the ability to progressively deploy and roll out new features to gather feedback from the users – giving you the most relevant feedback to iterate and optimize your releases. This will help your teams to make more informed, data-driven decisions to drive your conversion rates, ultimately aligning the user experience with business objectives.
Consequently, when you finally do a full release, you’re confident that you’re releasing features that provide the most value to your customers and so will have the best impact on your business in terms of revenue and conversions.
Do you want to deliver first-in-class customer experiences? Click on the “Get a Demo” button at the top to see for yourself what feature flags can do for your own experience rollouts.
When to Make the Leap from Client- to Server-Side Testing
Rowan Haddad
As companies start out their experimentation journey, they may find themselves experimenting with small changes on their website such as the design of a CTA and other small changes to explore how they perform and their impact on key KPIs such as conversion rate and transaction.
However, as an experimentation program matures, companies are more likely to want to delve deeper into more sophisticated types of testing which require more expertise and a more advanced tool.
This is the point when many companies are ready to take the plunge from client- to server-side experimentation.
In this article, we will explore when is the right time to make the shift to server-side testing and discuss the importance of running these types of tests by outlining the various scenarios where server-side experiments are more appropriate.
Client- vs server-side testing
Before we go deeper into server-side testing, we will quickly point out the differences between client- and server-side tests to understand why you need both types of testing as your experimentation and optimization program evolves.
In client-side testing is where experimentation occurs on the client side through Javascript that runs in the browser. Therefore, client-side tools enable you to create variations of your pages by changing the content sent by your server to users in the web browser. The user then gets one variation of your altered content based on your targeting rules.
Put simply, all the work happens at the level of the browser thanks to Javascript. Because of this, client-side testing is usually best for surface-level changes such as layout, design and colors to measure their performance and impact on key KPIs.
Meanwhile, all the work in server-side testing happens at the server level rather than the browser. In other words, it’s your server that randomly sends a user the modified variation. As a result, the experimentation tool works on the server instead of inside your users’ browsers.
Perhaps one of the biggest benefits of client-side tests is that it’s easy to implement and no special expertise is required to run these tests on the front-end of the website.
However, because of its advanced capabilities, server-side tests require technical expertise and coding skills and so developers are usually the ones running these tests on the back-end.
What are the benefits of server-side testing?
Before we go into when you should be using server-side tests, we will outline some of their benefits in order to better understand their use cases.
Omnichannel experimentation
Client-side solutions are usually limited to devices with web browsers, whether that’s on desktop, mobile or tablet. This means you cannot run experiments on mobile apps or connected devices.
Server-side solutions, for their part, allow you to experiment across multiple channels including mobile apps which significantly widens your playing field and opens up numerous opportunities to A/B test beyond web browsers so you can cover all your bases.
Enhanced performance
Perhaps one of the biggest advantages of server-side tests is the absence of the flicker effect, which is often a major downside associated with client-side solutions.
The flicker effect occurs when the original page loads and is replaced by the test variation and is usually seen by the user.
Unlike client-side tools that require adding a Javascript tag to your pages, you don’t need to add this tag in server-side tools. That’s because experiments are rendered on the server before being pushed to the client and so all the major work occurs at the server level- it’s not noticeable on the client side.
In other words, during a server-side test, the variation is retrieved from the server and delivered to the user’s browser. As a result, no modifications take place on the front-end or browser, so there’s no flickering effect
Endless testing opportunities
Your teams have a lot more options to work with when it comes to server-side testing as it enables you to modify all aspects of your site.
As server-side tests are rendered from the back-end server, you can test more complex dynamic content unlike with client-side tests where it’s not easy to test such content and may damage the user experience if done on the client-side.
In other words, you can build tests that are much more complex that go deeper within your tech stack beyond the scope of UI or cosmetic changes to unlock a whole new world of experimentation.
With such deep experimentation capabilities, teams can thoroughly test all facets of a product to validate its functionality such as evaluating its underlying features, algorithms and back-end logic.
The next section will go over these various use cases where you should consider running server-side testing instead.
When does it make sense to move to server-side testing?
As we’ve mentioned, server-side tests are usually used to run more advanced types of tests and experiment deeply within your tech stack to thoroughly explore how a product works.
Put simply, server-side experimentation solutions allow teams to conduct more robust and secure experiments that are focused on modifying a product’s functions.
Here are some use cases where server side testing is recommended over client-side testing:
Run experiments on your mobile app
As already mentioned, one of the key advantages of server-side testing is enabling omnichannel and cross-platform experimentation.
As client-side solutions rely on Javascript and cookies, it’s not possible to use them to test on native mobile apps and you’re limited to devices that have a default web browser.
This means to run experiments on your mobile app, you will need a more advanced server-side testing solution to handle mobile app technologies, which are more complex and vastly different from web technologies.
Moreover, because server-side testing works on both web applications and mobile apps, you can run the same test serving the same variations irrespective of which channel they’re using. This allows you to compare data from each channel and optimize the user experience across all the different touch points accordingly.
Finally, if you use feature flags to conduct server-side testing on mobile apps, you can bypass the tedious and time-consuming app store approval. Put simply, feature flags enable you to turn functionality on or off remotely without redeploying code to app stores and waiting for its approval or having to wait for all changes to be ready at the same time to release your own changes.
Test your search algorithms
Server-side A/B tests are efficient for testing deeper level modifications related to the backend and the architecture of your website.
This is the case with search algorithms which require modification to your existing code. E-commerce websites usually turn to server-side testing to ensure that customers can easily browse through their website and find the product they’re looking for.
Thus, search algorithms are key in getting customers to find the product they’re looking for by providing a seamless search experience that eventually gets them to purchase.
For example, you can test what is displayed to customers in their search results, whether this should be based on pricing, popularity or reviews or whether you need to prioritize products based on what customers purchased/liked/viewed in the past.
Server-side testing allows you to create such complex scenarios and rules to provide customers with more personalized reocmmendations and optimize their search experience on your site. These are more difficult to test through client-side solutions as search pages are based on the search query and so they are rendered dynamically.
Thus, server-side testing offers more comprehensive testing and allows you to experiment with multiple algorithms by modifying the existing code.
Optimize your product recommendations
Similarly, with server-side tools, you can test multiple product recommendation algorithms typically found at the bottom of product pages to measure which types of layouts generate the most sales or increase average order value. For example, is it better to promote similar products, the most popular products or those that were recently viewed?
Such recommendations are based on a variety of criteria, like browsing history and on your own PIM (Product Information Management) system and other data sources. Server-side testing will allow you to test these multiple algorithms to uncover the best performing selection of recommended products.
Test data-sensitive pages
Server-side testing is great for testing on pages where data security is vital as it ensures that the data remains safe internally within the server without worrying about a security threat.
This is ideal to test on e-commerce payment pages or for banking applications, for example, or any other web pages or apps that contain sensitive data.
You can also use feature flags to test out a new payment method on a subset of users and see how they adapt before rolling it out to everyone else.
Determine the ideal form length
This is especially important for SaaS businesses that rely on free trial and request demo forms to gather information from their visitors. Thus, they need to determine the best length for such forms without risking drop-offs but still being able to gather all the necessary information about a prospect.
Server-side testing is the way to go in this scenario as your forms are directly linked to how your database is structured. If a field is obligatory, you will not be able to hide it using JavaScript because the form’s validation will fail server-side.
This also applies to other websites that utilize such forms from visitors such as hotel reservation or insurance sites. Note that different sectors will require different and more or less information depending on the type and purpose of the information being gathered.
Test the limit for free shipping
E-commerce businesses should be able to determine the order value over which free shipping is possible. This is important as shipping costs are one of the major causes for cart abandonment.
Therefore, since shipping cost is one of the determining factors in a customer’s purchase decision, companies should test out various cart value thresholds to find out the optimal limit for free shipping to improve transaction rates.
Since shipping costs are usually rendered dynamically from the back-end server, you will need to test them on the server-side. Any modifications made should have an impact on all of the following steps, and should be managed server-side.
Validate your features
Server-side tests allow you to conduct feature testing to validate your product features by rolling out variations of your feature to different groups of users to evaluate its performance before going for a general release.
With the help of feature flags, you can run server-side A/B tests and segment your users by directing them to one variation or the other. If anything goes wrong with a variation, you can easily roll it back by disabling the flag before it further impacts the user experience.
Finally, according to the feedback generated from these users, you can then optimize your features and release them to all your users with the confidence that it matches customers requirements.
Server-side tests and feature flags
The best way to run server-side tests is through feature flags. By decoupling deployment from release, you can conduct server-side A/B tests by rolling out new features to a small group of users. You can then measure their performance on this group of users before rolling out to everyone else.
While server-side testing requires technical expertise and coding skills, it’s not only relevant to tech teams. Often, non-technical staff team up with product teams to define experiments, which are then executed by the engineers. Once implemented, an experiment can usually be controlled, monitored, and analyzed via a dashboard.
With the right feature management solution, all teams across an organization can run server-side tests with the help of an easy-to-use dashboard without facing any technical hassles.
Client- vs server-side testing: Context matters
In the end, it’s important to note that it’s not a question of whether server-side is better than client-side. They’re both complementary approaches and whichever one a company chooses depends on which is better suited for its optimization and larger business goals.
In other words, one type of testing doesn’t replace the other. It’s a matter of looking at the type of experiment you want to run and which type is more suited in that particular context and which teams are looking to run the experiment- marketers tend to favor and use client-side testing more often while product managers and developers usually opt for server-side testing for their experimentation needs. It also depends on the resources businesses have at hand and the maturity of their optimization programs.
To ensure your website is optimized and provides a seamless user experience, having both testing techniques at hand is key to surviving in a competitive digital world.
Both types of testing are indispensable to help you build great products that will bring in maximum revenue. The key is to use both together to heighten productivity and achieve maximum impact.
How to Leverage Disruption in Experimentation | Ben Labay
Rowan Haddad
Ben Labay outlines essential frameworks for a more strategic, tactical and disruptive approach to experimentation
With two degrees, in Evolutionary Behavior and Conservation Research Science, Ben Labay spent a decade in academia with a wide-ranging background in research and experimentation dealing with technical data work.
Now as CEO of experimentation and conversion optimization agency Speero, Ben describes his work in experimentation as his “geek-out” area which is customer experience research and dealing with customer data.
At Speero, Ben works to scope and run research and test program strategies for companies including Procter & Gamble, ADP, Codecademy, MongoDB, Toast and many others around the world.
AB Tasty’s VP Marketing Marylin Montoya spoke with Ben on how to create mechanisms for companies to not only optimize but also be more disruptive when it comes to web experimentation to drive growth.
Here are some of the key takeaways from their conversation.
Consider a portfolio way of management in experimentation
Inspired by Jim Collins’ and Jerry I. Porras’ book “Built to Last”, Ben discusses a framework that the book provides on the ways a company can grow based on the best practices from 18 successful companies.
He identifies one big pillar that many organizations are often neglecting: experimentation. To tackle this, Ben suggests taking a portfolio management way of doing experimentation made up of three portfolio tags which provide a solution spectrum around iterative changes for optimization.
The first level consists of making small tweaks or changes to a website based on customer feedback such as improving layouts and the second which includes more substantial types of changes such as new content pieces.
But there’s a bigger third level which Ben refers to as more “disruptive” and “innovative” such as a brand new product or pricing model that can serve as a massive learning experience.
With three different levels of change, it’s important to set a clear distribution of time spent on each level and have alignment among your team.
In the words of Ben, “Let’s put 20% of our calories over into iterating, 20% onto substantial and 20/30/ or 40% over on disruptive. And that map – that framework has been really healthy to use as a tool to get teams on the same page.”
For Ben, applying such a framework is key to getting all teams on the same page as it helps ensure companies are not under-resourcing disruptive and “big needle movers”. Velocity of work is important, he argues, but so is quality of ideas.
Let your goal tree map guide you
Every A/B test or personalization campaign needs to be fed with good ingredients which determine the quality of the hypothesis.
“Every agency, every in-house company researches. We do research. We collect data, we have information, we get insights and then they test on insights. But you can’t stop there.” Ben says.
The trick is not to stop at the insights part but to actually derive a theme based on those insights. This will allow companies to pick underlying strengths and weaknesses to map them into their OKRs.
For example, you may have a number of insights like a page underperforming, users are confused about pricing and social proof gets skipped over. The key is to conduct a thematic analysis and look for patterns based on these different insights.
Consequently, it’s important for companies to create a goal tree map to help them understand how things cascade down and to become more tactical and SMART about their goals and set their OKRs accordingly to organize and make sense of the vast amount of data.
When the time comes to set up a testing program, teams will have a strategic testing roadmap for a particular theme that links to these OKRs. This helps transform the metrics into more actionable frameworks.
And at the end of each quarter, companies can evaluate their performance based on this scorecard of metrics and how the tests they ran during the quarter impacted these metrics.
Build engagement and efficiency into your testing program strategy
The main value prop of testing centers around making profit but Ben advocates for a second value prop which revolves around how a business operates. This requires shifting focus to efficiency and how different teams across an organization work together.
Ben parallels the A/B testing industry with Devops as it strives to bring in elements from the DevOps cultural movement when we refer to a culture of experimentation and being data-driven. In many ways, this echoes the DevOps methodology, which is focused on breaking down silos between development and operation teams to enhance collaboration and efficiency between these teams. “The whole idea is to optimize the efficiency of a big team working together”, Ben says.
This means organizations should take a hard look at their testing program and the components that make up the program which includes getting the right people behind it. It’s also about becoming more customer-centric and embracing failure.
Ben refers to this as the “programmatic side” of the program which serves as the framework or blueprint for decision making. It helps to answer questions like “how do I organize my team structure?” or “what is my meeting cadence with the team?”
Ultimately, it’s about changing and challenging your current process and transforming your culture internally by engaging your team within testing your program and the way you’re using data to make decisions.
What else can you learn from our conversation with Ben Labay?
Ways to get out of a testing rut
How to structure experimentation meetings to tackle roadblocks
How experimentation relates to game theory
The importance of adopting a actionable framework for decision making
About Ben Labay
Ben Labay combines years of academic and statistics training with customer experience and UX knowledge. Currently, Ben is the CEO at Speero. With two degrees in Evolutionary Behavior and Conservation Research Science (resource management), Ben started his career in academia, working as a staff researcher at the University of Texas focused on research and data modeling. This helped form the foundation for his current passion and work at Speero, which focuses on helping organizations make decisions using customer data.
About 1,000 Experiments Club
The 1,000 Experiments Club is an AB Tasty-produced podcast hosted by Marylin Montoya, VP of Marketing at AB Tasty. Join Marylin and the Marketing team as they sit down with the most knowledgeable experts in the world of experimentation to uncover their insights on what it takes to build and run successful experimentation programs.
How Can Teams Use Feature Flags in Mobile App Deployment?
Rowan Haddad
In the digital age, companies can no longer only focus their efforts on optimizing for desktop especially as more and more consumers are using their mobile devices to visit websites and make purchases through apps.
However with millions of apps out there, competition and consumer demands and expectations are at an all-time high. This means your app needs to stand out in an overcrowded market.
It’s important to point out that deploying mobile apps doesn’t follow the same process as a website app.
In this article, we will investigate the challenges of mobile app deployment and release and how feature flags are the key to help you deliver optimized mobile apps that meet your consumers’ needs.
The challenges of mobile app deployment
Mobile development teams are particularly susceptible to bugs and long, tedious release cycles.
In short, there are two main problems when it comes releasing or updating features on mobile apps:
You have to wait until approval from app stores (which could take some time and significantly delay a release).
Afterwards, you have to wait for users to manually download the update from the store (which could also take a lot of time).
For example, let’s take a look at this scenario: you’re working on an update to your mobile app. You finally release it only to find out that there’s a bug you missed that’s causing your app to crash.
By the time you release a new update with a fix to the issue, wait for the release to the app store and watch for users to download the update, you might risk losing a significant number of users.
Mobile developers and engineers are all too familiar with such a scenario.
Therefore, it can be a painstakingly long process to get a release approved. Once approved, any buggy release will need to be fixed and put through the app store approval process all over again, leading to further delays.
Although the review time has improved in recent years, if your app fails to meet the app store review guidelines it may be further delayed. This means that you cannot push real-time updates to production as you would with web apps.
Put simply, the process of deploying mobile apps is not as straightforward as it might be for web apps.
Unlike web apps which are automatically updated once visitors access the site, users have to download an update of the mobile app in their store to get the latest version. As updates pile up after going through the review process, you have no control over whether users download the latest versions.
Therefore, it can take more time to deploy mobile app updates compared to web apps. And in an age where customers demand the best every time, it’s not feasible to have them wait that long for an update, especially when there’s a bug involved, much less having to wait to deploy a new app version once the bug is removed.
In modern software development, when continuous delivery is vital to retain competitiveness and meet fast-changing consumer demands, teams must turn to another solution to achieve a more frequent release cadence.
The value of feature flags in mobile app deployment and release
Unlike client-side testing where experiments are focused on web browsers, feature flags give teams the ability to carry out server-side experiments across multiple channels including mobile apps.
Feature flags allow teams to enable or disable features to users of their choosing to minimize risk and negative impact.
This is because feature flags allow you to decouple deployment from feature releases meaning you can turn functionality on or off remotely without redeploying code to app stores and waiting for its approval or having to wait for all changes to be ready at the same time to release your own changes. This way you can deploy code to whoever whenever you want.
Thus, you can upgrade your app continuously in real time based on feedback from your users without sending an app store update or waiting on its approval. You can also gradually release new features without users having to go through the hassle of always having to update their app version.
With feature flags, mobile developers can safely test in production on a pre-defined audience and disable any features with a kill switch should any issues come up, thereby reducing any negative impact. Developers can then work on pinpointing the issue and fixing it before releasing the feature to all users.
How can you use feature flags in mobile apps?
Feature flags can be used not only by developers but also by product and release managers to optimize mobile experiences in various ways.
Here are some examples of use cases for mobile feature flags:
A/B testing: With feature flags, you can divide your users into subsets with each set of users receiving a different variation of the feature. This allows you to test and determine which is the top-performing variation to roll out to all your users. Put simply, running A/B tests allow you to collect valuable live feedback from your users so you can make informed decisions about how to optimize your features and products.
Targeted rollouts: Teams can use feature flags to test out their ideas by progressively rolling out their feature, giving only a limited number of users ]early access to the app through beta testing for example. This helps generate buzz around your release and lets you monitor its impact on these select users. Targeted rollouts allow teams to make more informed decisions about what to optimize and fine-tune an app based on live user feedback.
Personalization: Feature flags are a great way to personalize experiences for different types of users rather than delivering a unified experience for all your users. By changing the features that certain users receive, you can tailor the user experience in mobile apps to individual users or user segments. For example, you can offer a unique experience based on the country the user is in.
Roll back/kill switch: What’s really unique about feature flags is that they enable teams to roll back any buggy updates quickly. By simply disabling the relevant feature flag, you can solve a bug without going through the lengthy app store review process.
Mobile feature flags: Use cases
We’ve talked mainly about how feature flags can be used in mobile app deployment but they’re also a great way to reduce risk when deploying and testing on mobile sites, especially when it comes to deep level modifications tied to back-end architecture such as testing new payment methods.
This can be easily done using a feature flagging platform, where teams can safely deploy frequent releases with an easy-to-use platform that can be used by all teams.
For example, let’s say you developed two payment features: one for desktop and one for mobile. Before doing a full release, you’re looking to test them on a small group of early adopters to monitor its impact and determine its usage rate.
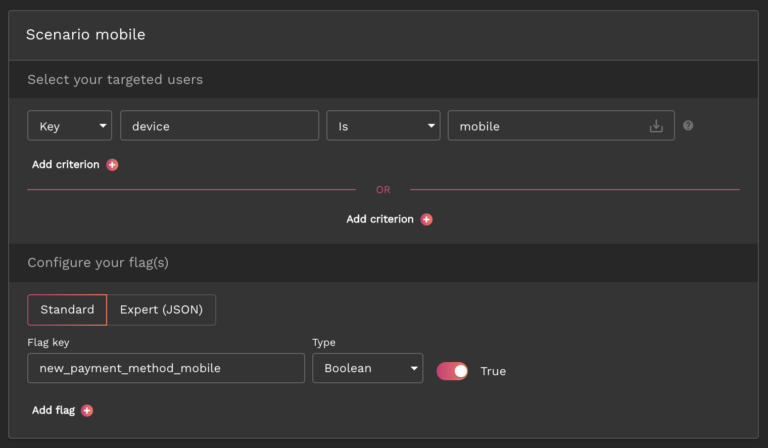
Using AB Tasty, you can easily create a Feature Toggling use case on your AB Tasty account and choose the KPI you want to follow, in this case that would be the clicks on the “Proceed to checkout” button and then “conversion rate” as a sub KPI.
You can then define the two scenarios: one to enable the feature on desktop and another to enable it on mobile devices. You will then configure the flag that will turn on the new payment method for each scenario as seen in the image below in the “Scenario mobile” on the dashboard.
Next, let’s take a look at real-life examples of how AB Tasty clients use feature flags to carry out mobile testing:
Use case 1
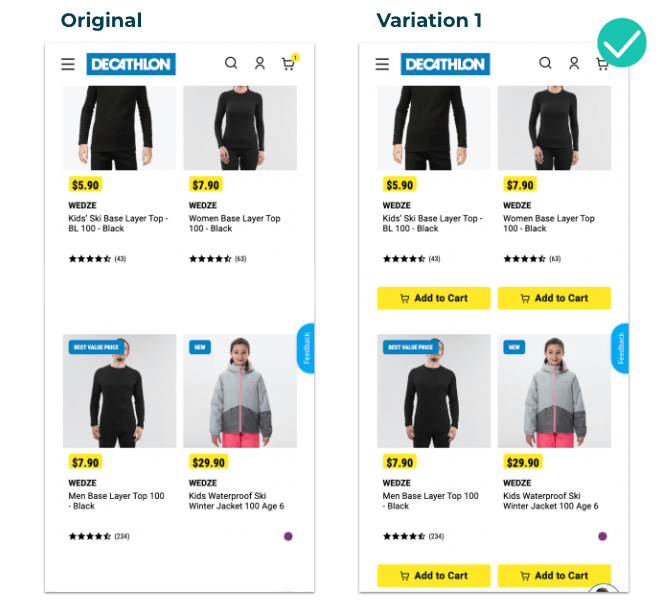
Decathlon, a French sporting goods retailer with over 2,000 stores in 56 countries, wanted to test CTA placement to measure its impact across all devices, including mobile, and product listing pages (PLPs) with the help of feature flags.
In the original version, seen below, Decathlon APAC’s team was looking to test an earlier placement of the “add to cart” button on mobile on the main page below the product image to ensure a positive rollout and measure uplift. In the original version, users had to click on the product to go to the PDP before seeing this button.
With AB Tasty’s robust solution, the team was able to test the impact of this new feature on conversion. Changing the CTA placement proved to be a success, resulting in a 10.37% increase in transaction rate and an $11.27 increase in the average order value.
Use case 2
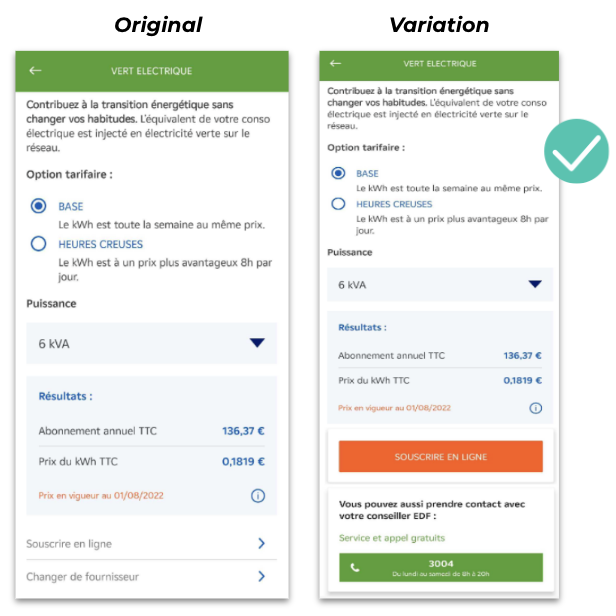
EDF (Electricité de France) is the largest electricity supplier in France for over 70 years. The team at EDF wanted to increase the number of online subscriptions and calls via their application.
In particular, they wanted to monitor the effect of changing the CTA design in the app. Using feature flags to increase the visibility of the CTAs, the team could then measure the impact on (and boost) clicks for online subscriptions and/or calls with EDF advisors respectively.
The team ran an A/B test with the subscription CTA against an orange background and the call CTA against a green background. They also added text to communicate hours of operation.
The call CTA was the one that yielded more positive results allowing the team to generate more qualified leads with an increase in calls with EDF advisors.
Thus, with a 20% increase in calls, the team could then confidently develop and roll out an adapted variation in the app where the new call CTA was more visible.
Use case 3
Often, A/B tests are a fool-proof way to eliminate potential bias and can save a company from investing in an optimization campaign that would otherwise take up a lot of valuable time and resources.
That was the case with Ornikar, a driving school platform in France with more than 2.5 million customers. The team was looking to revamp the home screen of their application and needed to identify which changes should be kept and which should be discarded.
The team set up an A/B test on AB Tasty to replace the existing carousel of four slides and two CTAs (left image) with a new screen featuring Ornikar benefits, a new CTA order and a more detailed carousel (right image).
The test was conducted for a duration of three weeks. After a week, they found that the new variation was not performing as wellas they expected so the team paused the test and adjusted the CTA and ran the test again for two weeks.
The results were still negative after two weeks and the team decided not to deploy the new home screen into production.
Due to the flexibility of the AB Tasty platform, the team was able to make quick iterations over a short period of time. Above all, Ornikar was able to avoid losing out on conversions and wasting time and resources as well as minimizing negative impact by testing the new home screen first before rolling it out to all its users.
Feature flags: The ultimate tool for better mobile experiences
As we’ve seen, feature flags are a powerful tool allowing teams across an organization to have more control over mobile testing and release while reducing risk.
Beyond giving you full control of new feature releases despite App and Play Store approval processes, feature flags enable teams to optimize their mobile apps and personalize the user experience. They also allow you to ship features more often and obtain quick feedback from your most relevant users.
With increasing mobile usage and millions of mobile apps to compete with, it’s essential to provide the very best user experience on mobile devices. Running experiments and using progressive rollouts with feature flags are key to delivering optimal and great mobile experiences.
Using a third-party feature flagging platform makes it easy to toggle features on and off and remotely configure your flags straight from the interface. By controlling all your feature flags in an easy to use web dashboard, it also ensures you’re keeping up with essential best practices to set you up for success and help you stand out from competitors.
Google Optimize is Shutting Down: Don’t Wait to Migrate
Rowan Haddad
With Google Optimize’s retirement on the horizon, companies are now faced with the daunting task of finding an alternative tool to carry out their tests and experiments after Google’s announcement that it will be sunsetting its web testing and personalization tool on September 30.
If you haven’t already, it’s time to start your research for a new tool as soon as possible to stay on track with your testing and CRO strategies. September will be here faster than you think, so you need to act soon for a smooth migration post-sunset.
Why the time to find a Google Optimize alternative is now
With roughly 6 months left, teams should already be thinking about the best way for them to carry out their experiments.
You may have to anticipate that some features on Google Optimize will no longer work properly. Not to mention that migrating from one tool to another — and the transferring of all the data — can be a complicated process.
Making an informed decision requires extensive research. Finding a platform that suits your experimentation needs is only the first step. You also need to factor in how long it will take the migration processes to be successfully completed and the learning curve of your new tool. In other words, time is of the essence if you want to make a smooth migration to a new platform.
Therefore, teams need to make sure that they have fully migrated onto their new tool well before the sunset date of September 30.
What’s next? The current and future state of your optimization journey
As a free or low-cost solution, Google Optimize is a great starting point for those at the beginning of their optimization journey.
However, in light of the sunset announcement, organizations should start rethinking their website optimization and experimentation strategies and looking ahead to anticipate their CRO needs.
This should start with evaluating your current and future CRO goals. In other words, you may look into the possibility of investing more resources to optimize your website that will enable you to turn your passive users into active ones by providing a more personalized customer journey.
Consequently, your team may want to delve into other features beyond A/B testing capabilities offered by more advanced solutions. This will enable them to better optimize the website. For example, you may consider venturing beyond surface-level modifications and running more sophisticated tests tied to back-end architecture.
This will ultimately allow teams to provide the best customer experience possible so visitors can turn into customers with the click of a button.
Put simply, engaging your visitors along the entire customer journey up until the point of purchase or conversion should be a central part of your CRO strategy.
Taking into account all these factors will help you understand the current state of your CRO and whether it’s time to take your optimization roadmap to the next level.
How to prepare for a successful migration post-sunset
Selecting the right tool will take considerable time in terms of research and set-up. Therefore, early on, teams will need to follow some crucial steps to take them on the right track to a seamless transition from Google Optimize and to ensure successful implementation of the new tool.
Here’s a checklist for a successful migration:
Evaluating your experimentation program: Analyzing your CRO strategy and results is important to help you set the requirements for your next testing tool.
Considering your CRO strategy and budget: This will help you determine what kind of features you need and how scalable it is and the kind of budget you need to execute it.
Selecting the tool: Evaluating alternative testing tools to suit your budget and needs (you may consider looking into Google-preferred partners for a smoother transition).
Setting up and installing the tool on your website: This will include migrating all your data and tests from Google Optimize. You should consider if you will need coding experience and if you have sufficient developer resources for that. Otherwise, you should consider opting for low-code/no-code solutions instead. Additionally, you will need to run A/A tests to get acquainted with the new platform and ensure that it’s working as expected when it comes to data accuracy and level of significance.
Integrating the tool with your stack: Take into account the tools you’re currently using and how they will fit together with the new tool.
Offering internal training for the new tool: Depending on the kind of support you’ll be receiving from your new tool, you need to make sure that your teams can easily and efficiently use the tool.
Evaluating your experimentation program means taking stock of all the tests you’ve run on Google Optimize to understand what went well with the tool and where it fell short. This will give you an indication of your current situation and how you’d like to evolve when it comes to your testing strategy so you can pick your new tool accordingly.
Each step can take a considerable amount of time to complete so we recommend starting as early as possible.
How AB Tasty fits into your post-Optimize world
As a Google-preferred partner, AB Tasty provides you with best-in-class experience optimization tools to continue optimizing your digital experiences.
While Google Optimize also offered a 360 version with more advanced features, it had its limitations, especially for companies further along their CRO journey and looking for deeper experimentation capabilities.
Here are a few reasons why AB Tasty is the right choice post-Google Optimize to empower you to animate the entire digital consumer journey and take your testing to the next level:
AB Tasty offers a variety of integrations that will fit seamlessly into your existing tech stack including seamless integrations with Google Analytics and other analytics providers to help you stay on top of your data.
Explore endless possibilities with a library of widgets to optimize the customer journey. Activate your audience and engage users with banners and pop-ups among other flexible, visually appealing and impactful components.
Worried about support during your switch? AB Tasty has dedicated CSMs and account managers to provide you with 1:1 support throughout the contract, including transferring your test history and data over from Google Optimize.
Take the next big step with AB Tasty
Are you still on the fence on whether AB Tasty is the right pick for you? Below you will find the answers to all your burning questions about our platform to help make your decision easier:
We’re here to answer your questions
What is AB Tasty’s take on privacy and security?
AB Tasty is GDPR compliant and committed to respecting the principles of this legislation, which consists of regulating data collection.
Can I use AB Tasty to target Google ads campaigns?
Yes, campaigns from Google ads can be easily triggered. With AB Tasty’s granular targeting capabilities, customers can target their visitors based on the campaign source in conjunction with any other events or metrics they see fit to provide the most personalized end-user experience possible.
What type of support do you offer in setting up and migrating to your tool?
Our in-house Customer Success team is on hand to support new and existing clients. If you need assistance setting up new campaigns or transferring existing ones then we can take on the heavy lifting for you to ensure a smooth transition.
Can you link Google Analytics with AB Tasty?
Yes, you can link Google Analytics with AB Tasty to be able to analyze your campaigns or you can have them sent to an in-house tool. You can find more information about our Google Analytics integration here.
How can we set up segmentation and personalization campaigns?
AB Tasty has a wide range of extremely granular targeting capabilities. This allows customers to target their visitors based on any other criteria/events/metrics of their choice to provide a more personalized user experience. This can all be set up in a matter of seconds with no code required.
How does AB Tasty differ from Google Optimize in terms of speed and performance?
AB Tasty has the lightest tag on the market available today that still offers complete functionality. Alongside our detailed performance centre which highlights where improvements can be made, customers can expect greater performance from AB Tasty than they ever had with Google Optimize. Find out more about how we compare here.
How many tests can I run and can they be run concurrently?
With our user-friendly experimentation suite, you can create an unlimited number of A/B tests and you can also run multiple tests simultaneously if needed.
Are you ready to make the move?
The post-Google Optimize world doesn’t have to be bleak.
As one of Google’s top picks as your new A/B testing platform, AB Tasty is a best-in-class A/B testing tool that helps you convert more customers by leveraging experimentation to create a richer digital experience – fast. This experience optimization platform embedded with AI and automation can help you achieve the perfect digital experience with ease.
In an age of rapidly changing demands and high competition, it’s imperative for all businesses to understand how well they’re performing and whether they’re moving in the right direction towards accomplishing their objectives and fulfilling customer needs.
To accomplish that, these businesses will need KPIs in the form of actionable data to give insights for every department on how successful they are in reaching their goals. These KPIs can take on various forms depending on the needs and circumstances of each business.
Put simply, KPIs are performance metrics that measure performance based on key business goals that are used as indicators into what your organization needs to achieve to reach its long-term objectives and make more informed strategic decisions.
Thus, their purpose is to provide data on various aspects of a business. In this article, we will focus on the KPIs designed to measure the core of your business: your products. In particular, we’ll be looking at how to measure the success of new features of your products to determine whether they have the intended impact on your business (and your customers).
How to measure new feature success
More often than not, product teams are working on optimizing and updating an existing product based on customer feedback. This means that new iterations of a product are released in the form of features.
We always hear about how to measure the success of new products but measuring the success of individual product features is just as important so teams are not wasting valuable resources by developing features that are actually not being used.
This article will go through some of the key KPIs that teams should be tracking to measure the success and performance of new features to ensure it meets consumer expectations.
Any feature you release should be tied to and aligned with the overall business objectives and consumer needs. This will then serve as the foundation for defining what the criteria for success look like.
Afterwards, you can determine the KPIs that will help you track the success of your product features, which are related to your organization’s overall OKRs and to analyze the impact your features have on your business post-launch.
Each KPI should have a threshold which is considered as good or poor performance and an action plan should be put in place in case a feature is not performing as well as expected.
Before going further into the typical KPIs to track for feature success, remember that the KPIs you choose should be: measurable, specific, relevant, actionable and align with overall business strategy and outcomes.
Setting the right KPIs early on is essential as they allow product managers to evaluate feature usage, engagement and user experience to gauge its success depending on what the objectives are. It gives teams a framework to start measuring the things that matter most to your business in order to make better informed decisions (and build better features).
In sum, to determine new feature success, you need to consider the following points:
The goal of the new feature– once you narrow down the objective of your new feature, it’ll be easier to determine which KPIs you need to focus on. Remember that your feature goal should be aligned with the larger business or product goals and overall product vision.
What KPIs to monitor
What success looks like– this will primarily depend on the goal of your feature.
The next section will highlight some of the key KPIs that will help you determine the success of your new feature.
Key KPIs to measure feature success
Usage KPIs
Active users
To analyze user engagement, you could start by looking at the number of active users who are using the feature. Active users are those who engage with your new feature and perform some kind of action. In other words, they are actively using the feature.
These can be divided into three categories:
Daily active users (DAU)
Weekly active users (WAU)
Monthly active users (MAU)
Session duration
You can also track session duration to measure the total time spent by a user using the feature. It can also give you an indication into how much a user enjoys the experience of using the new feature- whether they’re leaving right away or actually spending time using it.
The best way to measure session duration is to calculate the total time users spend in your feature divided by the number of users in a given time frame. You can then take the mean value to find the average time spent using your feature in a given session.
Average Session Duration= Sum of Individual Session Lengths / Total Sessions During that Time Frame
Number of sessions per user
You may also want to look into the number of sessions for each user in a given time period to hone in on those users that are using your feature more than once every day. Thus, this can reveal the popularity of the feature since the more a customer interacts with your feature, the more likely they are to remain an active customer.
To obtain this figure, calculate the total number of sessions in a given period divided by the total number of users in that same period.
You can also consider collecting their feedback to gain insights on what they like about your feature and the value they get from it, particularly from those who spent a considerable amount of time using the feature.
Customer KPIs
Customer retention
This refers to the percentage of customers retained within a specific time period. Tracking this KPI will help you determine how well your new feature resonated with your customers and whether it helped to improve retention.
This can usually be calculated by picking a certain period that you want to measure and then finding the numbers for:
Customers you had at the beginning of that period
Customers at the end of the same period
New customers added in that period
Customer Retention Rate= Total Number of Customers at the End of a Period – New Customers Acquired/Customers at the Start of the Period
Customer churn rate
Unlike retention rate that measures the percentage of customers who stayed, churn rate measures those you’ve lost.
A high churn rate usually indicates that your feature or product is not delivering the value expected and not fulfilling your customers’ needs. For example, if you measure churn rate after introducing your new feature, it can give you insight of how satisfied they are with this feature and how well it resonated with them.
To calculate customer churn rate, you start by finding the number of customers lost during a certain period of time and divide it by the total number of customers at the beginning of this period.
Customer Churn Rate = Customers Lost / Total Customers
Customer satisfaction
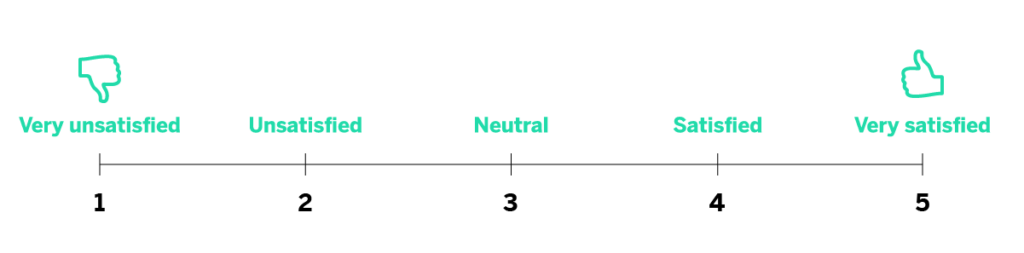
Using the Customer Satisfaction Score (CSAT), you can measure how satisfied your customers are with a specific feature- user sentiment.
Using a customer satisfaction survey, customers can rate their satisfaction on a scale from 1 to 5 with 5 being “very satisfied” (or sometimes on a scale of 1-10) as seen in the image below. The satisfaction score can then be calculated by dividing the number of satisfied/happy customers by the total number of responses.
For example, if the rating is from 1-5 then you would typically be collecting the total number of 4 and 5 responses for the “satisfied customers”.
CSAT score: (The Total Number of 4 and 5 responses) / (Numberof Total Responses) x 100 = % of Satisfied Customers.
Thus, a CSAT survey could be used to ask customers to rate their experience with a new feature. Make sure you also follow up on low CSAT scores by reaching out directly to these customers to find personalized solutions to any issues they’re facing.
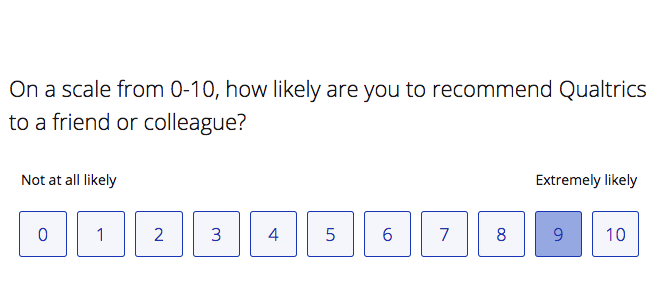
Net promoter score
The Net Promoter Score (NPS) determines customer satisfaction and sentiment by measuring how likely customers are to recommend your product to others on a scale from 1 to 10.
The NPS score can be calculated by subtracting the percentage of detractors– those who give a score of 6 or lower- from the percentage of promoters– those who give a score of 9 or 10.
While NPS is usually used to gauge sentiment for your product as a whole and overall customer experience, it can still give you an idea of how happy customers are with your product and could give you insight on how to improve it (by introducing new features, for example). This can be done by following up on customers’ responses to find out why they feel that way and the kind of features they’d like to see introduced to enhance the user experience.
Why is measuring success important?
As we’ve seen, there are a number of KPIs (among many others) you can track to measure your new feature’s success.
But, why is this so important?
The simple answer is that you’ve invested time, money and valuable resources to build this feature and so if it’s not performing as expected then it’s crucial to look into why that is in order to improve it (or in the worst case scenario, remove it altogether).
To delve deeper into the importance of measuring new feature success, tracking KPIs will help you stay on top of whether customers are actually using the new feature. For example, the usage KPIs discussed above will allow you to deduce whether your feature is receiving enough engagement from customers.
Setting clear KPIs and designated thresholds for these KPIs as well as an action plan early on will enable teams to ascertain a feature’s performance shortly after it’s released and make informed decisions quicker and more effectively.
Once you’ve decided on the KPIs you want to track, you should start thinking about the kind of tools you will use to gather the necessary data. This will depend on factors such as the resources you have at your disposal and how complex the KPIs you want to track are.
After collecting all the essential KPIs, it’s the product manager’s responsibility to provide information about the performance of the new feature and insights gained to all the relevant stakeholders.
Tips to ensure new feature success
Announce new features
The first step to ensuring the success of your new feature is to bring awareness to it. This means you should make sure you let users know that you’ve launched this feature by using multiple channels such as on your blog, social media or through in-app announcements.
This may not be necessary for every feature release. In other words, you want to be careful about sending out too many notifications about new releases so often, which could have the opposite effect and put off customers.
In your announcement, make sure you explain your feature in-depth; in other words, how it works and how it will change the user experience.
This is also a chance to collect valuable initial feedback that you can use to optimize your feature.
However, bear in mind the audience you want to target with your announcement. Some user groups may be more relevant than others for a particular feature release. Thus, be selective when it comes to bringing awareness to your new feature.
Set up tutorials and webinars for educational purposes
A great way to explain to your customers the value your feature brings to them is by releasing tutorials and organizing webinars to give a deeper look into the new feature.
This is a great way to get up-close and personal with your customers and have one-on-one interactions about the feature and get the in-depth feedback you need to optimize your features.
Segment users and gather their feedback
Once you start tracking KPIs, you will be able to determine what kind of users are most engaging with your new feature. You can segment users and place them into different groups such as those who engaged with your feature more than once, those who engaged once and those who have never used the feature.
Segmenting users this way will allow you to identify a usage pattern so you can deduce what kind of users are most likely to use your feature and allows you to collect actionable feedback from each of these segments to better understand how your new feature is being adopted (and why it’s not resonating with some).
While KPIs and metrics give you raw data to monitor what your users are doing, it’s important to put this data into context to get to the why.
Therefore, collecting feedback will help you iterate and optimize your feature for better results. It could also give you great insight on how to convert infrequent users of your feature to more engaged users, for example.
Opt for a “soft” launch
Sometimes, releasing a brand new feature may be a risky move. In this case, you might want to consider releasing this feature to a pre-chosen subset of users to collect their feedback and improve the feature based on the feedback before going for a full release.
For example, you could test internally within your organization. This way, internal teams can test out the new feature and learn more about it regardless of whether or not they interact directly with customers. This is also a risk-free release as you’re only testing within your teams, who in turn can give you the right kind of feedback to optimize your feature before releasing externally to customers.
Afterwards, you might still be wary about releasing your feature to all your customers. Luckily, there’s a foolproof way to release to a small number of your target audience and that’s through feature flags.
Feature flags allow you to put your feature behind a flag and toggle it on for a group of users to test it and monitor their experience and collect feedback by testing live in production.
KPIs provide you with an essential framework to help measure feature success and allow you to identify areas for improvement to ensure customer satisfaction and loyalty.
As already discussed, there is no one-size-fits-all approach when it comes to choosing the right KPIs. It will largely depend on your feature goals, your overall objectives and the industry you’re in.
However, it’s best to make sure that they are not only aligned with your product and business goals but should also be focused on customer satisfaction and value. Ask yourself what you really want to learn from these KPIs and remember to put the user at the heart of whatever KPIs you end up choosing.
Tracking feature performance (and measuring its success) early on- or shortly after release- will put you on the right path to customer satisfaction and retention. With any feature you release, it’s important to look for ways of improvement and find the right audience that will most likely find value in it and use it.
However, remember that KPIs are valuable but are not sufficient on their own unless teams can extract learnings and insights from them as well as give context to them in order to drive your future planning and deliver better value to your customers.
With the rising popularity of DevOps practices in the modern software development world, it’s no surprise that there’s a lot of myths surrounding the concept of DevOps.
In other words, there’s a lot of confusion about what this concept entails. What does it actually mean when we talk about a DevOps team or organization? Even with its widespread adoption and implementation, there are many misconceptions and confusion as to what the term actually means, how it can be implemented and by whom.
However, one thing’s for certain. DevOps, when properly implemented, can bring a great number of benefits and value to teams and customers alike. Thus, this article seeks to address its most common misconceptions so teams can better understand this concept and reap its benefits for more efficient and streamlined processes.
Before we get started, let’s quickly go over what DevOps actually is to allow us to debunk its most common myths.
DevOps, from its name, comes from a combination of development and operations with the purpose to promote better collaboration and break down communication barriers between these teams for enhanced productivity.
Today, DevOps has become an umbrella term for an approach which encompasses a set of tools, practices and culture that aim to increase teams’ ability to deliver higher quality software quickly to end users.
Next, we will dispel some of the most common myths about DevOps to help shed light on this concept and get the most value out of it in your own organization.
Myth 1: DevOps is all about the tools
Often, the first question that comes to mind when we hear DevOps is which tools an organization is using or which are the top tools for teams to adopt during their DevOps journey.
However, it’s important to take a step back and look at the bigger picture to understand the real value behind the DevOps methodology.
DevOps is more than just a list of tools to adopt for your software development practices. It’s an approach that brings teams together to deliver more value to end users.
In that sense, DevOps foremost starts with people. It’s about building the right mindset and culture to promote better collaboration so that teams no longer work in silos. Once you’ve established those, you can then choose the right tools that fit in with your team and processes.
It’s up to the leaders in an organization to lay the foundation to build this culture of DevOps and inspire their teams to adopt the values of DevOps which will then allow them to implement them in their daily workflows in order to build better software to meet customer demands faster.
Myth 2: DevOps and CI/CD are one and the same
While CI/CD are essential processes to successfully implement DevOps, these are not the only components that make up this methodology.
Yet, there are many that confuse the two and believe that DevOps and CI/CD are the same thing.
It’s true that the continuous integration and delivery of software indicates that an organization has adopted a key principle of DevOps but as stated above, the concept goes beyond just the tools and processes and focuses primarily on establishing the right culture and mindset for all these key components to thrive.
CI/CD processes help enable this culture by providing a set of tools that emphasize automation but they are only a part of the DevOps methodology.
It’s important to remember that DevOps grew from a need to create cross-functional teams that can effectively collaborate and communicate throughout the software development lifecycle.
Therefore, CI/CD provides the tools necessary to streamline your software delivery process but it’s only a means to an end. Instead, organizations should focus on bringing together the right combination of people, processes and tools to truly embrace the DevOps methodology.
Myth 3: DevOps is a replacement for Agile
The methodologies of DevOps and Agile are sometimes confused to the point that some claim that DevOps is replacing Agile or believe that the two terms are interchangeable.
In fact, DevOps and Agile can be seen as complementary rather than synonymous; the two are not mutually exclusive and both can exist separately in an organization.
The underlying goal of both is to improve the software development process to deliver products quickly and efficiently.
However, Agile provides a framework that enables teams to break down projects into manageable chunks or “sprints” through iterative development to respond quicker to fast-changing consumer and market needs.
DevOps, for its part, is focused on breaking down silos between development and operations to allow for quicker releases through the use of tools and a fully automated pipeline. It also goes beyond the delivery process and refers to an entire culture that should be adopted within an organization.
You can look at Agile as a methodology for developing software while DevOps as a set of practices for delivering software that necessitates a cultural shift. Both still focus on speed and collaboration.
In that sense, they are complementary approaches-as DevOps enables and builds on Agile practices. Incorporating both into your daily workflows will help improve the efficiency of your software development processes.
Myth 4: DevOps is the answer to all problems
It’s a common misconception that just because you’re implementing DevOps practices within an organization, nothing can ever go wrong. However, you can’t just automate everything and believe that everything will go smoothly.
DevOps also involves developing the right strategy and incorporating the right tools to drive processes that are managed by the right people. If your team isn’t ready to move with the velocity required for these tools to function appropriately then it’s likely your shift to DevOps will only lead to disaster.
DevOps should also go beyond just automation and should incorporate continuous feedback loops from automated processes that developers can use to improve and optimize products.
Myth 5: DevOps means releasing new software non-stop
On the same note, just because DevOps places emphasis on all things continuous, this doesn’t mean that it is a guarantee for non-stop releases.
It’s important to note that the idea of “continuous” shouldn’t be taken too literally. When we say continuous, it rather means that teams have established processes in place that enable them to ship new releases confidently whenever needed. It’s about keeping your code in a constant releasable state so that teams have the confidence and ability to release as often as they want.
Depending on the organization and team objectives, this could mean releasing new software anywhere from several times a day to once a week or every two weeks.
The ultimate goal of DevOps is smaller, more frequent releases but this should never be at the expense of quality. After all, DevOps may be about speed but it’s also about releasing higher quality products to deliver enhanced value to customers.
Myth 6: DevOps engineer is the only means to a DevOps transformation
You can’t hire a DevOps engineer and claim you now have a DevOps team and culture. Similarly, you can’t hire a bunch of engineers, call it a DevOps team and be done with it.
More often than not, DevOps requires a complete organizational transformation with top-down motivation. This means that to successfully adopt DevOps, it’s up to leaders to lay the foundation for DevOps to thrive and aid with the cultural shift that accompanies it.
Undoubtedly, having a DevOps engineer will help facilitate the adoption of DevOps practices with their deep knowledge of DevOps and its tools and can serve as a link between teams to enhance collaboration. However, the fact of the matter is anyone can learn and then implement a DevOps methodology with the right training, tools and leadership.
DevOps engineers cannot single-handedly spearhead this transformation. The true secret to success when it comes to DevOps is how efficiently the different teams within an organization follow DevOps practices through top-down motivation as well as providing teams with the necessary resources in order to perform their job effectively.
Myth 7: DevOps only applies to development and operations teams
It’s natural to conclude that DevOps, which comes from a combination of development and operations, applies only to these two teams within an organization. We can even go so far as to say that this myth does have some truth to it.
While it’s true DevOps grew out of a need to enhance collaboration between these two teams, it has greatly evolved since then and is no longer confined to them.
Nowadays, DevOps encompasses teams from across the whole organization, which means that DevOps practices and principles can be applied and used as a way to empower all teams from engineering to sales and marketing. In other words, DevOps applies to each and every team or all stakeholders involved in the software development and delivery processes.
At the end of the day, DevOps is about cross-functional collaboration and working together towards common goals. In that sense, DevOps today can apply to the whole organization and not solely to development and operations teams. With the right training, any team within your organization can take up and successfully implement DevOps practices and reap their benefits.
DevOps can bring real value to organizations when properly implemented
There are many misconceptions about DevOps which makes sense given how popular it’s become but it’s important to be aware of these misconceptions to get the most out of the DevOps methodology.
It’s important to remember at the end that DevOps is not magic or a quick fix for all problems that come up. DevOps should be foremost people-focused but if you’re not willing to change your processes and undergo a cultural transformation in your entire organization then creating a DevOps team and calling it a day just won’t cut it.
DevOps is not only about collaboration and breaking down silos between teams but it’s also about providing these teams with the resources and foundation necessary to be able to successfully adopt DevOps practices in their day-to-day operations.
However, one thing that most can agree on is that DevOps can bring value to teams when implemented correctly. This will also depend on your own organization’s unique needs. What works for one organization may not work for another.
Make sure that you carefully assess your processes, teams and culture as a whole to understand whether it would make sense to take the plunge and adopt a DevOps methodology for your team and your products. Only then can the transformation truly begin.
Nowadays, as software development processes become more decentralized and as the number of teams working on different projects (in different places too) increases, it becomes that much harder to set and track metrics to measure performance across these teams.
And yet data is now more important than ever. Data is a company’s most valuable asset in order to measure how efficiently teams are performing over time to deliver the best products and user experience to customers.
This is especially relevant for DevOps teams where there’s a need for a clear framework to measure their performance.
This is where DORA metrics come in.
What are DORA metrics?
DORA metrics provide a standard framework to help leaders who are implementing a DevOps methodology in their organization to measure the performance of their teams.
This framework was the result of a six-year research program conducted by Google Cloud’s DevOps Research and Assessment (DORA) team after analyzing survey responses from over 32,000 professionals worldwide. Their goal was to determine the most effective ways to develop and deliver software.
Through the use of behavioral science, the research identified four key metrics that would indicate the performance of a software development team.
With these metrics, teams can measure their software delivery performance, monitor it over a period of time and be able to easily identify areas of improvement to optimize performance. In that sense, they shed light on the capabilities that drive high performance in technology delivery.
Therefore, DORA metrics are especially relevant for DevOps teams as they provide them with concrete data to measure performance and improve the effectiveness of their DevOps operations. It also allows them to assess whether they are building and delivering software that meets customer requirements as well as gain insights on how to improve and provide more value for customers.
The four DORA metrics
In this section, we will list the four main metrics that the DORA team identified for DevOps teams to measure their performance.
The following chart shows from the 2022 State of DevOps report, updated each year, shows the ranges of each metric according to the different categories of performers:
The four key metrics used are:
Deployment frequency
Deployment frequency measures velocity. In this case, the goal is to measure how often an organization successfully deploys code to production or releases it to end users.
This is an important metric particularly for DevOps teams whose ultimate goal is to release software quickly and frequently. It helps teams to measure their productivity and agility as well as uncover issues and bottlenecks in their workflow that may be slowing things down.
High performing teams deploy on-demand, multiple times a day. Thus, this metric stresses the importance of continuous development and deployment, which is one of the principles of a DevOps methodology.
Each organization will need to consider what constitutes a “successful” deployment for its teams such as taking into account what level of traffic is sufficient to represent a successful deployment.
How to improve this metric:
To enhance this metric, it’s usually best to ship code in small batches on a frequent basis. This will allow you to reduce risk of deploying bugs and increase speed of delivery. Implementing an automated CI/CD pipeline will also enable you to increase deployment speed.
Lead time for changes
Lead time for changes is the amount of time it takes a commit to get into production. Therefore, this metric also seeks to measure velocity and gives an indication of a team’s cycle time. The lower the lead time for changes, the more efficient the team is at deploying code.
This metric requires looking at two pieces of data: when the commit happened and when it was deployed. The goal is to keep track of the time development starts until the committed code is finished and deployed to uncover any inefficiencies in a team’s processes. The average time can then be used to analyze overall performance.
In other words, the purpose of this metric is to give an indication of the waiting time between the initial stages of implementing the change and deployment. A high lead time may suggest inefficiencies in the CI/CD pipeline and not enough automation, especially if every change has to go through manual testing instead which significantly slows things down.
How to improve this metric:
Again, here it’s best to work with smaller changes. This allows for faster feedback so developers can immediately fix any issues. Teams should also eliminate bottlenecks and integrate automated testing at every stage of the CI/CD pipeline to detect issues early on.
Feature flags are also a great tool to lower lead time as any unfinished changes can be hidden behind a flag while other changes can be deployed.
Change failure rate
This represents the number of deployments causing a failure in production. In other words, it measures any changes to code that resulted in incidents, rollbacks or any other failures. This depends on the number of deployments attempted and how many of those resulted in failures in production.
As a result, this metric is a measure of the stability and quality while the previous two focus mainly on speed of software delivery.
This metric requires the number of deployments that resulted in failures divided by the total number of deployments. The percentage calculated will give insight into how much time is dedicated to fixing errors as opposed to delivering new code.
The lower the rate the better. High performing teams have a change failure rate of 0-15%.
Consequently, teams with a low change failure rate is a sign that these teams have an efficient deployment process in place, which can be mainly achieved through automating every step of the process to avoid common manual errors.
It’s important to note, however, that this metric can be hard to quantify as the definition of failure can vary widely. Therefore, it’s best for each organization to set goals for its teams according to their unique business objectives.
How to improve this metric:
Automation is crucial to also help improve this metric. Automated tests can evaluate code at every stage in its development. This way, issues are caught and fixed early on so they’re less likely to make it to production. Creating critical feedback loops are necessary to get a low change failure rate to prevent incidents like this from happening again in the future.
Time to restore service
Also referred to as “mean time to recovery MTTR”, this indicates how long it takes for an organization to recover from a failure in production that impacts user experience.
This metric, like change failure rate, is meant to determine the stability of a system or application when unplanned outages occur. Thus, information about when the incident occurred and when it was resolved then deployed will be needed to measure the time to restore service.
Therefore, the “time to restore service” metric is important as it encourages teams to build more stable systems and create action plans to be able to respond immediately to any failures. High performing teams will resort to deploying in small batches to reduce risk while increasing speed of delivery.
This is particularly applicable to DevOps teams as they place high emphasis on the idea of continuous monitoring, which will in turn help them to improve their performance when it comes to this metric.
How to improve this metric:
Consider using feature flags. Feature flags act as switches enabling you to turn a change on or off in production. This means that if any issue occurs, you can toggle the switch off if something goes wrong with a change in production with minimal disruption while it’s being resolved. This will then help reduce your MTTR.
The DORA metrics can then be compiled into a dashboard. To do so, DORA created the Four Keys dashboard template to generate data based on the metrics and visualize the results. See example below of this dashboard:
The dashboard gives a higher-level view for senior stakeholders of their organization’s DORA metrics to understand how their teams are performing and what corrections can be done to remedy any problems.
Why are DORA metrics important?
As we’ve already mentioned, DORA metrics are a great way to keep track of the performance of DevOps teams and identify areas of improvement.
It helps organizations assess their delivery process and encourage teams to streamline their processes and increase the speed of delivery while maintaining quality.
As a result, the main benefits of these metrics are:
More effective decision-making– with the data acquired from these metrics, teams know what aspects to focus on that need improvement. Teams can easily detect issues and bottlenecks within the software development process and devise an action plan to address them. Decisions will be based on data rather than opinions or gut feelings which may be misleading.
Better value- DORA metrics will give teams an indication whether they’re delivering value to customers by evaluating the efficiency of your value stream and finding areas to improve within your delivery process to build higher quality products.
Continuous improvement- this is particularly important as it is one of the main pillars of a DevOps methodology. Using DORA metrics, the team gets insight on their performance and set goals to improve the quality and delivery of software.
Challenges of DORA metrics
DORA metrics have a lot of advantages, but they do come with their own challenges as well.
One of the main challenges when faced with these metrics is that they will vary across organizations and teams as, often, they have different definitions and processes in place. In other words, no products or teams are the same and may operate at their own level of complexity. As a result, it’s important to put this data into context before making decisions.
DORA metrics give a good overall picture of how teams are performing in certain categories. This means that it’s important to have a valid way to keep track of the data but don’t rely solely on them.
Teams may be facing issues beyond what is accounted for in these metrics. DORA metrics are focused mainly on the bottom line instead of the inputs and processes that lead to the outputs being measured. Sometimes, there’s more to the story than what DORA metrics measure so tread carefully.
Ultimately, enhancing performance will be unique to each organization. Work on shifting your attention to your team and goals to give context to the story all these metrics are telling. Focus on building the right culture for your team and providing them with the tools they need to enhance performance. This, in turn, will help them deliver business value faster.
DORA metrics: The key to unlocking more value
DORA metrics are a great starting point, especially to help teams make informed decisions about what can be improved and the steps to take to achieve that.
They give a good indication of a team’s progress along their DevOps journey and encourage the implementation of the key principles of DevOps including shipping in small batches more frequently.
In particular, it enables them to assess and analyze the efficiency of their development and delivery processes by offering a framework for measuring performance across two important variables in DevOps: speed (deployment frequency & lead time for changes) and stability (change failure rate & time to restore service).
Teams will then be able to create more value for their customers faster. Above all, DORA metrics are a way for teams to shift their focus to maximizing velocity and stability.
It’s important to note that tracking these metrics should be in line with your organizational goals and customers’ needs to give context to these metrics, make sense of them and improve them.
Feature flags are also another effective way to improve performance across these metrics. They will allow you to ship new changes in small batches and hide any that are not yet ready to speed up deployment while reducing risk of big bang releases making problems easier to detect and resolve.
Test More, Risk Less: A/B Testing as a Risk Mitigation Tool
Rowan Haddad
Imagine this: You see a continual drop in conversions on your e-commerce website. In particular, customers are abandoning their carts and not completing their purchases.
Based on previous experience, you decide to take action by switching up a few elements on the checkout page.
But it’s still not getting you the results you’ve hoped for; instead, you see your conversions going even further down. What went wrong?
How experiments can come to the rescue
There’s always a certain degree of risk in business and any wrong move can be a potential loss in profit. How can you test your ideas without breaking your website and negatively impacting your business?
Thanks to A/B, A/B/C and multivariate testing, you can manage and even reduce that risk before making a big decision that could hurt your bottom line.
Before we go any further, let’s look at a simple definition of A/B testing.
A/B testing is a marketing technique that involves comparing two variations or versions of a web page or application, randomly presented to users, to see which performs better by evaluating how they impact your KPIs.
The results of such tests will help you assess the risk of your business decision as it presents an opportunity to gather feedback from the people with the most valuable opinions — your customers. Otherwise, you’d make the decision based on personal opinions rather than customer preferences, eventually leading you down the wrong path.
A/B testing helps steer you in the right direction by enabling you to test and learn quickly if something works or not before embedding it into the back-end or permanent coding.
If you don’t take steps to manage risks, you’d never be able to tell if your new ideas will resonate with your customers or if they’re worth the investment. However, when you run A/B tests, you can minimize the risk of any drastic business impact.
For example, you can make a pretty website by changing colors but if this change drives down conversions then you’ll have a nice looking but poor performing website. Thus, A/B testing gives you the green light to go through with an idea by monitoring how it’s affecting your KPIs.
Experimentation is the most efficient way to eliminate rolling out a bad idea for your website or prove the value of a change before investing time and resources. It’s a golden opportunity to learn what really drives conversions so you can use the data extracted to fully commit to any changes in UX.
Even if an experiment doesn’t turn out the way you planned, you can still use it as a learning experience on what your customers don’t want so that you stay on the right track.
To get the most out of your A/B tests, you need to leverage both quantitative and qualitative data when it comes to effective decision-making. In other words, running these experiments is important, but it’s the quick steps you take after based on the results that will make all the difference.
AB Tasty is a great example of an A/B testing tool that allows you to quickly set up tests and gather results to help you mitigate risk with ease. With low code implementation of front-end or UX changes on your web pages, you can gather insights via an ROI dashboard, determine which route will increase your revenue, and achieve the perfect digital experience for your customers.
In summary, always make sure you test new features or changes prior to release to make sure they take your business metrics in the right direction. Even if it seems like it’s a very minor change, it could still have a significant impact on your conversions and revenue.
Steer your A/B test in the right direction
While you’re running an experimentation campaign, there’s also another layer of risk when randomly allocating users to your variations as so often happens to be the case during an A/B test. What if there’s a variation that you notice is performing poorly? How can you quickly turn this off before more traffic is exposed to the variation?
Luckily, there’s a way to further minimize risk during an A/B test and that’s through dynamic allocation, a capability offered by advanced A/B testing solutions such as AB Tasty.
Dynamic allocation seeks to limit loss due to the lowest performing variations so that fewer visitors are sent to the “bad” variations to maximize outcome, as can be seen in the image below.
For example, if you run an A/B test with two variations with the goal to increase conversions on the checkout page and variation B is performing well and has a high conversion rate, then the traffic to that variation is adjusted (and increased) accordingly.
One of the advantages of dynamic allocation is risk mitigation. This will enable you to confidently and safely test new elements. If they don’t work out as predicted, then the traffic allocated will be gradually reduced so fewer users will access it.
Make risk-free and data-driven decisions with A/B testing
Any new changes or releases you have in the works shouldn’t be driven by your gut feeling but rather from a combination of quantitative and qualitative data, the kind of data and insights that you can only obtain from running tests and experiments. This enables you to optimize your website accordingly rather than speed up losses from a misguided UX change based solely on personal opinion.
A/B testing doesn’t have to be a risky endeavor. Features such as dynamic allocation can make all the difference when running A/B tests to avoid any significant loss in conversions from a poorly performing variation.
In the end, it’s a win-win situation: you get valuable insights while managing risk and your customers receive higher-quality products they actually want resulting in enhanced customer satisfaction.
With AB Tasty, you never have to lose a single conversion. Get started building your A/B tests today with our best-in-class software solution to explore how you can get maximum results with minimal effort thanks to our dynamic allocation capability.