Testing doesn’t have to feel like guesswork.
What if you could describe your vision and watch it come to life? What if understanding your visitors’ emotions was as simple as a 30-second scan? What if your reports could tell you not just what happened, but why it mattered?
That’s where AI steps in – not to replace your creativity, but to amplify it.
At AB Tasty, we’ve built AI tools that work the way teams actually think: curious, collaborative, and always moving forward. Here are nine features that help you test bolder, learn faster, and connect deeper with the people who matter most.
Insight: If you’re already an AB Tasty customer, you’ve already got access to some of our most popular AI features! But don’t stop scrolling yet, there’s more to discover.
1. Visual Editor Copilot: Your vision, our AI’s creation
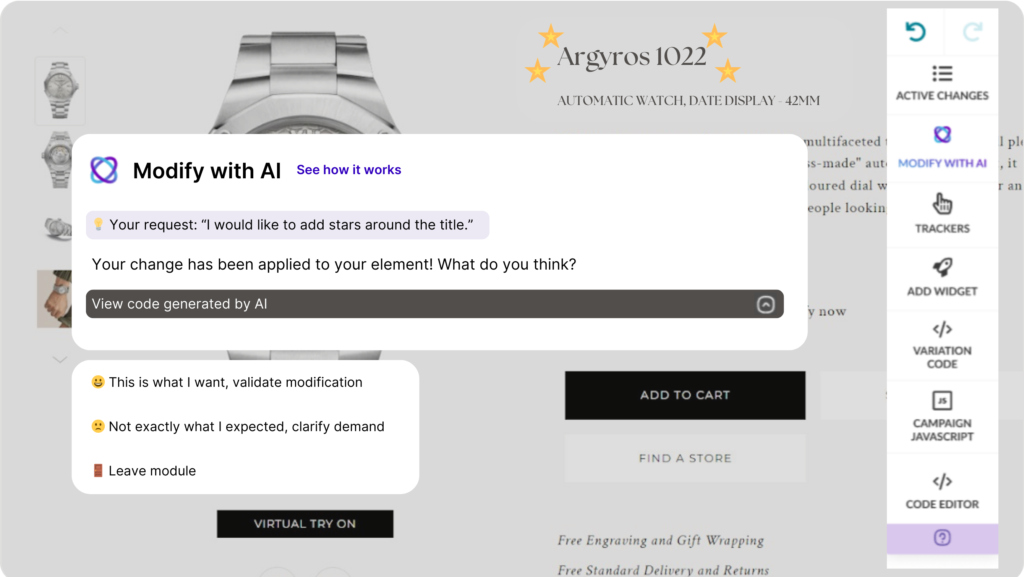
Visual Editor Copilot turns your ideas into reality without the endless clicking. Just describe what you want – “make that button green,” “add a fade-in animation,” or “move the CTA above the fold” – and watch our AI bring your vision to life.
No more wrestling with code or hunting through menus. Your creativity leads. Our AI follows.
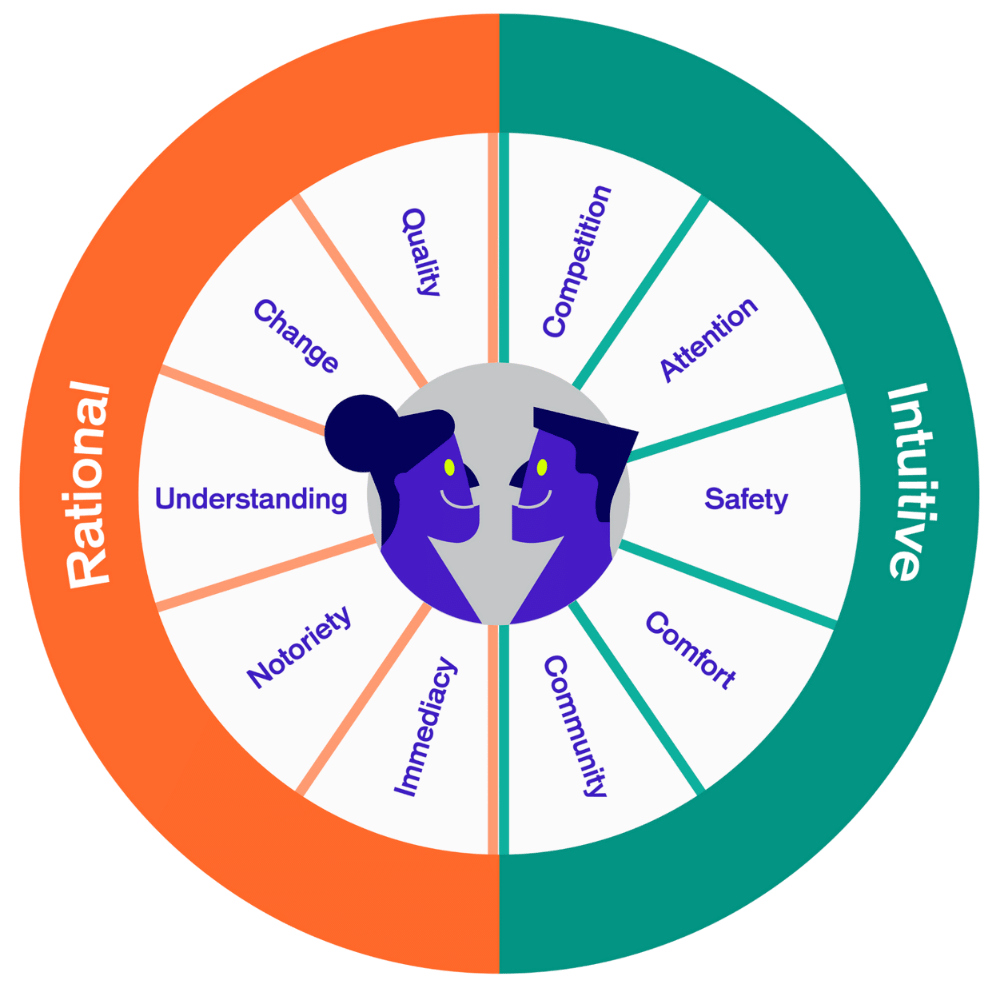
2. EmotionsAI Insight: Explore 10 emotional profiles
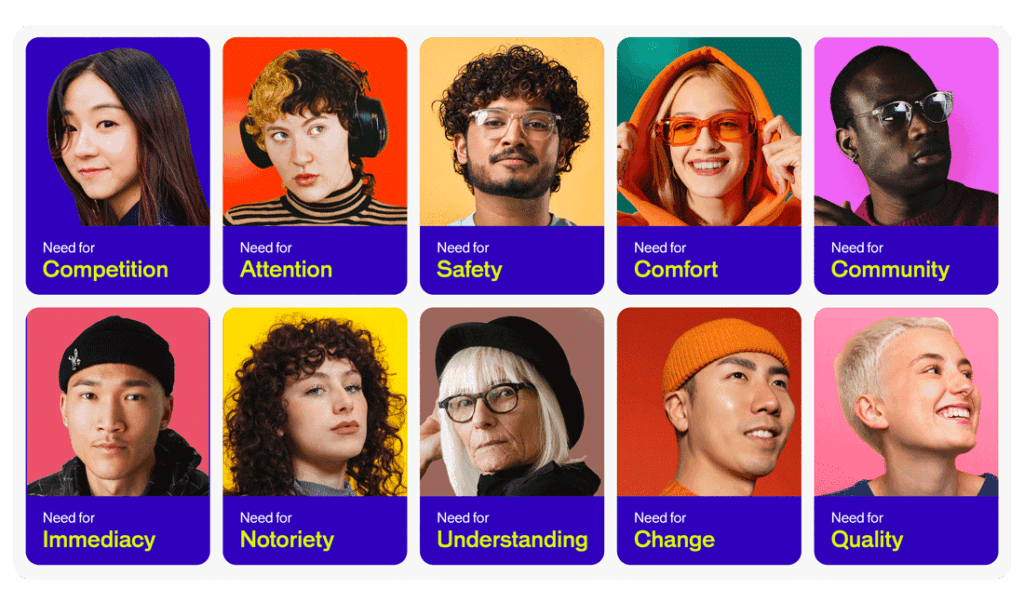
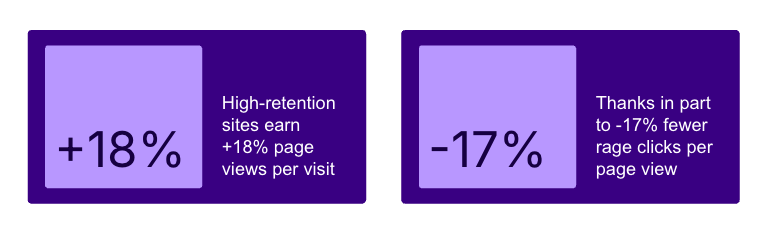
EmotionsAI Insights gives you a free peek into 10 emotional profiles that reveal what your visitors actually feel. Not just what they click – what moves them.
See the missed opportunities hiding in plain sight. Understand the emotional drivers that turn browsers into buyers. It’s personalization that goes beyond demographics to tap into what people really want.
3. Engagement Levels: Segment traffic for affinity and engagement
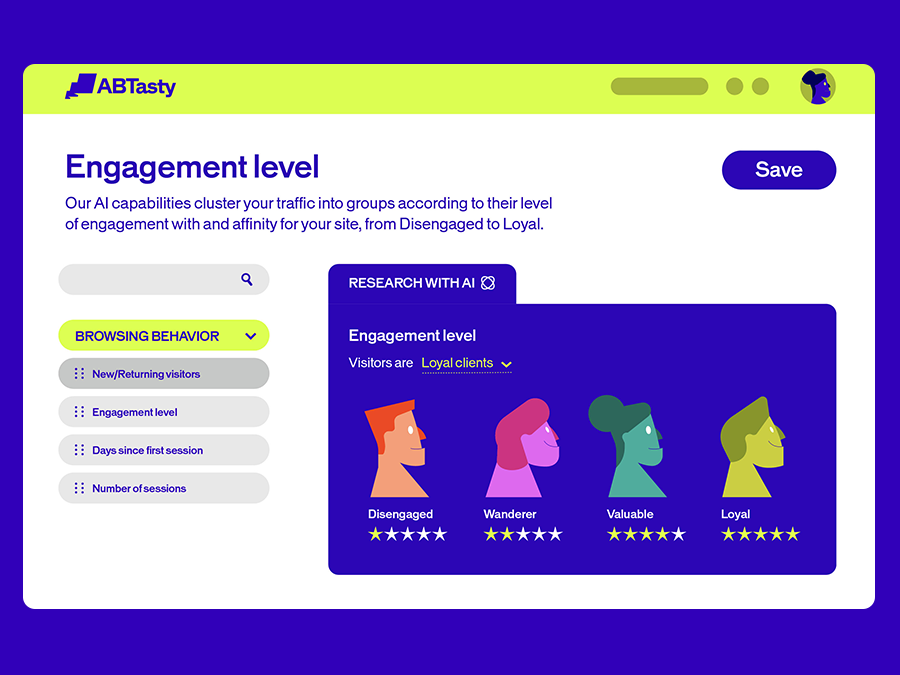
Our engagement-level segmentation uses AI to cluster visitors based on how they connect with your site. New visitors get the welcome they deserve. Returning customers get the recognition they’ve earned.
It’s traffic segmentation that makes sense – grouping people by affinity, not just attributes.
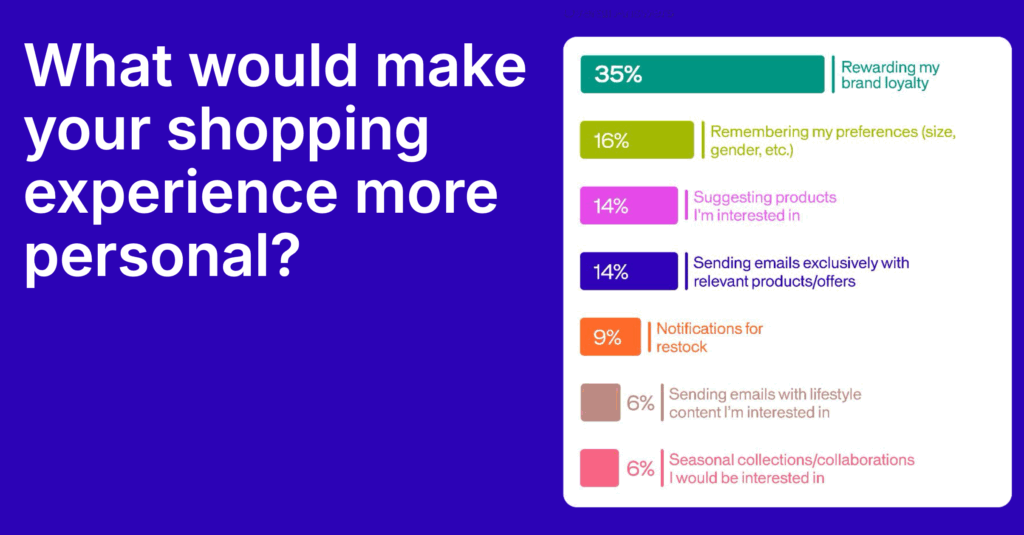
4. EmotionsAI: The future of personalization
EmotionsAI is personalization with emotional clarity. In just 30 seconds, see what drives your visitors at a deeper level. Turn those insights into targeted audiences and data-driven sales.
Your visitors have unique needs and expectations. Now you can meet them where they are – emotionally and practically.
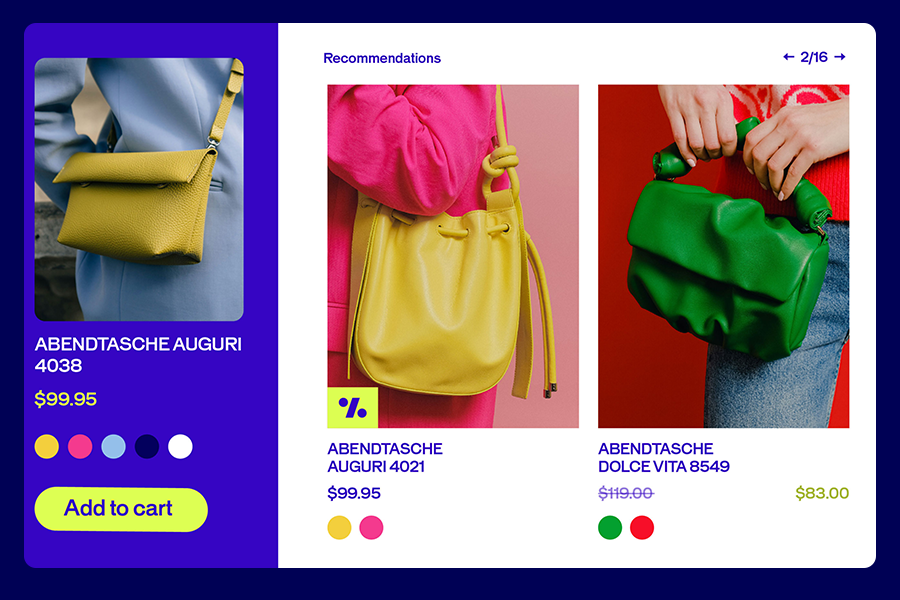
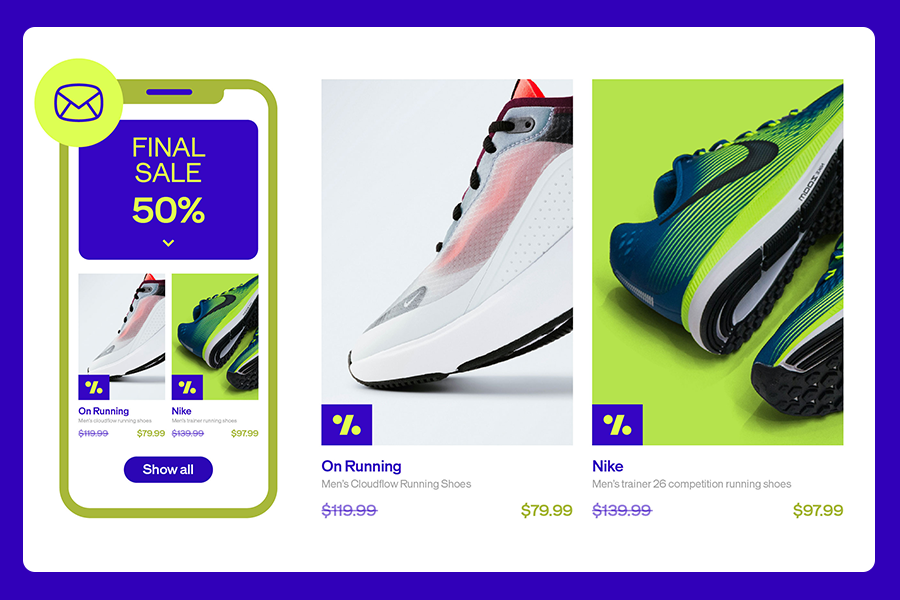
5. Recommendations and merchandising
Recommendations and Merchandising turns the right moment into new revenue. Our AI finds those perfect opportunities to inspire visitors – whether it’s a complementary product or an upgrade that makes sense.
You stay in control of your strategy. AI accelerates the performance. The result? A delightful experience that drives higher average order value.
6. Content Interest: No more struggling to connect
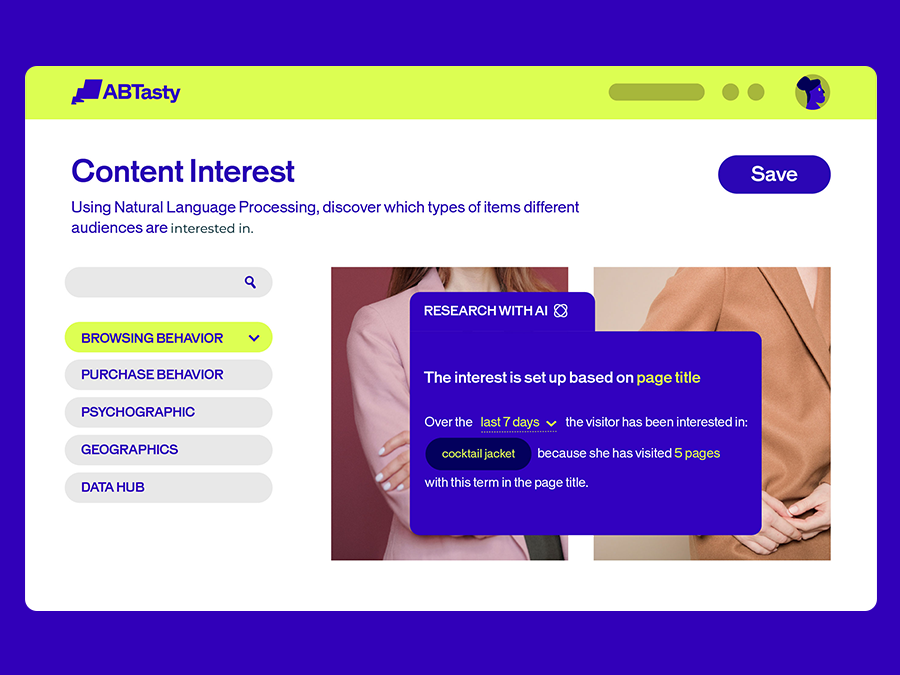
Content engagement AI identifies common interests among your visitors based on their browsing patterns – keywords, content, products. Build experiences that feel personal because they actually are.
It’s not about pushing content. It’s about finding the connections that already exist and making them stronger.
7. Report Copilot: Meet your personal assistant for reporting
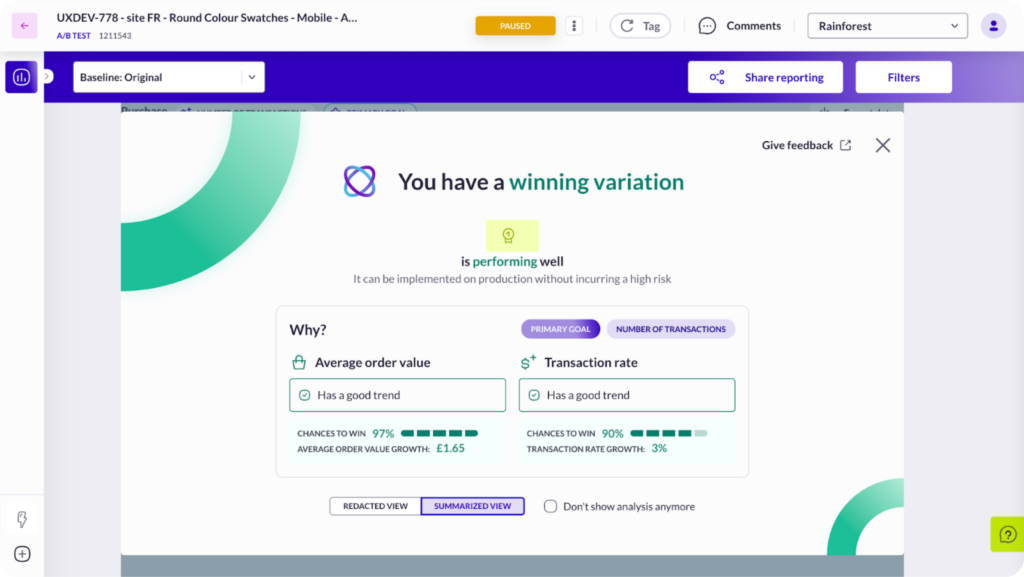
Report Copilot is your personal assistant for making sense of data. It highlights winning variations and breaks down why they drove transactions – so you can feel confident in your next move.
No more staring at charts wondering what they mean. Get clear insights that move you forward.
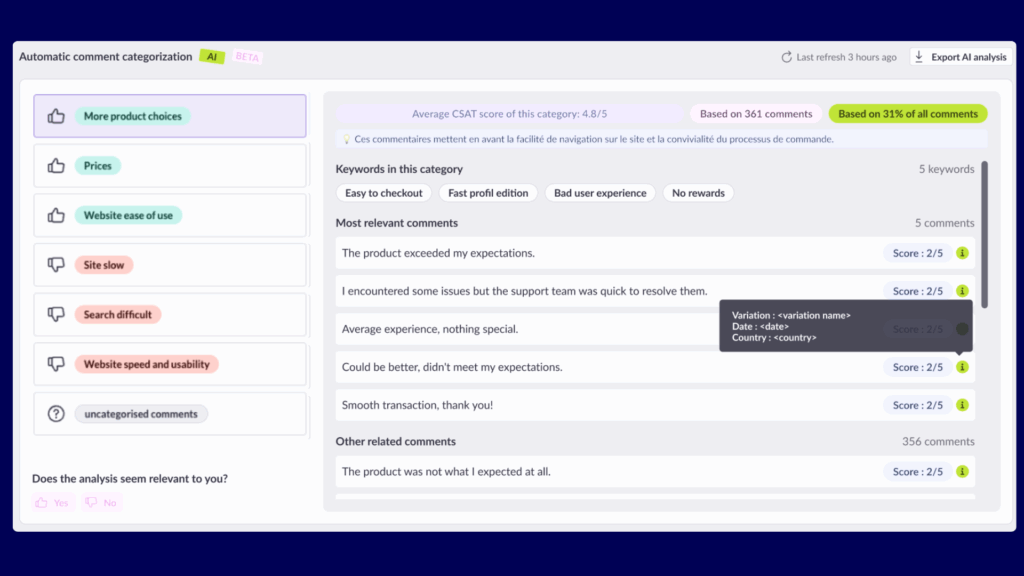
8. Drowning in feedback? Feedback Analysis Copilot saves you time
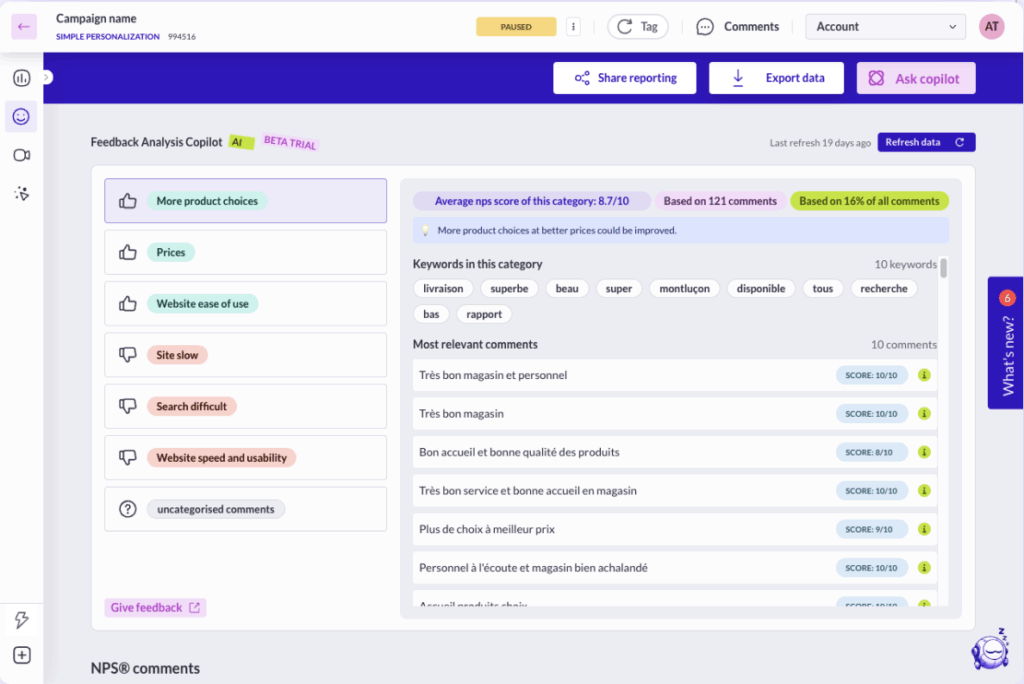
Feedback Analysis Copilot takes the heavy lifting out of NPS and CSAT campaigns. Our AI analyzes responses right within your reports, identifying key themes and sentiment trends instantly.
High volumes of feedback? No problem. Get the insights you need without the manual work that slows you down.
9. Struggling to craft the perfect hypothesis for your experiments?
Hypothesis Copilot helps you craft experiments that start strong. Clear objectives, richer insights, better structure – because every great test begins with a rock-solid hypothesis.
No more struggling with the “what if” – start testing with confidence.
AI That Amplifies Human Creativity
These aren’t just features – they’re your teammates. AI that understands how teams really work: with curiosity, collaboration, and the courage to try something new.
Every tool we build asks the same question: How can we help you go further?
Whether you’re crafting your first experiment or your thousandth, these AI features meet you where you are and help you get where you’re going. Because the best optimization happens when human insight meets intelligent tools.
Ready to see what AI-powered experimentation feels like? Let’s test something bold together.
FAQs about AI in digital experimentation
How is AI used in digital experimentation and A/B testing?
AB Tasty offers clients multiple AI features to enhance A/B testing by automating test setup, analyzing emotional responses, segmenting audiences, and generating data-driven recommendations—all aimed at faster insights and better personalization.
What are the benefits of using AI in website optimization?
AI reduces guesswork, accelerates testing, improves personalization, and turns raw data into actionable insights. It empowers teams to learn faster and create better digital experiences.
How does AI help marketing and product teams test and learn faster?
AB Tasty empowers marketing and product teams with AI tools like Report Copilot and Hypothesis Copilot to streamline data analysis and test planning, helping teams move from idea to iteration quickly and confidently.
What AI features does AB Tasty offer for experimentation and personalization?
AB Tasty offers features like Visual Editor Copilot, EmotionsAI, Content Interest segmentation, and Report Copilot to streamline testing, personalization, and reporting.