A/B testing can bring out a few types of experimental flaws.
Yes, you read that right – A/B testing is important for your business, but only if you have trustworthy results. To get reliable results, you must be on the lookout for errors that might occur while testing.
Sample ratio mismatch (SRM) is a term that is thrown around in the A/B testing world. It’s essential to understand its importance during experimentation.
In this article, we will break down the meaning of sample ratio mismatch, how to spot SRM, when it is and is not a problem, why it can happen and how to detect SRM.
Sample ratio mismatch overview
Sample ratio mismatch is an experimental flaw where the expected traffic allocation doesn’t fit with the observed visitor number for each testing variation.
In other words, an SRM is evidence that something went wrong.
Sample ratio mismatch is crucial to be aware of in A/B testing.
Now that you have the basic idea, let’s break this concept down piece by piece.
What is a “sample”?
The “sample” portion of SRM refers to the traffic allocation.
Traffic allocation refers to how the traffic is split toward each test variation. Typically, the traffic will be split equally (50/50) during an A/B test. Half of the traffic will be shown the new variation and the other half will go toward the control version.
This is how an equal traffic allocation will look for a basic A/B test with only one variant:
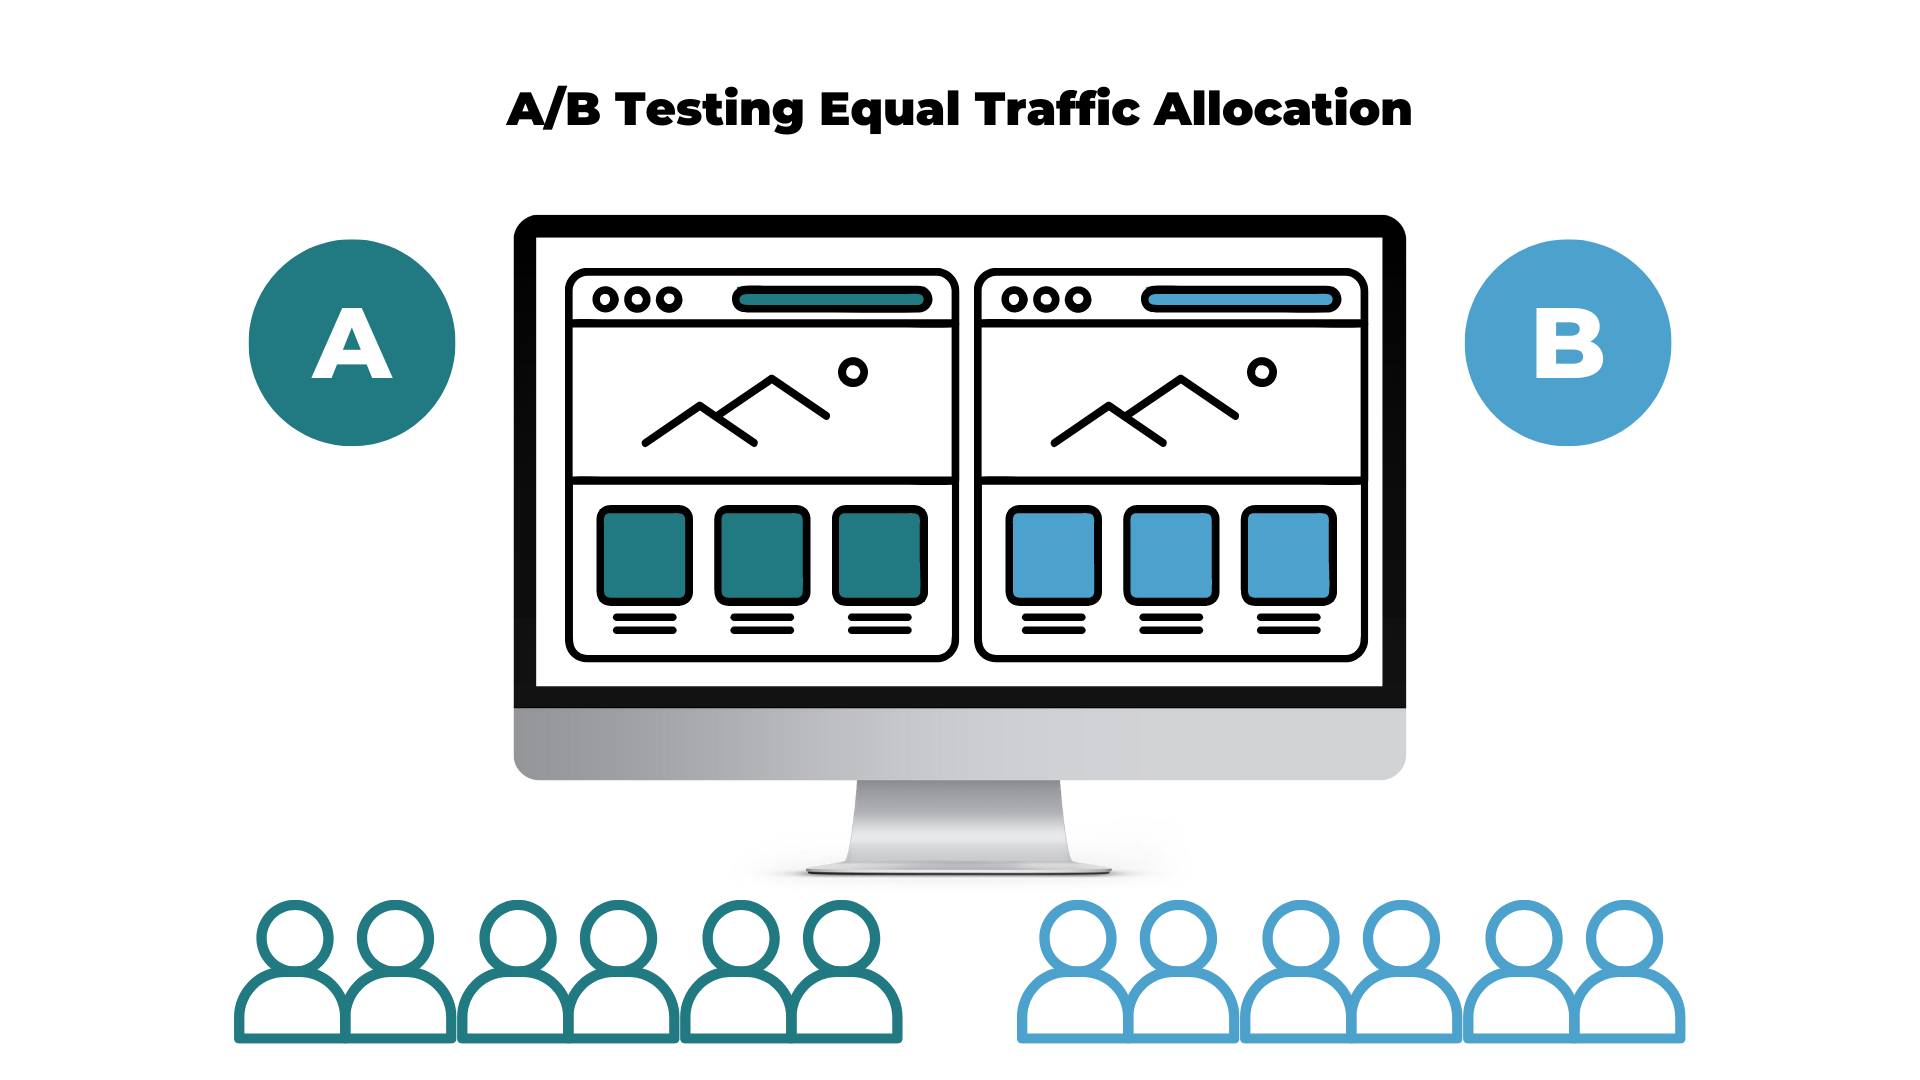
If your test has two variants or even three variants, the traffic will still be allocated equally to each test to ensure that each version receives the same amount of traffic. An equal traffic allocation in an A/B/C test will be split into 33/33/33.
For both A/B and A/B/C tests, traffic can be manipulated in different ways such as 60/40, 30/70, 20/30/50, etc. Although this is possible, it is not a recommended practice to get accurate and trustworthy results from your experiment.
Even by following this best practice guideline, equally allocated traffic will not eliminate the chance of an SRM. This type of mismatch is something that can still occur and must be calculated no matter the circumstances of the test.
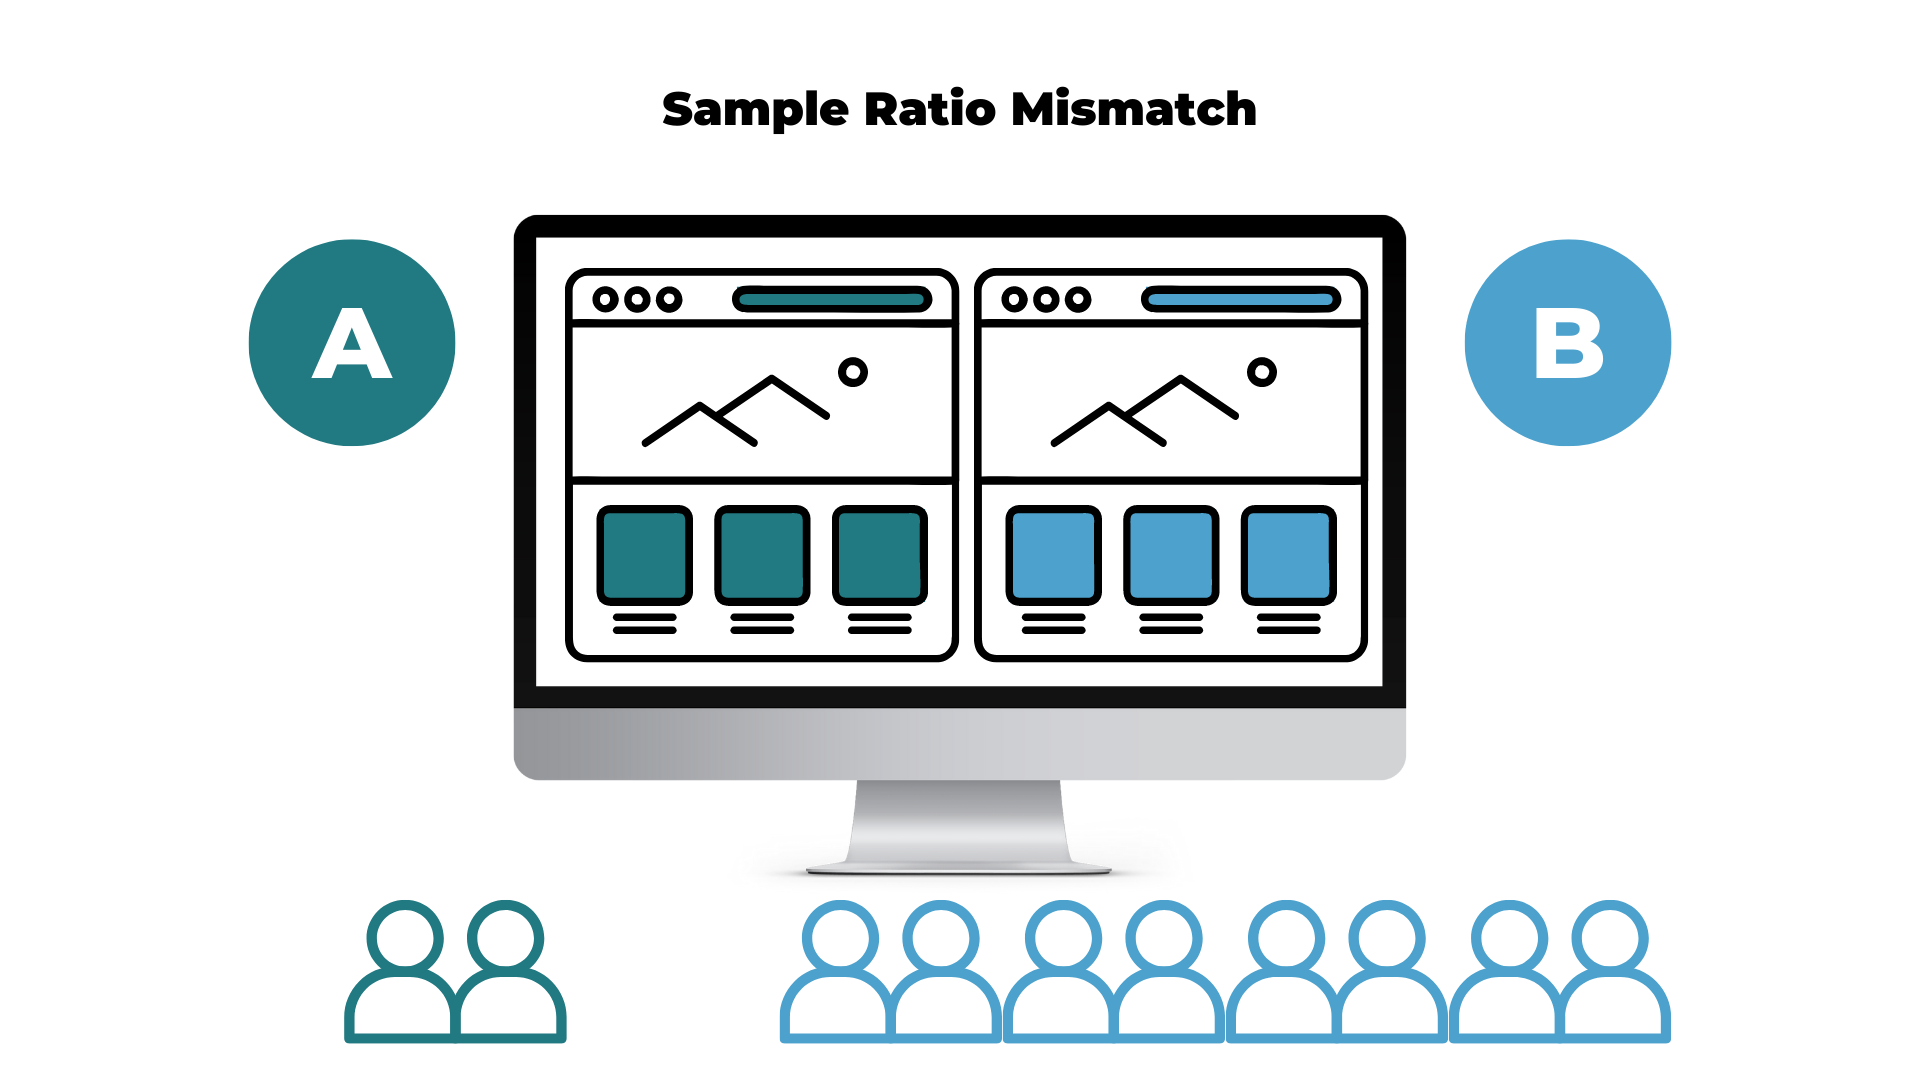
Define sample ratio mismatch (SRM)
Now that we have a clear picture of what the “sample” is, we can build a better understanding of what SRM means:
- SRM happens when the ratio of the sample does not match the desired 50/50 (or even 33/33/33) traffic allocation
- SRM occurs when the observed traffic allocation to each variant does not match the allocation chosen for the test
- The control version and variation receive undesired mismatched samples
Whichever words you choose to describe SRM, we can now understand our original definition with more confidence:
“Sample ratio mismatch is an experimental flaw where the expected traffic allocation doesn’t fit with the observed visitor number for each testing variation.”
Is SRM always a problem?
To put it simply, SRM occurs when one test version receives a noticeably different amount of visitors than what was originally expected.
Imagine that you have set up a classic A/B test: Two variations with 50/50 traffic allocation. You notice at one point that version A receives 10,000 visitors and version B receives 10,500 visitors.
Is this truly a problem? What exactly happened in this scenario?
The problem is that while conducting an A/B test, an extremely strict respect of the allocation scheme is not always 100% possible since it must be random. The small difference in traffic that is noted in the example above is something we would typically refer to as a “non-problem.”
If you are seeing a similar traffic allocation on your A/B test in the final stages, there is no need to panic.
A randomly generated traffic split has no way of knowing exactly how many visitors will stumble upon the A/B test during the given time frame of the test. This is why toward the end of the test duration, there may be a smaller difference in the traffic allocation while the majority (+95%) of traffic is correctly allocated.
When is SRM a problem?
Some tests may have SRM due to experimental setup.
When the SRM is a big problem, there will be a noticeable difference in traffic allocation.
If you see 1,000 directed to one variant and 200 directed to the other — this is an issue. Sometimes, spotting SRM does not require a particular mathematical formula dedicated to calculating SRM as it is evident enough on its own.
However, an extreme difference in traffic allocation can be very rare. Therefore, it’s essential to check the visitor counts in an SRM test before each test analysis.
Does SRM occur frequently?
Sample ratio mismatch can happen more often than we think. According to a study done by Microsoft & Booking, about 6% of experiments experience this problem.
Furthermore, if the test includes a redirect to an entirely new page, SRM can be even more likely.
Since we heavily rely on tests and trust their conclusions to make strategic business decisions, it’s important that you are able to detect SRM as early as possible when it happens during your A/B test.
Can SRM still affect tests using Bayesian?
The reality is that everyone needs to be on the lookout for SRM, no matter what type of statistical test they are running. This includes experiments using the Bayesian method.
There are no exemptions to the possibility of experiencing a statistically significant mismatch between the observed and expected results of a test. No matter the test, if the expected assumptions are not met, the results will be unreliable.
Sample ratio mismatch: why it happens
Sample ratio mismatch can happen due to a variety of different root causes. Here we will discuss three common examples that cause SRM.
One common example is when the redirection to one variant isn’t working properly for poorly connected visitors.
Another classic example is when the direct link to one variant is spread on social media, which brings all users who click on the link directly to one of the variants. This error does not allow the traffic to be properly distributed among the variants.
In a more complex case, it’s also possible that a test including JS code is crashing a variant and therefore some of the visitor configurations. In this situation, some visitors that are being sent to the crashing variant won’t be collected and indexed properly, which leads to SRM.
All of these examples have a selection bias: some non-random visitors are excluded. The non-random visitors are arriving directly from a link shared on social media, have a poor connection, or are visiting a crashing variant.
In any case, when these issues occur, the SRM is an indication that something went wrong and you cannot trust the numbers and the test conclusion.
Checking for SRM in your A/B tests
Something important to be aware of when doing an SRM check is that the priority metric when checking needs to be “users” and not “visitors.” Users are the specific people that are allocated to each variation, meanwhile, the visitors metric is counting the number of sessions that each user makes.
It’s important to differentiate between users and visitors because results may be skewed if a visitor comes back to their variation multiple times. SRM detected with “visitors” may not be the most reliable metric, but using the “users” metric is evidence of a problem.
SRM in A/B testing
Testing for sample ratio mismatch may seem a bit complicated or unnecessary at first glance. In reality, it’s quite the opposite.
Understanding what SRM is, why it happens, and how it can affect your results is crucial in A/B testing. Running an A/B test to help make key decisions is only helpful for your business if you have reliable data from those tests.
Want to get started on A/B testing for your website? AB Tasty is a great example of an A/B testing tool that allows you to quickly set up tests with low code implementation of front-end or UX changes on your web pages, gather insights via an ROI dashboard, and determine which route will increase your revenue.


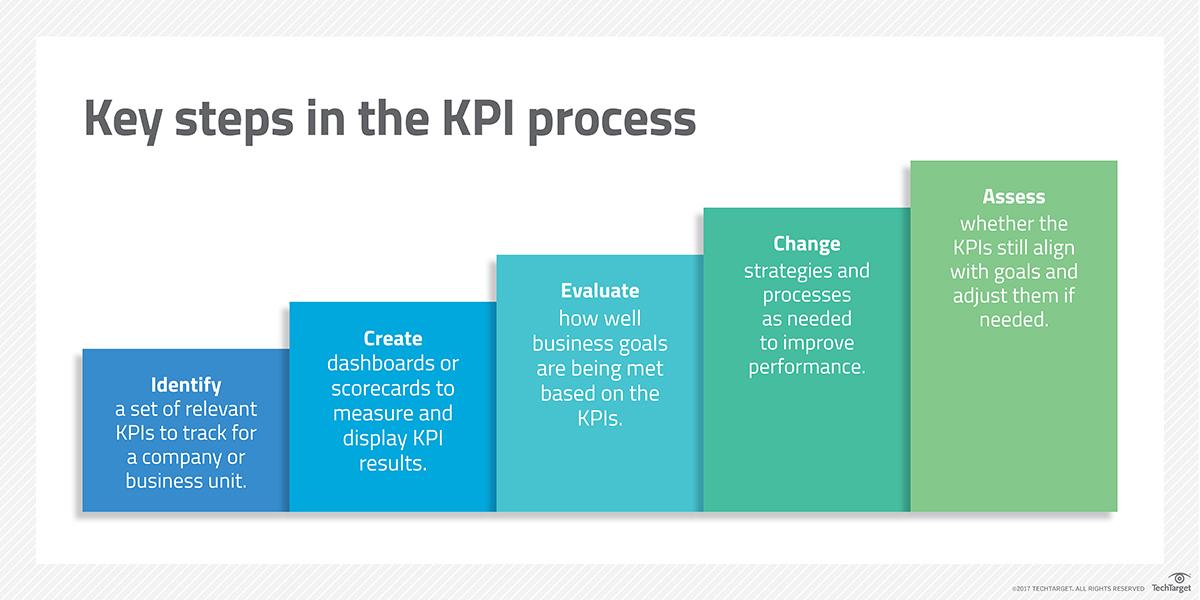
 Once all these criteria have been met, a KPI can be properly designed and implemented with confidence. However, it will need monitoring and adjustment as time goes on once the KPI has been fully integrated.