Anaïs Levy shares how luxury brands use experimentation to balance brand image with business performance, plus why removing prices can actually boost conversions.
Anaïs Levy knows the secret behind what drives luxury digital experiences. As the E-commerce & Omnichannel Services Insights Manager at the Kering Group, the powerhouse group behind iconic luxury brands such as Gucci, Balenciaga, and Saint Laurent to name a few, she leverages over ten years in conversion rate optimization to help some of the largest luxury brands build dazzling digital experiences.
Before joining Kering, Anaïs worked across various industries, from travel giant Expedia to luxury group LVMH. Her unique position involves analyzing business performance across multiple luxury brands, helping them make data-driven decisions while respecting their distinct artistic visions. As a long-term AB Tasty customer and frequent speaker at industry events, Anaïs brings a rare perspective on how luxury brands navigate the delicate balance between brand image and business optimization.
Anaïs Levy spoke with AB Tasty’s Head of Marketing and host of “The 1000 Experiments Club” podcast, John Hughes, about navigating creative constraints in luxury experimentation, leveraging cross-brand benchmarking to drive results, and how omnichannel thinking is revolutionizing conversion rate optimization in the luxury space.
Here are some of the takeaways from their conversation.
Beyond the website: Luxury’s omnichannel reality
The numbers tell a story that completely reframes how we should think about luxury e-commerce: “Among all our visitors, if we sum up visitors in the stores and visitors on our websites, the majority, like 90% is coming to the website and 10% is our traffic in store,” Anaïs shares.
But here’s the twist—most purchases still happen offline. This flips traditional CRO thinking on its head.
“When you have this overview of understanding the business, understanding how luxury websites fit into the whole customer journey, conversion rate optimization is about understanding how you make the most of each asset you have,” she explains.
For luxury brands, websites serve multiple purposes beyond direct sales. Customers use them for research and discovery, to prepare for store visits, for aspirational browsing, and to access omnichannel services like click-and-collect or appointment booking.
“We know we have aspirational customers, but we were not treating them as a specific segment. So everybody coming to the website should in the end convert. And I guess now with the rise of omnichannel and services… we have come to this conclusion that a significant amount of traffic is not going to purchase online,” Anaïs notes.
The takeaway? Stop measuring luxury e-commerce success purely on online conversion rates. Instead, it’s about thinking bigger. How does your digital experience drive overall brand engagement and omnichannel revenue?
Discover the luxury industry’s glittering guide to all things optimization.
Working with luxury brands means constant negotiation between artistic vision and business performance. “It’s a lot of compromise,” Anaïs admits. “The brand image, the design is really the voice of the artistic director.”
But here’s where persistence pays off. When faced with a creative “no,” Anaïs doesn’t give up—she waits, gathers more data, and asks again. “You have to be stubborn because it could be a no. But two months, three months, six months after you ask again and one day you would have a yes,” she explains.
Her secret weapon? Benchmark data across sister brands. When one Kering brand achieves better checkout completion rates than another, it becomes harder to argue against proven improvements.
“If your sister brands can achieve these figures and they have kind of the same backbone, the same services, same offer, it means that there is something that we are not doing right,” she points out.
This creates a unique advantage where luxury brands can iterate on proven concepts while maintaining their distinct identities. Anaïs’s team has built AB test catalogs shared across all brands and runs group-wide experimentation events to facilitate this knowledge sharing.
Think global, analyze local with segmentation
Anaïs’s team runs experiments globally but analyzes results with surgical precision. “The tip I would give to people who would listen to this podcast is really think global, because then if you make it work for most of your users, your gains are way higher,” she advises.
But the magic happens in the analysis. “When you analyze, don’t forget to try looking at some important segments. So countries could be some… We are using a lot EmotionsAI segmentation to analyze the results because it gives you ideas about why the ‘Competition’ segment didn’t like these experiments,” she explains.
This granular approach reveals opportunities for personalization. By breaking down results by country, device, and behavioral and emotional segments, teams uncover insights that would be invisible in aggregate data.
The strategy works because it balances efficiency with insight: global rollouts maximize impact and streamline development, while segmented analysis reveals why certain groups respond differently, creating opportunities for follow-up experiments that target specific segments with tailored experiences.
What else can you learn from our conversation with Anaïs Levy?
The surprising price experiment: How removing prices from product listing pages actually increased conversions by focusing attention on products rather than cost
AI’s luxury future: From productivity tools to conversational search that mimics in-store personal shopping experiences
The newsletter discovery: How a failed lazy-loading test accidentally revealed hidden engagement opportunities in page footers
Cross-brand collaboration: The internal tools and processes that help luxury brands share learnings while maintaining their unique identities
About Anaïs Levy
Anaïs Levy has over ten years of experience in conversion rate optimization, spanning industries from travel (Expedia) to luxury (LVMH, Kering). At Kering Group, she manages business performance and insights across multiple luxury brands, including Gucci, Saint Laurent, and Balenciaga. Her unique role involves balancing data-driven optimization with the creative constraints of luxury brand management, making her a sought-after speaker on experimentation in highly regulated creative industries.
About 1,000 Experiments Club
The 1,000 Experiments Club is an AB Tasty-produced podcast hosted by John Hughes, Head of Marketing at AB Tasty. Join John as he sits down with the experts in the world of experimentation to uncover their insights on what it takes to build and run successful experimentation programs.
Winning Big During the E-Commerce Holiday Season: Strategies and Insights
Brian Heberer
The holiday season is more than just a date on the calendar. For e-commerce teams, it’s the biggest moment of the year—a time of high stakes, fierce competition, and incredible opportunity. Black Friday and Cyber Monday can feel like a mad dash to the finish line, but the teams that win big don’t just show up; they prepare.
The numbers tell the story. In 2024, Black Friday online sales hit $10.8 billion, while Cyber Monday remained the biggest day for online shopping with a staggering $13.3 billion in sales according to Adobe. But here’s what those numbers don’t show: the months of preparation, testing, and collaboration that made those wins possible.
This isn’t about finding a single “hack” for holiday success. It’s about building momentum through smart, steady, and collaborative effort. It’s about asking the right questions, testing bold ideas, and learning from every single click.So, let’s get ready together. Here are some proven strategies—many of which you can find in our “30 Tests for Black Friday” e-book—to help your team go further this season.
First things first: Build a foundation of trust
Before the first sale banner goes up, your site needs to be ready for the rush. A slow or buggy experience is the fastest way to lose a customer. The difference between a page that loads in one second and a page that loads in five seconds can be a 17% drop in conversion rate.
Start by pressure-testing your site. Simulate high-traffic moments to find and fix potential bottlenecks before they become holiday headaches. Compress your images, streamline your code, and make sure your servers can handle the peak. A smooth, reliable experience is non-negotiable—it’s the foundation of trust.
Create urgency that doesn’t just shout, it connects
The holidays run on urgency, but “BUY NOW!” only gets you so far. The real goal is to create a sense of shared excitement and opportunity. This is where testing your messaging becomes essential.
Try moving beyond generic phrases. Experiment with different calls-to-action (CTAs), placements, and designs to see what truly motivates your audience.
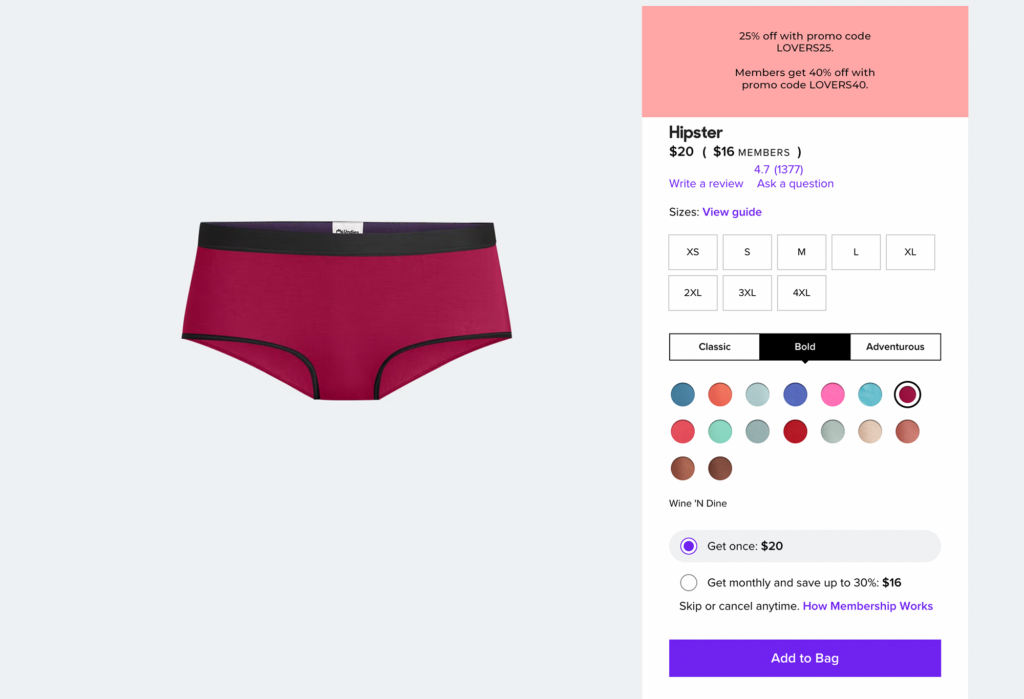
Promotional Banners: Don’t assume every visitor lands on your homepage. MeUndies added a bold promo-code banner to their product detail pages (PDPs) to catch visitors arriving from ads. This small change led to a 9.8% increase in transactions and an uplift of over $400,000 in revenue.
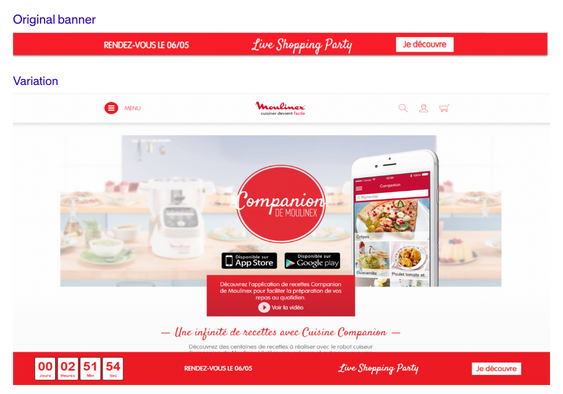
Countdown Timers: The team at Moulinex wanted to drive traffic to a limited-time shopping event. They tested a simple banner with a countdown timer against one without. The result? The countdown banner drove 74% more clicks on the CTA. It’s a simple way to show that time to grab a great deal is running out.
Make every experience feel personal
Holiday shoppers aren’t a monolith. They’re individuals with unique tastes and needs, and they expect to be treated that way. Personalization is how you show your customers that you see them. Use browsing behavior and purchase history to tailor offers that feel less like a sales pitch and more like a helpful suggestion.
For example, if a customer has been eyeing your winter coats, feature them prominently. Dynamic content that adapts to user behavior makes every visit feel relevant and keeps people engaged.The team at Pan Pacific Hotels Group took this to heart. They created two audience segments—families and couples—and tailored the entire website experience with custom banners and offers. The result was a 35% uplift in bookings from these visitors. That’s the power of making it personal.
Non-negotiable: optimize for mobile experiences
More than half of all e-commerce sales happen on a phone. This isn’t a trend; it’s the standard. A clunky mobile experience isn’t just an annoyance—it’s a dealbreaker.
Your mobile site needs to be fast, responsive, and incredibly easy to navigate. Think simplified checkouts and thumb-friendly buttons. Test every step of the mobile journey, from landing page to confirmation.
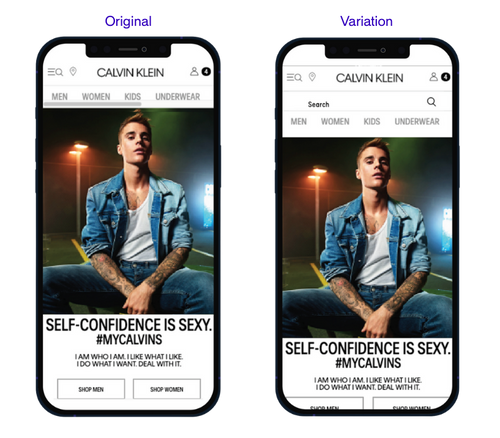
A great idea is to add a fixed search bar for mobile visitors. When the Calvin Klein team tested this, they saw a 267% increase in search bar clicks. It’s a small change that removes friction and helps people find what they’re looking for, faster.
Build confidence with social proof
In a sea of holiday deals, trust is your most valuable currency. Social proof—like customer reviews, ratings, and real-time activity—is a powerful way to build that trust. It shows hesitant shoppers that they’re in good company.
Showcase what’s popular:NYX Professional Makeup tested adding a message on their product pages that said, “75 beauties have purchased this product today!” This simple addition doubled their transaction rate.
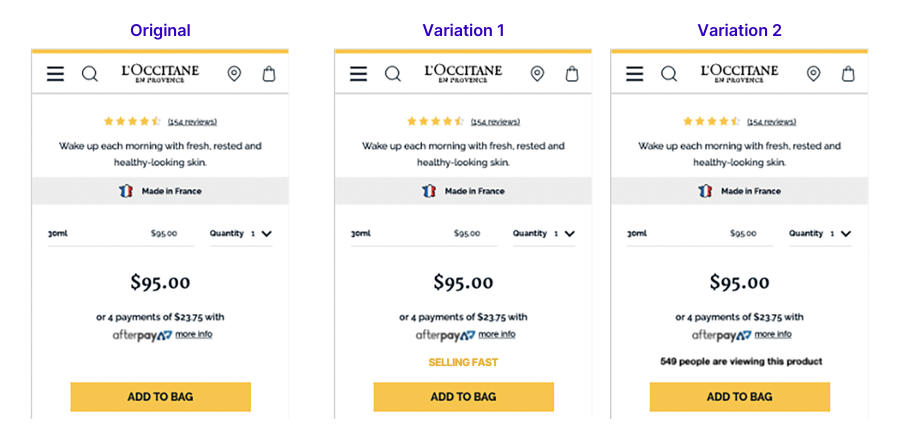
Suggest scarcity:L’Occitane en Provence tested showing how many people were currently viewing a product. This touch of social proof increased their transaction rate by 5.8%.
When people see that others are buying and loving your products, it makes their decision to purchase that much easier.
A checkout that just works
Cart abandonment is the ghost of holidays past, present, and future. A complicated, clunky checkout process is often the culprit. Your mission is to make paying as simple and seamless as possible.
Minimize the steps, offer multiple payment options (like PayPal or Apple Pay), and be upfront about shipping costs. Every bit of friction you remove is a potential sale saved.
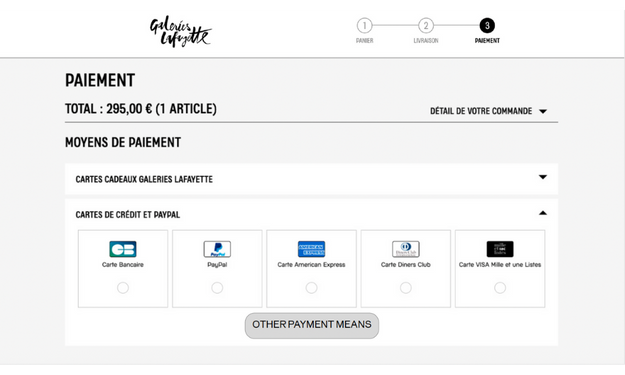
The team at Galeries Lafayette noticed that two-factor authentication was adding an extra step to checkout. They tested a version that prioritized payment methods without it. The change was a huge win, boosting their conversion rate by 38%. It proves that even small steps toward simplicity can lead to big progress.
Keep the conversation going
The holiday season is an amazing time for acquiring new customers, but the real win is turning them into loyal fans who stick around. The journey doesn’t end when the package arrives.
Think about what comes next.
A simple, personalized thank-you email.
An exclusive offer for their next purchase.
An invitation to join your loyalty program.
Building these post-holiday touchpoints is how you turn a seasonal rush into sustainable growth. It’s about building a relationship, not just completing a transaction.
Your holiday prep list: Prepare, test, iterate
Winning the holiday season is a marathon, not a sprint. It’s the result of the work you put in beforehand—the preparation, the testing, and the courage to try something new.
By focusing on a solid foundation, personalizing the experience, and removing friction at every turn, you’re not just optimizing a website; you’re building a better journey for your customers.
Stay agile, keep learning, and trust in the process. With your team behind you and a willingness to iterate, you can do more than just survive the holiday rush—you can thrive in it.
Hello! I’m Léo, Senior Product Manager at AB Tasty. I’m in charge of AB Tasty’s JavaScript tag that is currently running on thousands of websites around the world. As you can guess, my roadmap is full of topics around data collection, privacy, and… performance.
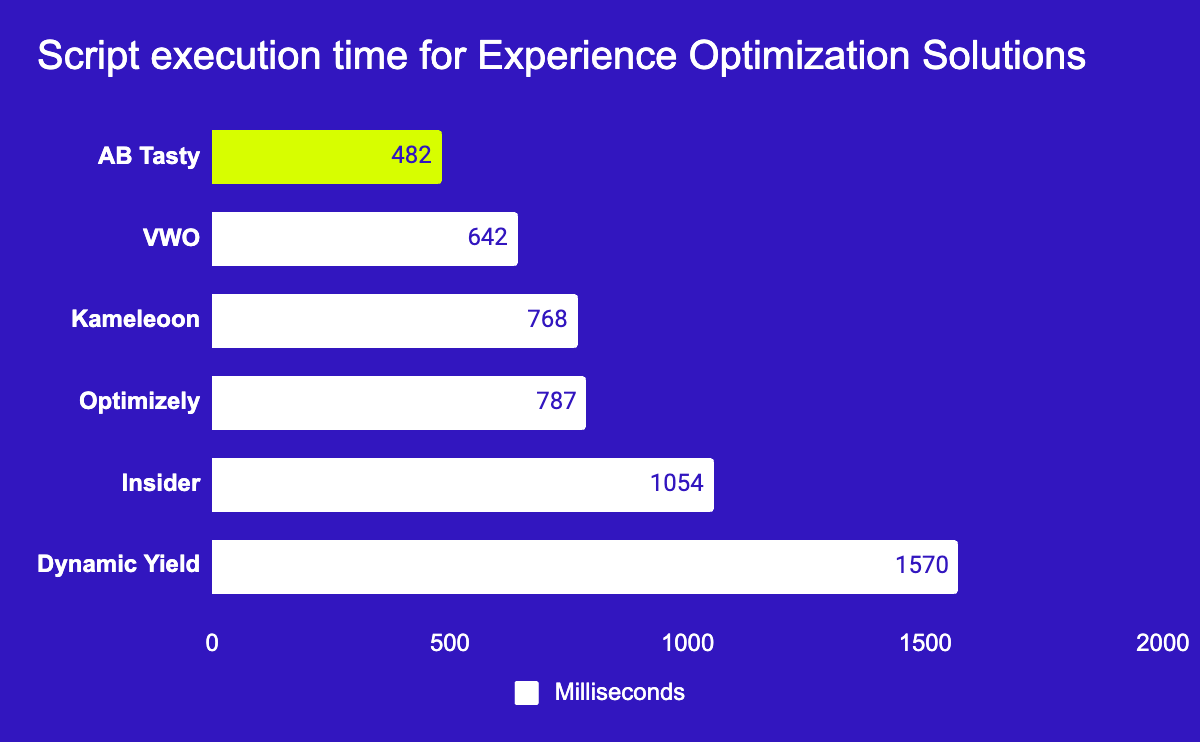
It’s why I’m so excited to give an update on our performance, and how we’ve worked hard to be the best. We’re now providing loading times up to 4 faster than other solutions on the market.
In a world where every second counts, slow-loading pages are the fast track to lost revenue. At AB Tasty, we know that speed isn’t just about convenience; it’s about delivering the smooth, reliable experience that today’s consumers expect.
That’s why we’re thrilled to be recognized by ThirdPartyWeb.today for having one of the lowest impacts on web performance among top experimentation and personalization platforms. This acknowledgment affirms our commitment to speed, scalability, and brand satisfaction.
But what does this actually mean for brands using AB Tasty?
Let’s dive into how prioritizing performance can improve your SERP rankings, customer experience (CX), and overall campaign effectiveness.
Why Web Performance Impacts Your Bottom Line
Imagine clicking on a page that seems to take forever to load. Chances are, you’d be out of there faster than you could say “conversion rate.” And you wouldn’t be alone: slow page load times can lead to increased bounce rates, missed opportunities, and, ultimately, frustrated visitors.
Good performance translates into smoother customer journeys, which leads to better engagement and, most importantly, higher conversion rates.
ThirdPartyWeb.today: The Performance Benchmark
ThirdPartyWeb.today is an independent performance data visualization initiative that analyzes the impact of various platforms on page speed. It ranks tools according to their performance cost, drawing data from nearly 4 million websites to create an unbiased performance benchmark. For brands aiming to deliver a seamless experience without sacrificing speed, ThirdPartyWeb.today provides a reliable guide for evaluating the performance impact of their tools.
Being recognized as one of the most performance-friendly Experience Optimization platforms by ThirdPartyWeb.today means our clients know they’re partnering with a technology designed with speed in mind.
What Makes AB Tasty the Fastest?
Our tech teams have worked tirelessly to make AB Tasty not only an intuitive experimentation and personalization platform, but one that prioritizes high performance. Here’s a quick look at the innovations that make AB Tasty so fast and reliable:
Modular Architecture with Innovative Dynamic Importing and Smart Caching Technology Our platform is built with a modular architecture, where only essential code is loaded for each campaign. This keeps file sizes lean, reducing load time and resource consumption.Our proprietary smart caching technology ensures that visitors only need to load the data they haven’t accessed before. By minimizing redundant data calls, we significantly reduce load times across all devices. We also provide worldwide API endpoints and have a global CDN presence with multiple Edge locations and regional Edge caches for fast response times no matter where you and your site visitors are.
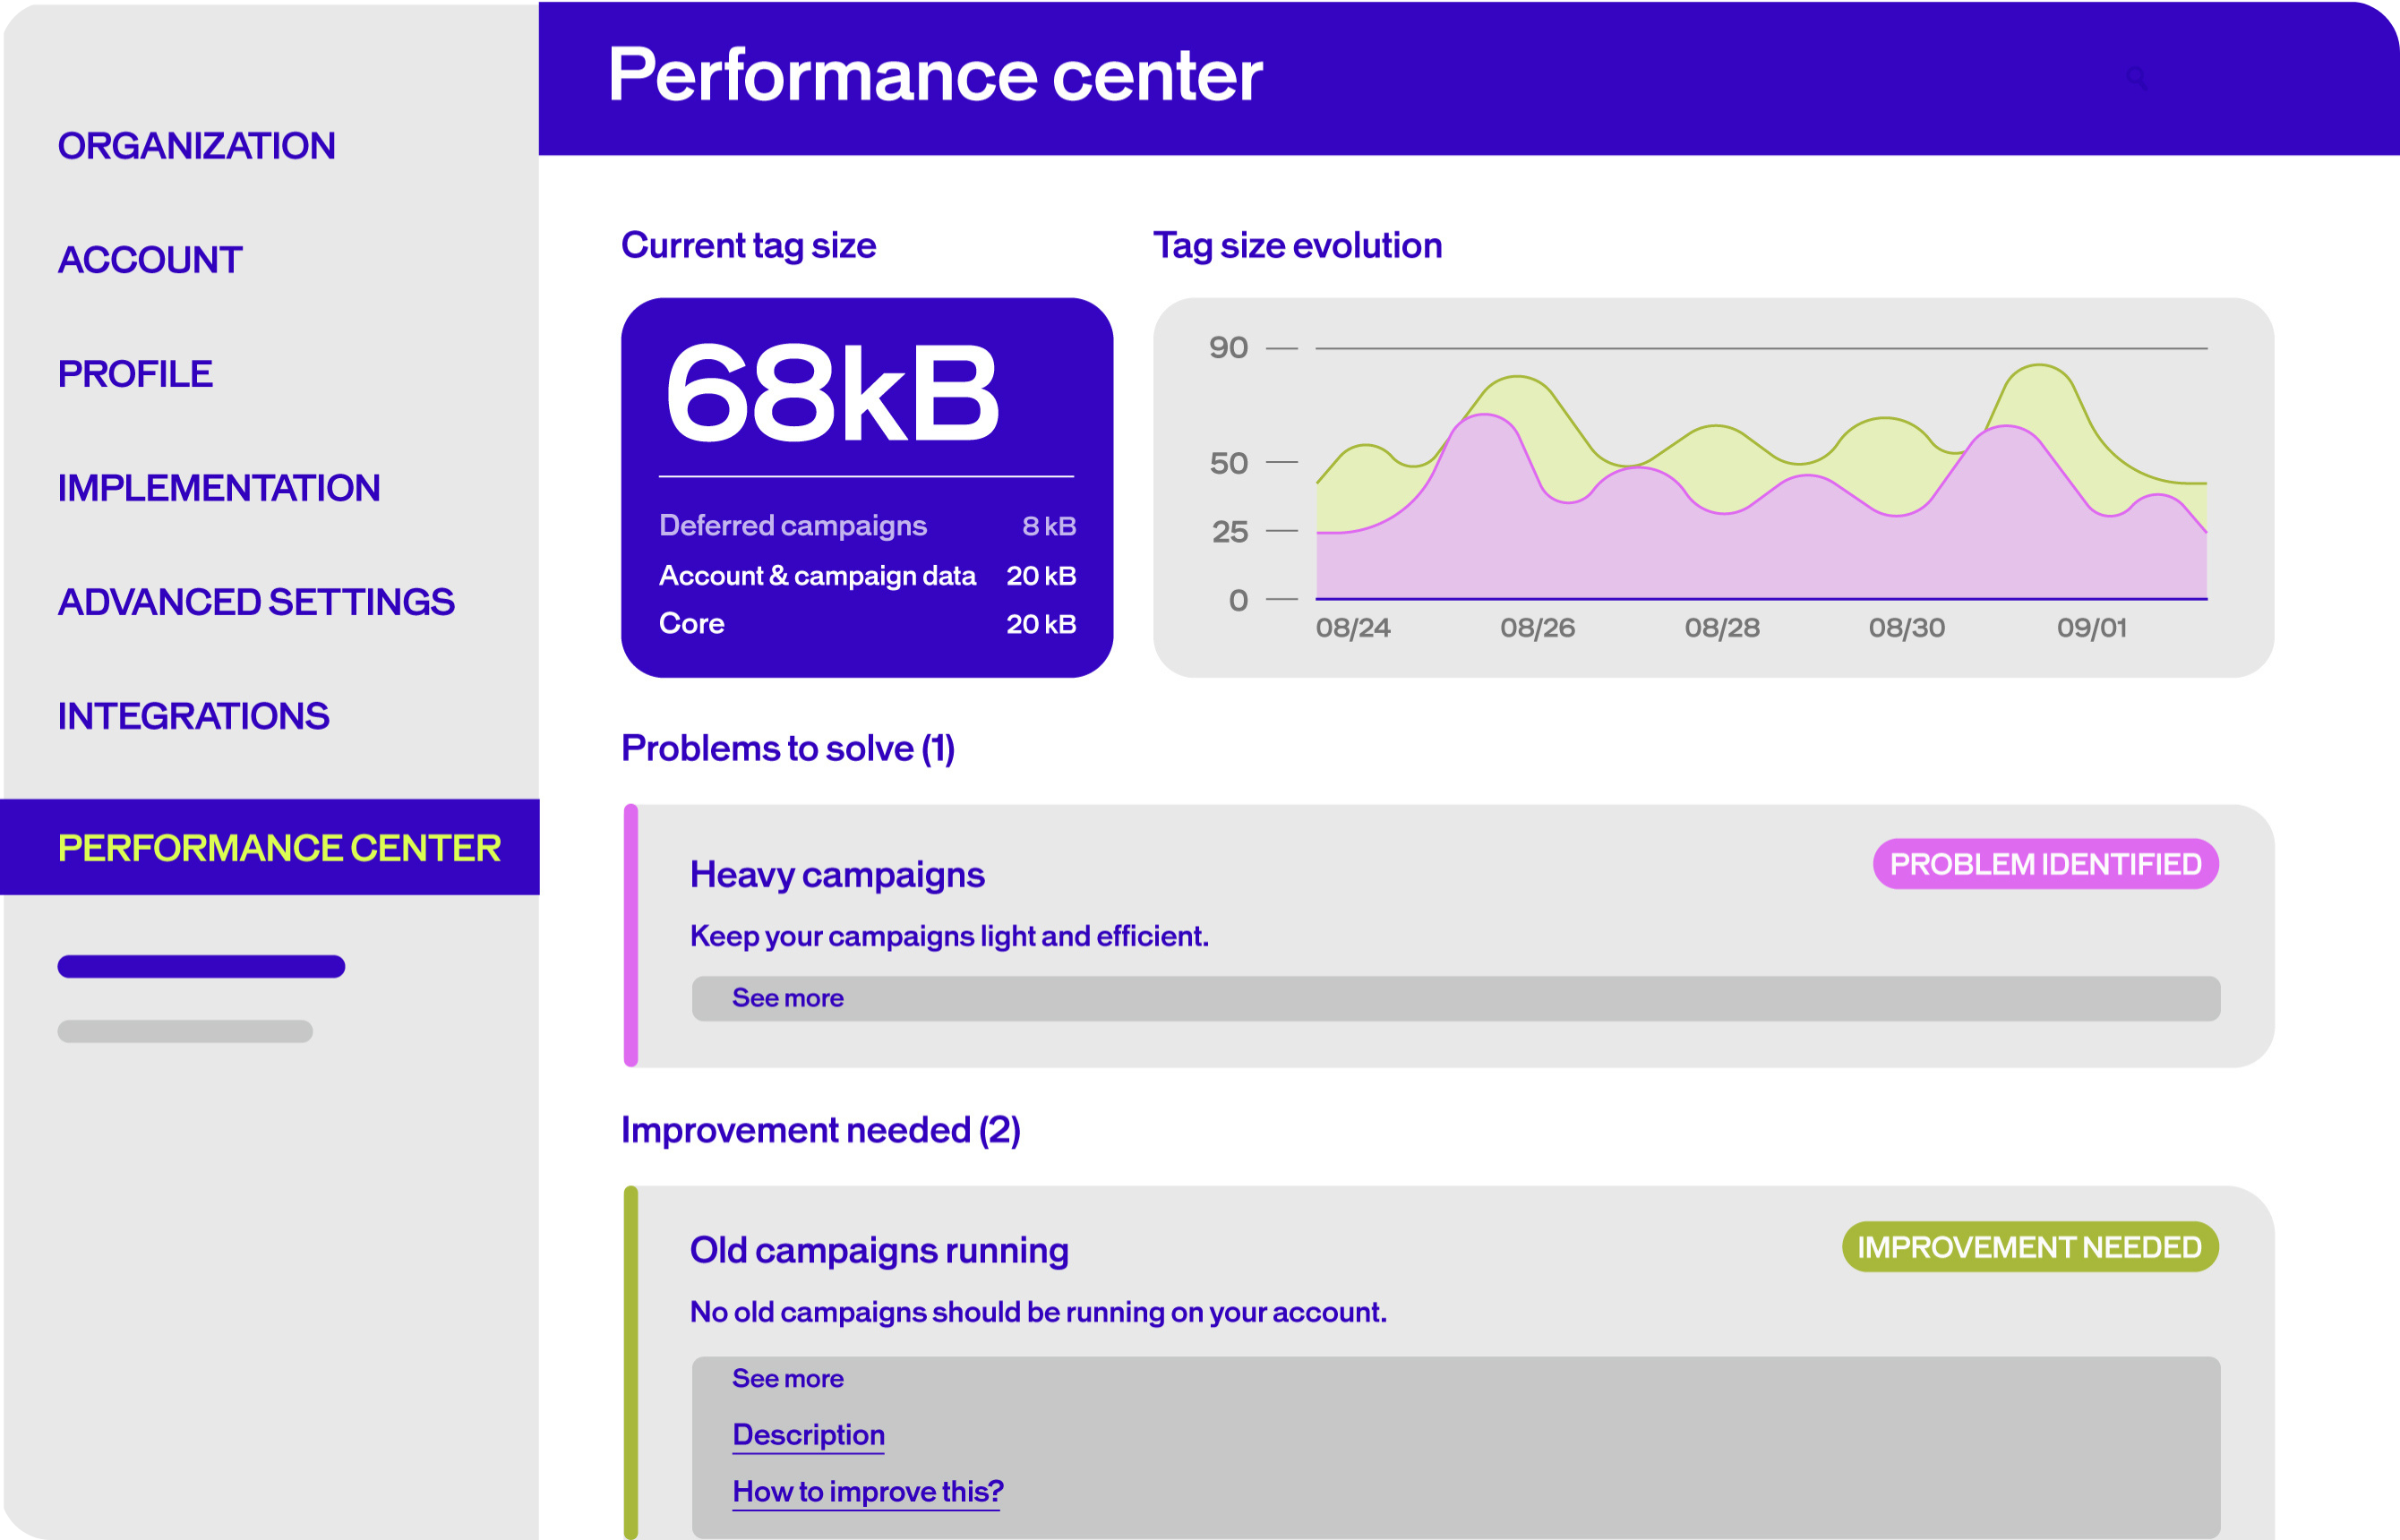
Performance Center AB Tasty’s dedicated Performance Center allows you to monitor your campaign performance in real-time. This tool gives you full transparency into what’s happening behind the scenes, so you can make adjustments as needed to keep things running smoothly. It provides recommendations to help you monitor and improve tag weight. Learn all about it here.
Single-Page Application (SPA) Compatibility AB Tasty’s platform is SPA-compatible without requiring custom code, making it easier for developers to integrate AB Tasty into their tech stack. AB Tasty is running on a native Vanilla TypeScript framework. Our tag is compatible with modern JS frameworks, including React, Angular, Vue, Meteor or Ember. The tag is unique for all environments and doesn’t require any additional implementation. Many of our customers have left their previous provider due to challenges with SPA pages. In these tools, changes are often not “sticky” or flicker when there is a dynamic content load. SPA tests in these environments often require custom code for each test, which makes testing more complicated and less user-friendly.
Flicker-Free Experiences AB Tasty’s tag uses a blended approach of both synchronous and asynchronous scripts to eliminate flicker, while maintaining optimised performance. Other solutions will prescribe “anti-flicker” snippets to eliminate flicker, which is not a recommended practice. It means hiding the body’s content while the tag loads, which ultimately delays the rendering of the site. This causes a worse user experience, increases your Largest Contentful Paint (LCP) metric, and may ultimately lead to increased bounce rates and decreased conversions. In contrast, AB Tasty’s synchronous tag uses 3kb of render-blocking to allow the tag to execute quickly before the page loads, as opposed to blocking the visibility of the page for the full package size.
And that translates to…
First loading time < 100ms Caching loading time < 10ms Execution time < 500 milliseconds Minimal Lighthouse Core Web Vitals impact
Cheers to Our Product and Tech Teams
This wouldn’t be possible without the dedication of our Product and Tech teams (thanks team!). We’ve dared to innovate, pushing the limits of what’s possible with web performance in the experimentation and personalization space.
The Bottom Line
When brands choose AB Tasty, they’re choosing a platform that prioritizes both innovation and performance. By minimizing impact on web performance, we’re helping brands deliver faster, better experiences that delight customers and drive results.
Curious to learn more about? Contact us today to discover what else sets us apart.
Building a culture of experimentation requires an appetite for iteration, a fearless approach to failure and a test-and-learn mindset. The 1000 Experiments Club podcast digs into all of that and more with some of the most influential voices in the industry.
From CEOs and Founders to CRO Managers and more, these experts share the lessons they’ve learned throughout their careers in experimentation at top tech companies and insights on where the optimization industry is heading.
Whether you’re an A/B testing novice or a seasoned pro, here are some of our favorite influencers in CRO and experimentation that you should follow:
Ronny Kohavi
Ronny Kohavi, a pioneer in the field of experimentation, brings over three decades of experience in machine learning, controlled experiments, AI, and personalization.
He was a Vice President and Technical Fellow at Airbnb. Prior to that, he was Technical Fellow and Corporate Vice President at Microsoft, where he led the analysis and experimentation team (ExP). Before that, he was Director of Personalization and Data Mining at Amazon.
Ronny teaches an online interactive course on Accelerating Innovation with A/B Testing, which was attended by over 800 students
Ronny’s work has helped lay the foundation for modern online experimentation, influencing how some of the world’s biggest companies approach testing and decision-making.
He advocates for a gradual rollout approach over the typical 50/50 split at launch:
“One thing that turns out to be really useful is to start with a small ramp-up. Even if you plan to go to 50% control and 50% treatment, start at 2%. If something egregious happens—like a metric dropping by 10% instead of the 0.5% you’re monitoring for—you can detect it in near real time.”
This slow ramp-up helps teams catch critical issues early and protect user experience.
Talia Wolf is a conversion optimization specialist and founder & CEO of Getuplift, where she helps businesses boost revenue, leads, engagement, and sales through emotional targeting, persuasive design, and behavioral data.
She began her career at a social media agency, where she was introduced to CRO, then served as Marketing Director at monday.com before launching her first agency, Conversioner, in 2013.
Talia teaches companies to optimize their online presence using emotionally-driven strategies. She emphasizes that copy and visuals should address customers’ needs rather than focusing solely on the product.
For Talia, emotional marketing is inherently customer-centric and research-based. From there, experiments can be built into A/B testing platforms using a clear North Star metric—whether checkouts, sign-ups, or add-to-carts—to validate hypotheses and drive growth.
Elissa Quinby is the Head of Product Marketing at e-commerce acceleration platform Pattern, with a career rooted in retail, marketing, and customer experience.
Before joining Pattern, she led retail marketing as Senior Director at Quantum Metric. She began her career as an Assistant Buyer at American Eagle Outfitters, then spent two years at Google as a Digital Marketing Strategist. Elissa went on to spend eight years at Amazon, holding roles across marketing, program management, and product.
Elissa emphasizes the importance of starting small to build trust with new customers. “The goal is to offer value in exchange for data,” she explains, pointing to first-party data as the “secret sauce” behind many successful companies.
She encourages brands to experiment with creative ways of gathering customer information—always with trust at the center—so they can personalize experiences and deepen customer understanding over time.
Lukas Vermeer, Director of Experimentation at Vista, is an expert in designing, implementing, and scaling experimentation programs. He previously spent over eight years at Booking.com, where he held roles as a product manager, data scientist, and ultimately Director of Experimentation.
With a background in machine learning and AI, Lukas specializes in building the infrastructure and processes needed to scale testing and drive business growth. He also consults with companies to help them launch and accelerate their experimentation efforts.
Given today’s fast-changing environment, Lukas believes that roadmaps should be treated as flexible guides rather than rigid plans: “I think roadmaps aren’t necessarily bad, but they should acknowledge the fact that there is uncertainty. The deliverable should be clarifications of that uncertainty, rather than saying, ‘In two months, we’ll deliver feature XYZ.’”
Instead of promising final outcomes, Lukas emphasizes embracing uncertainty to make better, data-informed decisions.
Jonny Longden is the Chief Growth Officer at Speero, with over 17 years of experience improving websites through data and experimentation. He previously held senior roles at Boohoo Group, Journey Further, Sky, and Visa, where he led teams across experimentation, analytics, and digital product.
Jonny believes that smaller companies and startups—especially in their early, exploratory stages—stand to benefit the most from experimentation. Without testing, he argues, most ideas are unlikely to succeed.
“Without experimentation, your ideas are probably not going to work,” Jonny says. “The things that seem obvious often don’t deliver results, and the ideas that seem unlikely or even a bit silly can sometimes have the biggest impact.”
For Jonny, experimentation isn’t just a tactic—it’s the only reliable way to uncover what truly works and drive meaningful, data-backed progress.
Ruben de Boer is a Lead CRO Manager at Online Dialogue and founder of Conversion Ideas, with over 14 years of experience in data and optimization.
At Online Dialogue, he leads the team of Conversion Managers—developing skills, maintaining quality, and setting strategy and goals. Through his company, Conversion Ideas, Ruben helps people launch their careers in CRO and experimentation by offering accessible, high-quality courses and resources.
Ruben believes experimentation shouldn’t be judged solely by outcomes. “Roughly 25% of A/B tests result in a winner, meaning 75% of what’s built doesn’t get released—and that can feel like failure if you’re only focused on output,” he explains.
Instead, he urges teams to shift their focus to customer-centric insights. When the goal becomes understanding the user—not just releasing features—the entire purpose of experimentation evolves.
David Mannheim is a digital experience strategist with over 15 years of expertise helping brands like ASOS, Sports Direct, and Boots elevate their conversion strategies.
He is the CEO and founder of Made With Intent, focused on advancing innovative approaches to personalization through AI. Previously, he founded User Conversion, which became one of the UK’s largest independent CRO consultancies.
David recently authored a book exploring what he calls the missing element in modern personalization: the person. “Remember the first three syllables of personalization,” he says. “That often gets lost in data.”
He advocates for shifting focus from short-term gains to long-term customer value—emphasizing metrics like satisfaction, loyalty, and lifetime value over volume-based wins.
“More quality than quantity,” David explains, “and more recognition of the intangibles—not just the tangibles—puts brands in a much better place.”
Marianne Stjernvall has over a decade of experience in CRO and experimentation, having executed more than 500 A/B tests and helped over 30 organizations grow their testing programs.
Marianne is the founder of Queen of CRO and co-founder of ConversionHub, Sweden’s most senior CRO agency. As an established CRO consultant, she helps organizations build experimentation-led cultures grounded in data and continuous learning.
Marianne also teaches regularly, sharing her expertise on the full spectrum of CRO, A/B testing, and experimentation execution.
She stresses the importance of a centralized testing approach:
“If each department runs experiments in isolation, you risk making decisions based on three different data sets, since teams will be analyzing different types of data. Having clear ownership and a unified framework ensures the organization works cohesively with tests.”
Ben Labay is the CEO of Speero, blending academic rigor in statistics with deep expertise in customer experience and UX.
Holding degrees in Evolutionary Behavior and Conservation Research Science, Ben began his career as a staff researcher at the University of Texas, specializing in data modeling and research.
This foundation informs his work at Speero, where he helps organizations leverage customer data to make better decisions.
Ben emphasizes that insights should lead to action and reveal meaningful patterns. “Every agency and in-house team collects data and tests based on insights, but you can’t stop there.”
Passionate about advancing experimentation, Ben focuses on developing new models, applying game theory, and embracing bold innovation to uncover bigger, disruptive insights.
André Morys, CEO and founder of konversionsKRAFT, has nearly three decades of experience in experimentation, digital growth, and e-commerce optimization.
Fueled by a deep fascination with user and customer experience, André guides clients through the experimentation process using a blend of data, behavioral economics, consumer psychology, and qualitative research.
He believes the most valuable insights lie beneath the surface. “Most people underestimate the value of experimentation because of the factors that are hard to measure,” André explains.
“You cannot measure the influence of experimentation on your company’s culture, yet that impact may be ten times more important than the immediate uplift you create.”
This philosophy is central to his “digital experimentation framework,” which features his signature “Iceberg Model” to capture both measurable and intangible effects of testing.
Jeremy Epperson is the founder of Thetamark and has dedicated 14 years to conversion rate optimization and startup growth. He has worked with some of the fastest-growing unicorn startups in the world, researching, building, and implementing CRO programs for more than 150 growth-stage companies.
By gathering insights from diverse businesses, Jeremy has developed a data-driven approach to identify testing roadblocks, allowing him to optimize CRO processes and avoid the steep learning curves often associated with new launches.
In his interview, Jeremy emphasizes focusing on customer experience to drive growth. He explains, “We will do better as a business when we give the customer a better experience, make their life easier, simplify conversion, and eliminate the roadblocks that frustrate them and cause abandonment.”
His ultimate goal with experimentation is to create a seamless process from start to finish.
Chad Sanderson is the CEO and founder of Gable, a B2B data infrastructure SaaS company, and a renowned expert in digital experimentation and large-scale analysis.
He is also a product manager, public speaker, and writer who has lectured on topics such as the statistics of digital experimentation, advanced analysis techniques, and small-scale testing for small businesses.
Chad previously served as Senior Program Manager for Microsoft’s AI platform and was the Personalization Manager for Subway’s experimentation team.
He advises distinguishing between front-end (client-side) and back-end metrics before running experiments. Client-side metrics, such as revenue per transaction, are easier to track but may narrow focus to revenue growth alone.
“One set of metrics businesses mess up is relying only on client-side metrics like revenue per purchase,” Chad explains. “While revenue is important, focusing solely on it can drive decisions that overlook the overall impact of a feature.”
With a background in Global Business Management and Marketing, Computer Science, and Industrial Engineering, Carlos founded Floqq—Latin America’s largest online education marketplace.
In 2014, he founded Product School, now the global leader in Product Management training.
Carlos believes experimentation has become more accessible and essential for product managers. “You no longer need a background in data science or engineering to be effective,” he says.
He views product managers as central figures at the intersection of business, design, engineering, customer success, data, and sales. Success in this role requires skills in experimentation, roadmapping, data analysis, and prototyping—making experimentation a core competency in today’s product landscape.
Bhavik Patel is the Data Director at Huel, an AB Tasty customer, and the founder of CRAP Talks, a meetup series connecting CRO professionals across Conversion Rate, Analytics, and Product.
Previously, he served as Product Analytics & Experimentation Director at Lean Convert, where he led testing and optimization strategies for top brands. With deep expertise in personalization, experimentation, and data-driven decision-making, Bhavik helps teams evolve from basic A/B testing to strategic, high-impact programs.
With a focus on experimentation, personalization, and data-driven strategy, Bhavik leads teams in creating better digital experiences and smarter testing programs.
His philosophy centers on disruptive testing—bold experiments aimed at breaking past local maximums to deliver statistically meaningful results. “Once you’ve nailed the fundamentals, it’s time to make bigger bets,” he says.
Bhavik also stresses the importance of identifying the right problem before jumping to solutions: “The best solution for the wrong problem isn’t going to have any impact.”
Rand Fishkin is the co-founder and CEO of SparkToro, creators of audience research software designed to make audience insights accessible to all.
He also founded Moz and co-founded Inbound.org with Dharmesh Shah, which was later acquired by HubSpot in 2014. Rand is a frequent global keynote speaker on marketing and entrepreneurship, dedicated to helping people improve their marketing efforts.
Rand highlights the untapped potential in niche markets: “Many founders don’t consider the power of serving a small, focused group of people—maybe only a few thousand—who truly need their product. If you make it for them, they’ll love it. There’s tremendous opportunity there.”
A strong advocate for risk-taking and experimentation, Rand encourages marketers to identify where their audiences are and engage them directly there.
Shiva Manjunath is the Senior Web Product Manager of CRO at Motive and host of the podcast From A to B. With experience at companies like Gartner, Norwegian Cruise Line, and Edible, he’s spent years digging into user behavior and driving real results through experimentation.
Shiva is known for challenging the myth of “best practices,” emphasizing that optimization requires context, not checklists. “If what you believe is this best practice checklist nonsense, all CRO is just a checklist of tasks to do on your site. And that’s so incorrect,” he says.
At Gartner, a simplified form (typically seen as a CRO win) led to a drop in conversions, reinforcing his belief that true experimentation is about understanding why users act, not just what they do.
Through his work and podcast, Shiva aims to demystify CRO and encourage practitioners to think deeper, test smarter, and never stop asking questions.
Heatmaps: Your Team’s Secret Weapon for Uncovering Website Gold
AB Tasty
What are heatmaps? (and why your team needs them)
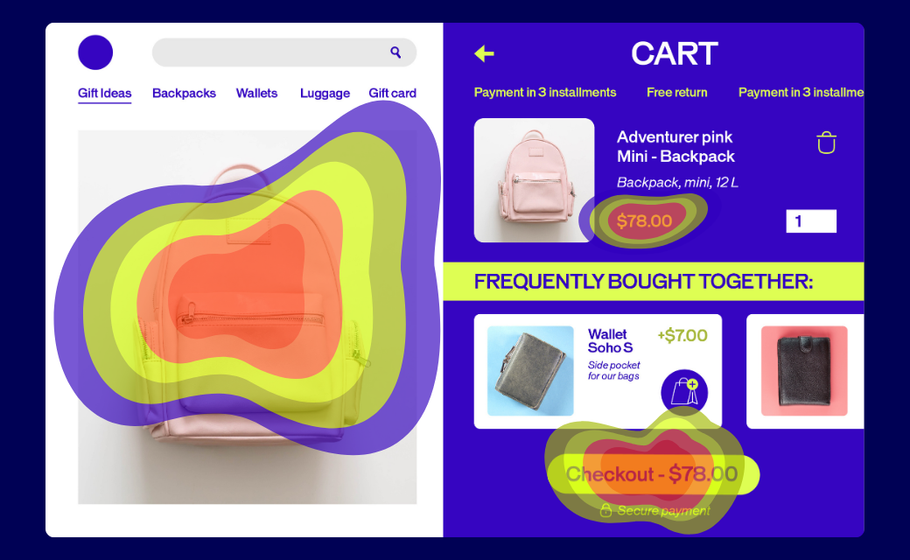
Think of heatmaps as your website’s truth-teller. They’re visual snapshots showing exactly where visitors click, scroll, and linger. No guesswork required.
Here’s how they work: Warm colors (reds, oranges) highlight the hotspots where users engage most. Cool colors (blues, greens) reveal the overlooked zones that might need attention.
The best part? Your visitors do all the heavy lifting. They show you what’s working and what’s not, so your team can make changes that actually move the needle.
Spot the signals: When to bring heatmaps into play
Heatmaps aren’t just pretty pictures—they’re your optimization toolkit’s MVP. Here’s how they deliver the biggest impact:
Measuring real engagement
Writing content that no one reads? Heatmaps show you exactly where readers drop off. If only 10% of visitors reach your CTA, it’s time to shake things up.
Tracking what matters: Actions
Are people clicking where you want them to? Heatmaps reveal if visitors complete your desired actions—or where they’re getting stuck instead.
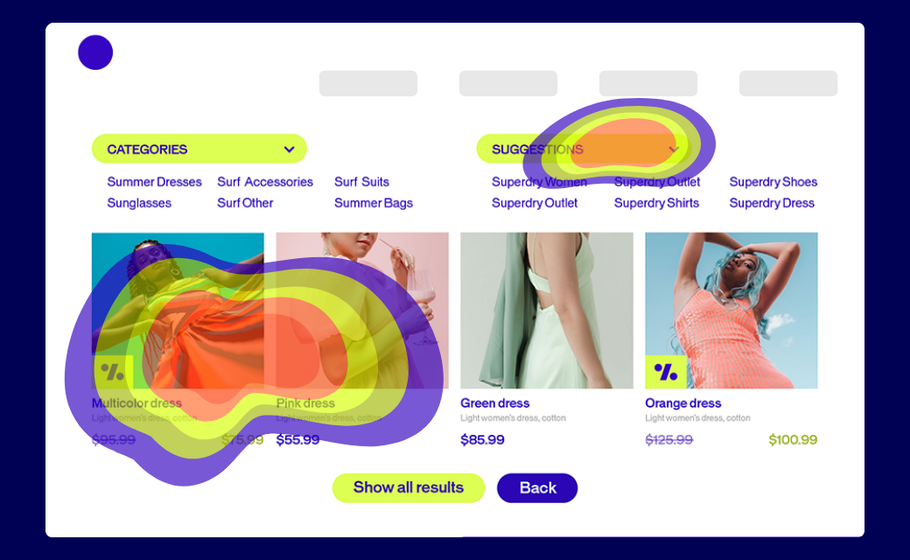
Highlighting where attention sticks (and slips)
What grabs your attention first? What images distract from your main message? Heatmaps answer these questions so you can double down on what works.
Once you have these insights, bigger questions become easier to tackle:
Where should we place our most important content?
How can we use images and videos more effectively?
What’s pulling attention away from our goals?
The essential heatmap lineup every team needs
Most modern heatmap tools offer multiple views of user behavior. We partner closely with some of the major players already. Let’s break down the most common ones you’ll come across.
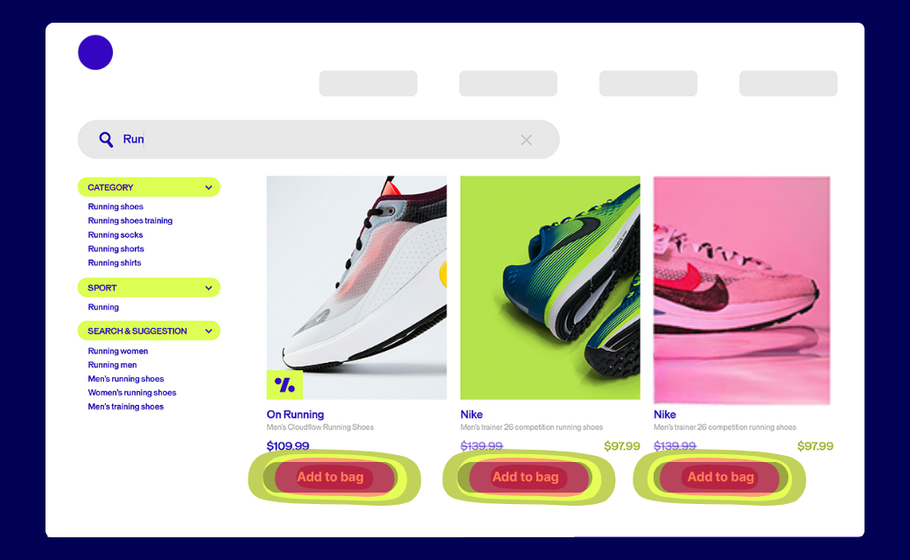
Click Heatmaps: The Action Tracker
These maps show every click on your page, with dense concentrations appearing as bright white areas surrounded by warm colors. Think of them as your conversion reality check.
What it tells you: Whether people click where you want them to—or if they’re trying to click non-clickable elements that look interactive.
How to use it: Look for clicks scattered around non-interactive text or images. These “frustrated clicks” signal design problems. If users are clicking on underlined text that isn’t a link, or images they expect to be clickable, you need to either make those elements functional or redesign them to look less interactive.
Pro tip: Compare click density on your primary CTA versus other page elements. If secondary elements are getting more clicks than your main conversion button, it’s time to redesign your visual hierarchy.
Scroll Heatmaps: The Attention Meter
See how far down visitors scroll and what percentage of users reach each section of your page. This is crucial for understanding whether your important content is actually being seen.
What it tells you: If users actually see your important content or bail before reaching your CTA. Most importantly, it shows you the “fold line”—where 50% of users stop scrolling.
How to use it: Identify the scroll percentage where you lose half your audience, then ensure all critical elements (value propositions, CTAs, key benefits) appear above that line. If your main CTA is only seen by 20% of visitors, move it higher or add secondary CTAs above the fold.
Pro tip: Use scroll maps to optimize content length. If 80% of users stop reading halfway through your blog post, either shorten the content or add more engaging elements (images, subheadings, interactive elements) to keep them scrolling.
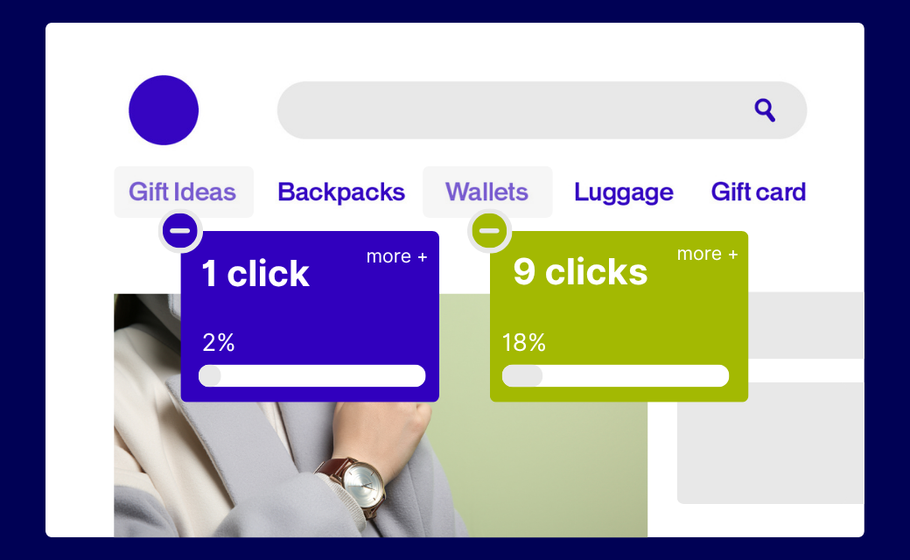
Click Percentage Maps: The Element Analyzer
This view breaks down clicks by specific elements, showing exactly how many people clicked each button, image, or link as a percentage of total visitors.
What it tells you: Which elements deserve prime real estate and which ones are dead weight. You’ll see precise engagement rates for every clickable element on your page.
How to use it: Rank your page elements by click percentage to understand what’s actually driving engagement. If your newsletter signup gets 15% clicks but your main product CTA only gets 3%, you might need to redesign your primary call-to-action or reconsider your page goals.
Pro tip: Use this data to inform A/B tests. If one button consistently outperforms others, test applying its design (color, size, copy) to underperforming elements.
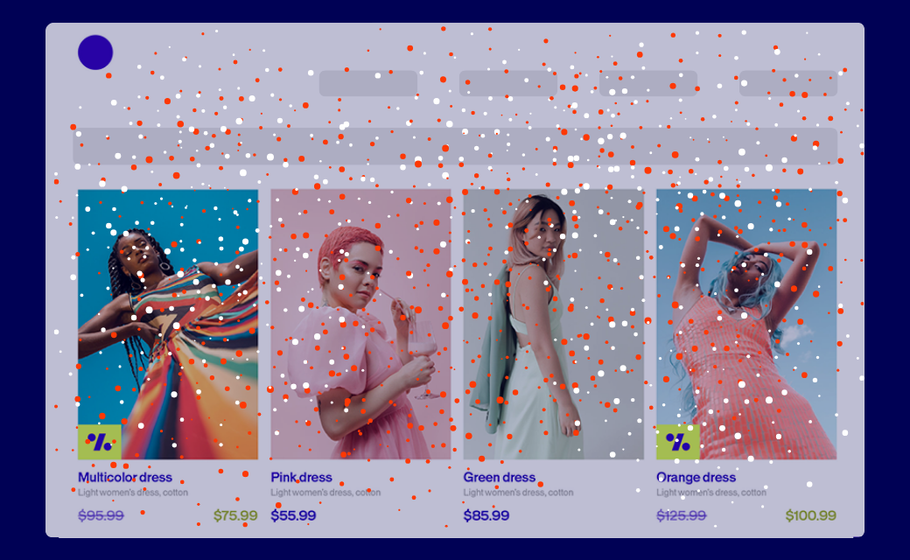
Confetti Maps: The Individual Click Tracker
Instead of showing click density, these maps display each individual click as a colored dot. Perfect for spotting users trying to click non-clickable areas or understanding click patterns in detail.
What it tells you: Where to add functionality or remove confusion. Each dot represents a real user’s intent to interact with something on your page.
How to use it: Look for clusters of dots over non-interactive elements—these represent frustrated users trying to click things that don’t work. Also watch for dots scattered far from any actual buttons or links, which might indicate responsive design issues or accidental clicks.
Pro tip: Filter confetti maps by traffic source or user segment. Mobile users might have different click patterns than desktop users, and organic traffic might behave differently than paid traffic.
Mobile-Specific Heatmaps: The Touch Tracker
Modern tools capture mobile-specific actions like taps, swipes, pinches, and multi-touch gestures—because mobile behavior is fundamentally different from desktop.
How to use it: Create separate heatmaps for mobile and desktop traffic. Mobile users typically scroll faster, have shorter attention spans, and interact differently with buttons and forms. Use this data to optimize button sizes, reduce form fields, and adjust content layout for mobile-first experiences.
Pro tip: Pay special attention to thumb-reach zones on mobile heatmaps. Elements that are easy to tap with a thumb (bottom third of screen, right side for right-handed users) typically get higher engagement rates.
Learn more about best practices for designing for mobile experiences with our Mobile Optimization Guide.
Eyes vs. clicks: Understanding the key differences
While heatmaps track mouse movements and clicks, eye-tracking follows actual gaze patterns. Eye-tracking gives deeper insights but requires specialized equipment most teams don’t have.
The good news? AI-powered tools like Feng-Gui and EyeQuant now simulate eye-tracking through algorithms, making this technology more accessible.
Bottom line: Start with heatmaps. They’re easier to implement and give you actionable insights right away.
Features that make or break your heatmapping game
Not all heatmap tools are created equal. Here’s what your team should prioritize:
Must-have features:
Audience Segmentation: Create maps for specific user groups (new vs. returning visitors, mobile vs. desktop)
Map Comparison: Easily compare results across different segments
Page Templates: Aggregate data for similar page types (crucial for e-commerce sites)
Mobile Optimization: Track touch, scroll, and swipe behaviors
Export Capabilities: Share results with your team effortlessly
Dynamic Element Tracking: Capture interactions with dropdowns, sliders, and AJAX-loaded content
Historical Data: Preserve old heatmaps even after design changes
Test smarter with heatmap insights
Here’s where things get exciting. Heatmaps show you the problems, but how do you know if your fixes actually work?
Enter A/B testing.
This three-step approach turns insights into results:
Identify problems with heatmaps
Test potential solutions with A/B testing
Choose the highest-performing solution based on data
Real Example:
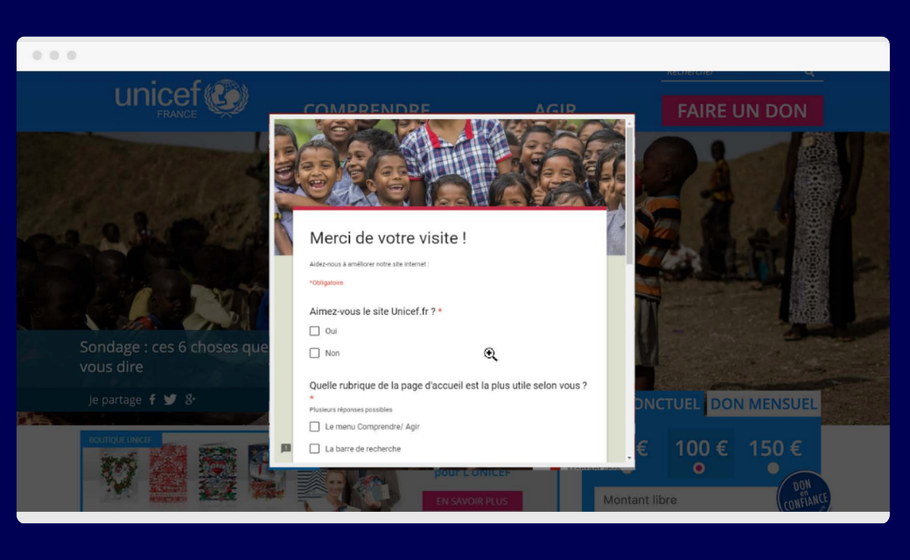
Nonprofit UNICEF France wanted to better understand how visitors perceived its homepage ahead of a major redesign.
Their move: UNICEF France combined on-site surveys with heatmapping to gather both qualitative feedback and visual behavioral data.
The result: Heatmaps showed strong engagement with the search bar, while surveys confirmed it was seen as the most useful element. Less-used features, like social share icons, were removed in the redesign—resulting in a cleaner, more user-focused homepage.
Ready to put heatmaps to work? Here’s your game plan:
Start small. Pick one high-traffic page and run your first heatmap analysis.
Look for patterns. Are users clicking where you expect? Scrolling to your key content? Getting stuck somewhere?
Test your hunches. Use A/B testing to validate any changes before rolling them out site-wide.
Iterate forward. Heatmaps aren’t a one-and-done tool but part of your ongoing optimization process.
Remember: every click tells a story. Every scroll reveals intent. Your visitors are already showing you how to improve—you just need to listen.
Ready to see what your visitors are really doing? Heatmaps give you the insights. A/B testing helps you act on them. Together, they’re your path to better conversions and happier users.
Test, Dress, Impress: Top Fashion Consumer Trends 2025
Kate Feng
Forget traditional shopping journeys, today’s fashion consumers are rewriting the rules! Our 2025 Fashion Consumer Trends report reveals the shifts in how consumers discover, decide, and commit to fashion brands today.
Introduction
In a recent webinar, 3 experimentation leaders came together to unpack the latest consumer trends shaping the fashion industry. The conversation brought together Ben Labay, CEO of Speero, Jonny Longden, Speero’s Chief Growth Officer, and Mary Kate Cash, Head of Growth Marketing for North America at AB Tasty. They shared valuable insights from AB Tasty’s recent global fashion consumer survey, highlighting what drives inspiration, conversion, and retention in today’s fast-evolving fashion landscape.
Social Media is Changing the Game
Traditional search engines remain the top channel for fashion discovery, followed by direct website visits, Google Shopping, and Social Media ads. However, the differences between these top four channels are shrinking year over year, with social media rapidly gaining ground, especially among Gen Z consumers, where 60% of survey respondents highlighted Social Media ads as their preferred avenue to finding new products. Jonny predicts this trend will expand across all age groups.
“Social and fashion just go so hand in hand. The big change that’s happened with social is that fashion itself has become more rapid in the way it changes, and so it’s really driving different consumer behaviour.”
Jonny Longden, Chief Growth Officer at Speero
Different Channels, Different Mindsets
People use search when they know what they want. Social media, on the other hand, encourages experimentation. As Ben pointed out, shoppers arriving from social media are often inspired to try new styles or connect with communities, engaging in “social shopping” and not just focusing on finding a specific product. This opens the door for more tailored experiences based on where customers are coming from and what type of inspiration they’re seeking.
What the Fashion Consumer Trends 2025 Tell Us About Expectations
Reward Loyalty in Meaningful Ways – When asked how brands could make customers’ experiences more personal, the top answer was clear: rewarding brand loyalty. Discounts, early access, or perks for repeat buyers make shoppers feel seen and increase the chances of account creation and repeat visits.
Jonny pointed out that “the really interesting tension in this whole industry at the moment is the difference between what is the right thing to do and what is the profitable thing to do. about finding that balance is experimentation in the broadest sense of the word.”
Make Recommendations That Actually Fit – Consumers want relevant suggestions that go beyond basic personalization. Jonny compared it to having a personal stylist: a brand should know both the customer and the market, understanding trends and styles while matching these to individual preferences.
What Actually Drives Conversions
When it comes to converting browsers into buyers, shoppers across generations are surprisingly aligned.
Product quality leads the way across all age groups and regions. Shoppers are still willing to pay for craftsmanship, comfort, and durability, even in a price-sensitive market.
Discounts come next, but the strategy matters. Overuse can cheapen brand perception. As Jonny put it: “Fashion, especially the lower price point fashion has ended up in a kind of race to the bottom where discounting is the way to compete. […] and a lot of consumers wouldn’t consider paying full price. The challenge is how to be careful with the commerciality of discounting.”
Sizing and fit clarity also ranks high, especially in fashion, where hesitation often comes from uncertainty about how something will feel or look. Ben noted that some major retailers are tackling this head-on, investing heavily in tools to improve sizing and try-on experiences.
For Gen Z, high-quality reviews and transparency around production methods, sustainability, and pricing are big drivers. Ben shared tactical approaches to transparency on product detail pages, like using engaging CTAs such as “Do you want to know a secret?” to reveal value props related to sustainability and ethical production.
Why Shoppers Abandon Carts
Cart abandonment remains a major friction point, and two reasons dominate globally:
Not ready to buy – Many shoppers use the cart to explore shipping, delivery timeframes, or total cost before making a decision. Jonny explained it simply: “People use the checkout of an ecommerce website just to see what’s gonna happen. […] When’s it gonna be delivered? What are the delivery options? How much is delivery gonna cost?
Payment Methods not being accepted – This came in a close second, showing how overlooked payment flexibility still is. Buy-now-pay-later options like Klarna may move the needle, especially in fashion, where customers often purchase multiple sizes with the intention of returning some items. Jonny emphasized that payment method testing is one of the best arguments for AB testing and experimentation, as the “best practice” of offering many payment options doesn’t always lead to better conversion.
Retention: Loyalty Built on Familiarity
Finally, we explored what drives customers to create accounts with fashion brands, buy products from them, and what motivates them to stick around.
Loyalty Rewards Drive Engagement – Globally, the top reason for account creation is earning loyalty points, especially among Gen Z and Millennials. Discounts and sale updates follow closely behind.
Balancing Novelty and Trust – Shoppers crave both newness and familiarity: new products ranked highest in driving retention, but previously purchased items and trusted brands followed close behind. This balance is key to keeping customers engaged long-term.
Jonny raised an interesting point: a lot of loyalty programs end up rewarding people who would have come back anyway. Mary Kate added that tools like segmentation can help brands tell the difference between genuinely loyal customers and those just passing through, making it easier to design rewards that actually make an impact.
While conventional wisdom discourages forced account creation, Ben challenged this assumption, arguing it can work when paired with compelling promotions or rewards, especially in social ads. “Social ads that inspire and combine short-term promotions, rewards, and discounts are increasingly leading into forced account creation sequences.”
Conclusion
As shown in our 2025 Fashion Consumer Trends report, the e-commerce fashion industry is evolving, along with consumer expectations. To remain competitive, brands must go beyond simply selling products. They must deliver seamless, personalized shopping experiences that speak directly to the modern shopper’s needs.
This is where experimentation becomes a critical advantage. The most successful brands are those willing to test assumptions about everything from product discovery and presentation to payment options, loyalty strategies, and the evolving role of social commerce. Experience optimization is no longer a nice-to-have. It’s the foundation for building trust, loyalty, and long-term growth in the fast-moving world of online fashion.
Want a deeper dive? Watch the full webinar below to hear expert insights and practical strategies shaping the future of fashion commerce.
Tag V4: Elevating your Experience Building with an Improved Modification Engine
Julie Dumont
At AB Tasty, we love providing our users with the best possible experience by making it easy to create and execute optimization campaigns. That’s why we recently significantly improved our Modification Engine, one of the core components of our Visual Editor and our JavaScript tag.
The Modification Engine is the system that dynamically alters our client’s website content and appearance without requiring direct changes to the source code. It applies the modifications defined in campaigns by injecting the changes via JavaScript on the visitor’s browser.
Here are the two big improvements:
Maximum compatibility with our clients’ websites, including Shadow DOM and iFrames support.
Optimized performance for faster loading and smoother execution of modifications, enhancing the experience for visitors on our clients’ sites.
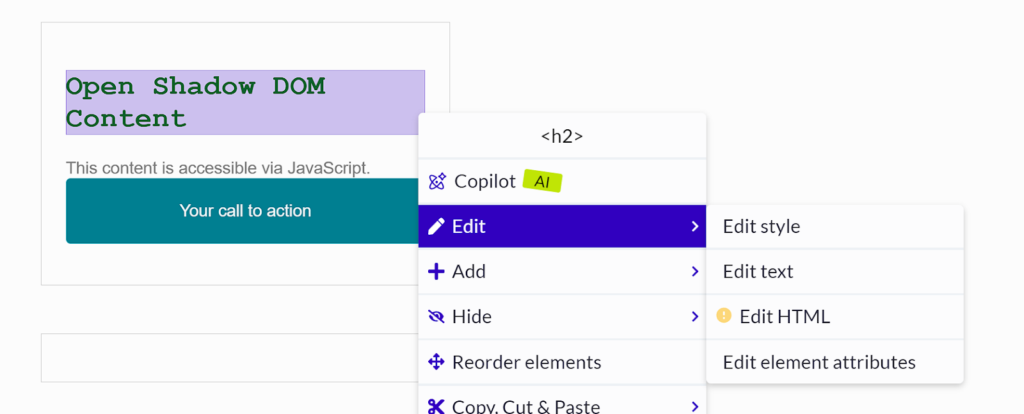
Enhanced Compatibility with Modern Technologies
Our clients are developing increasingly complex websites, utilizing technologies like Shadow DOM and iFrames to structure their web applications. Now, our Visual Editor is compatible with these technologies so you can create, modify, and manage content to deliver the latest in experiences to your visitors.
A lighter JavaScript tag: The overall impact of AB Tasty has already been reduced by 2.3 KB, with further optimizations planned.
Less impact on overall performance: We observed an improvement up to 11% in website performance, depending on the number of modifications applied.
Optimized Loading and Execution Times
More efficient JavaScript execution: The average execution time for modifications is 30% to 55% faster.
Decreased “Render Blocking Time”: Improvements range from 11% to 50%, with even greater benefits for larger campaigns.
No longer classified as a “Long main-thread task”
Faster Application and Reapplication of Modifications
Another key improvement in this update is the speed of applying and reapplying modifications:
Applying modifications is 2.2 to 2.75 times faster.
Reapplying modifications is 4 to 5.7 times faster, a major advantage for dynamic A/B testing.
Real-World Examples
We conducted tests on various campaigns to measure these improvements in action:
Campaign with 19 Modifications:
Total execution time: 1.79ms (down from 3.96ms, 2.2 times faster).
Reapplying time after a modification is removed: 0.58ms (down from 3.34ms, 5.7 times faster).
up to 5% improvement in overall site performance.
Campaign with 64 Modifications:
Total application time: 4ms (down from 10-11ms, 2.5 to 2.75 times faster).
Reapplying time after a modification is removed: 2.7ms (down from 11-12ms, 4 to 4.4 times faster).
Up to 11% improvement in overall site performance.
With these enhancements, our newest Modification Engine version is now more robust, faster, and better suited for modern websites.
You benefit from a smoother user experience, and your visitors enjoy faster loading times. And this is just the beginning: stay tuned for even more powerful optimizations in the coming months.
Feel free to test these improvements and share your feedback with us!
New Visual Studio Code Extension: Dev-Friendly Experimentation & Personalization
Julie Dumont
AB Tasty’s Visual Studio Code extension lets developers manage their experimentation and personalization campaigns directly from their IDE. This game-changing tool streamlines technical workflows and makes experimentation more accessible across your organization.
We’re all about making experimentation and personalization seamless for all teams. While AB Tasty’s UI is designed to be intuitive, we know that many developers prefer to work directly in their IDE. That’s why we built the AB Tasty Visual Studio Code extension—inspired by user feedback and driven by our mission to simplify the dev experience.
With this extension, you can:
Eliminate back-and-forth between your IDE and the AB Tasty web interface.
Leverage VS Code’s power: smart autocomplete, built-in linters, syntax highlighting, real-time validation, and more.
The benefits of VS Code Extension for server-side:
With AB Tasty’s Feature Experimentation and Roll-outs, from the Visual Studio Code Extension you can: ✅ Manage feature flags and product experimentation with a code-first approach ✅ Call key campaign resources (flags, targeting keys, goals) ✅ Detect and create feature flags directly from your codebase
The benefits of VS Code Extension for client-side:
With AB Tasty’s Web Experimentation and Personalization, from the Visual Studio Code Extension you can: ✅ Manage product experimentation with a code-first approach ✅ List and access segments, triggers, and favorite-URLs linked to your account ✅ List and access campaigns (variations, targeting, modifications) ✅ Manage JS scripts tied to accounts, campaigns, variations, and modifications
AB Tasty Joins the “Dev-Friendly” Movement
Our vision is clear: AB Tasty should adapt to developers, not the other way around. This extension is just the beginning—we have plenty more enhancements in the pipeline.
The Mobile Playbook: Personalization, Performance, and Profitability
John Hughes
Mobile commerce has revolutionized how consumers interact with brands — from browsing products on the go to researching the latest trends. Yet, despite mobile usage soaring, the full potential of mobile commerce remains untapped. While traffic from mobile devices continues to rise, conversion rates still trail behind other channels. What’s driving the gap between browsing and purchasing on mobile?
In this post, we’ll explore key mobile performance stats, delve into the challenges behind these numbers, and showcase how Quantum Metric and AB Tasty collaborate to help brands close this gap. If you want the your own mobile playbook, the insights shared here are based on data from Quantum Metric’s eBook, How Mobile Performance Builds Consumer Confidence.
1. Mobile is everywhere, but conversions lag.
Mobile traffic is not just a trend, it’s the backbone of online shopping. Consumers are increasingly using their phones for everything from discovering products to making final purchase decisions. However, despite this surge in mobile traffic, conversions still don’t match the volume of visits. So, what’s going wrong?
Insight:
Mobile accounts for 73% of monthly traffic, but only 47% of sales.
Travel sees the highest mobile traffic (73%), but the lowest sales share (39%).
Challenge: Consumers love to browse on mobile — reading reviews, comparing prices, and window shopping. But when it comes time to make a purchase, they often shift to desktops or other channels. This disconnect between browsing and buying is a critical challenge.
Solution: Quantum Metric delivers real-time insights to identify where users drop off in their mobile journeys, helping brands pinpoint key friction points. Armed with this data, AB Tasty can run A/B tests and experiments to optimize mobile conversions by improving layouts, simplifying checkout, or personalizing offers based on user behavior.
2. Personalization drives engagement (and sales).
With so much information available at their fingertips, consumers expect personalized experiences that speak to their unique preferences. But while mobile apps can deliver these tailored experiences, it’s not always the case that mobile users receive the level of customization they desire. So, how can brands keep up with the demand for hyper-personalized mobile experiences?
Insight:
39% of consumers prefer mobile apps, but 33% have reduced app usage.
Conversion rates on mobile apps are 3X higher than on mobile web.
Challenge: Consumers are increasingly expecting experiences that are customized to their preferences. Whether it’s personalized product recommendations or location-based offers, users demand content that resonates with them on a deeper level. But how do brands manage to provide this while maintaining convenience and ease of use?
Solution: Quantum Metric provides detailed session data, revealing exactly what users are engaging with and where they’re dropping off. AB Tasty then uses this data to create personalized experiences through hyper-targeted experiments, ensuring that each user sees content that’s most relevant to them — ultimately boosting engagement and driving conversions.
3. Building confidence in mobile transactions.
Even with mobile traffic growing, many consumers are still hesitant to make purchases — especially larger ones — on their phones. Trust is a major factor in whether or not a consumer feels confident enough to complete a mobile transaction. But how can brands overcome the hurdles of security concerns and poor mobile experiences?
Insight:
59% of consumers only feel confident making purchases of $50 or less on mobile.
Desktop AOVs are 70% higher than mobile for retail and nearly 2X higher for travel.
Challenge: Security concerns and clunky mobile experiences can drive away customers before they even hit the checkout button. Many consumers feel more comfortable making purchases on desktops, where they associate higher transaction values with a more secure, familiar environment.
Solution: Quantum Metric identifies friction points — slow load times, security concerns, or error messages — that can erode trust. AB Tasty uses A/B testing and experiments to address these pain points, creating smoother, more secure user flows that enhance trust and improve conversion rates.
4. Performance matters more than ever.
With consumers’ expectations for speed at an all-time high, mobile performance can make or break the user experience. From slow loading times to app crashes, mobile performance issues are a significant barrier to conversions. So how can brands ensure their mobile experiences are fast and seamless?
Insight:
59% of users have experienced slow performance; 43% have faced app crashes.
API error rates are 2-3X higher on mobile than desktop, with issues like long spinner rates causing 48% higher friction.
Challenge: Users have little patience for performance issues. A slow-loading page or app crash can lead to frustration and, ultimately, abandonment. The pressure to deliver fast, smooth mobile experiences is higher than ever.
Solution: Quantum Metric’s real-time data quickly highlights performance issues, from slow page loads to API errors. Once identified, AB Tasty can experiment with various solutions, optimizing mobile performance and delivering a smoother, faster user journey.
5. Turning data into action.
In the fast-paced mobile landscape, time is of the essence. Consumers expect quick, efficient mobile experiences, and if a transaction takes too long, they won’t hesitate to abandon it. So, how can brands ensure they are responding to user behavior in real time?
Insight:
55% of consumers will abandon a mobile transaction if it takes longer than 3-5 minutes.
Challenge: The pressure to scale innovation without losing sight of the customer is real. Mobile transactions need to be fast and seamless, or customers will simply walk away — especially when it comes to on-the-go transactions.
Solution: Quantum Metric empowers brands with real-time behavioral data that shows where and when users drop off during their mobile journey. AB Tasty then helps turn this data into action by running targeted experiments that address specific friction points, reducing abandonment and improving the overall mobile experience.
Conclusion: turning mobile commerce into your competitive edge.
Mobile commerce isn’t just another sales channel — it’s a key competitive advantage. To succeed, brands must focus on delivering fast, personalized, and secure mobile experiences that build consumer trust. By combining Quantum Metric’s real-time behavioral insights with AB Tasty’s experimentation platform, brands can close the gap between browsing and buying, unlocking the true potential of mobile commerce.
How The Contentsquare & AB Tasty Integration Improves Testing & Drives Results
John Hughes
The Contentsquare & AB Tasty integration helps you optimize your A/B testing lifecycle, driving high-value outcomes with low-risk scenarios. Let’s dive into how this integration will help you improve your customer experience (CX) and boost your growth metrics.
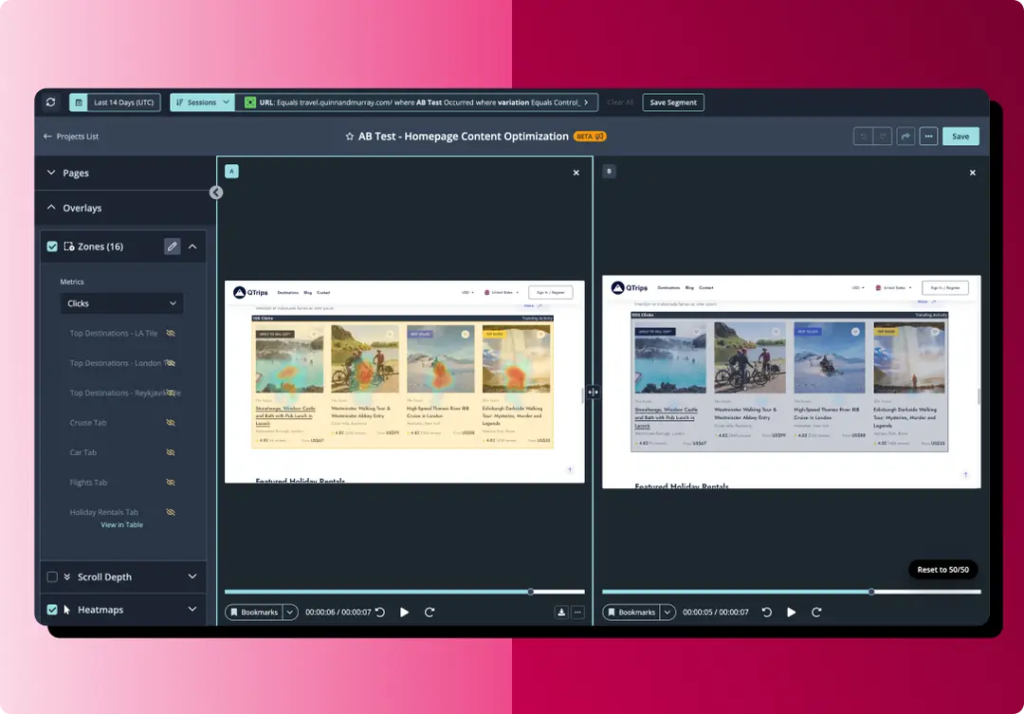
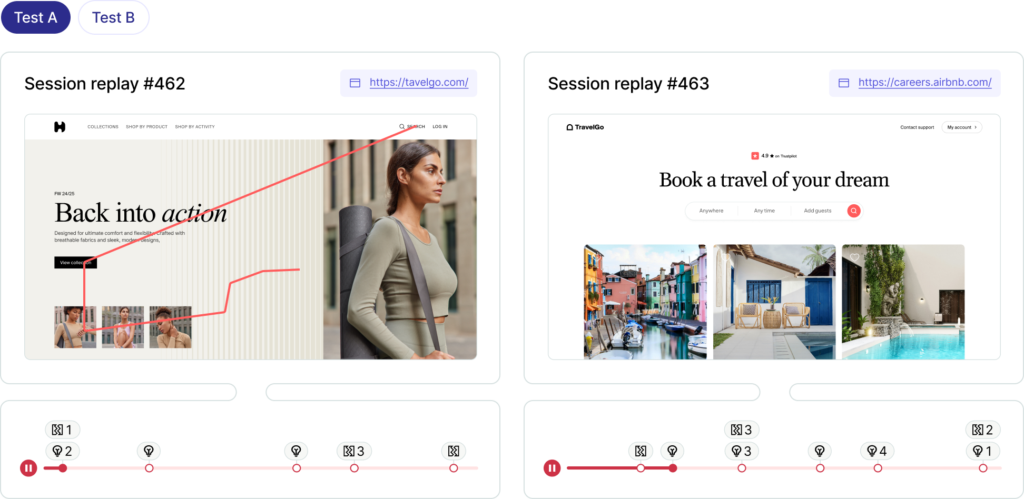
A side-by-side comparison of 2 webpages using Contentsquare analysis
An overview of the integration
When Contentsquare and AB Tasty are used separately, you only get half the success of your test results. Say you want to test a hero banner. Using AB Tasty, you test 2 versions, and find there’s no improvement to your conversion rate. But, perhaps one of the versions increased customer engagement? Without the help of Contentsquare, you’re limited in your view of how your tests impact your entire customer experience.
Or, let’s say you’ve analyzed your customer journey using Contentsquare and discovered one of your conversion pages has a high drop-off rate. You come up with a hypothesis as to why this might be the case and hard-code a change, but this leads to more drop-offs, not less. Without AB Tasty, you’re unable to test your hypotheses, which results in wasted time, resources, and a potentially worse customer experience.
But, it doesn’t have to be this way. By integrating Contentsquare and AB Tasty, you can dive deeper into your customer experience to pinpoint and prioritize the most critical friction points or opportunities to experiment. You can also build better hypotheses based on key metrics, create and run data-informed tests, and better understand why variations perform well (or not).
With Contentsquare, you gain a more comprehensive understanding of your customer experience, enabling you to conduct more informed, data-driven tests with AB Tasty.
Benefits of the Contentsquare and AB Tasty integration
Where Contentsquare provides deep and meaningful insights into your customer behavior, AB Tasty empowers you to act on those insights, in real time.
“AB Tasty is a technology partner with Contentsquare. We facilitate A/B testing, experimentation, personalization, and audience segmentation. We help facilitate activation of the data that you get out of Contentsquare to fuel that endless cycle of experimentation.”
Mary Kate Cassh, Head of Growth Marketing, North America, AB Tasty
Hyper-personalization features to deliver tailor-made experiences to boost conversion rates
A simplified, streamlined workflow that eliminates data silos by having data accessible across easy-to-understand dashboards
Greater business impact by uncovering hidden opportunities in your customer journey and testing your hypotheses before hard-coding changes
Comprehensive experiment analysis with easy-to-understand visuals and side-by-side comparisons of your control and variation
Continuous improvement to your digital strategy
Want to know the fundamentals of how the Contentsquare and AB Tasty integration works? Learn more.
How Contentsquare can inform your testing in AB Tasty
Let’s look at how this works in practice, using the framework of a continuous testing cycle. There are 5 stages to the continuous testing cycle—here’s how the Contentsquare and AB Tasty integration works to optimize each step along the way:
Stage 1: analysis phase
This first stage involves finding friction points or opportunities at each point of your customer journey. Then, it’s about generating test hypotheses to help solve or optimize the points that need the most attention.
You can break down this stage into 2 forms of analysis.
Innovation analysis, where you work out whether your content is optimized for the best customer experience you can provide
2. Troubleshooting analysis, where you uncover errors or friction points in the customer journey, preventing users from moving forward.
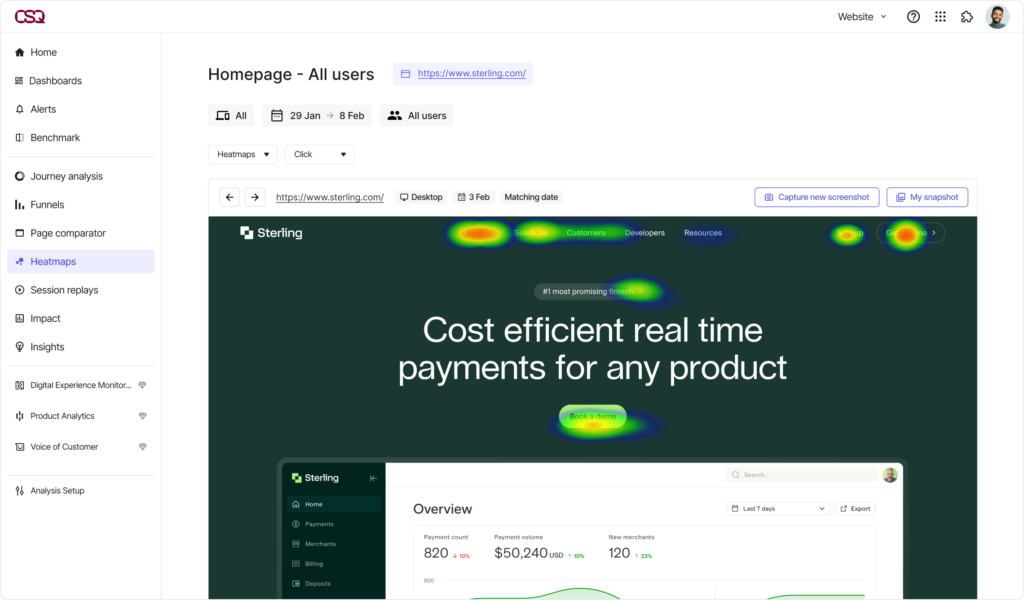
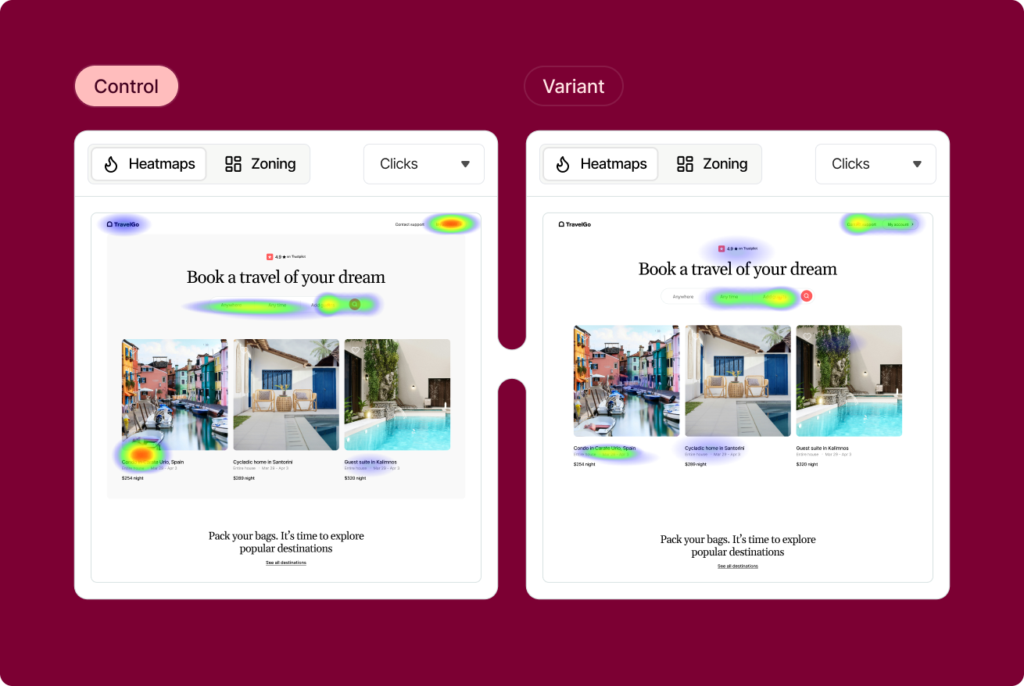
With Contentsquare’s Experience Analytics, you can find out how your customers are behaving page by page, from entry to exit, and why. With a suite of capabilities, you can deep-dive into your customer experience and analyze areas that need the most improvement.
Screenshot of Contentsquare’s Experience Analytics dashboard, open on the Heatmaps capability.
What are the behaviors of customers at critical conversion points?
What’s causing rage clicks or other frustration behaviors?
Where are customers encountering errors?
Rage clicks are when customers click on an element (clickable or not) of a website or app multiple times in frustration or anger. They’re often caused by technical issues, confusing navigation, or a cluttered design.
What’s the most attractive content/category on the page?
What’s leading to the most conversions? Is it visible enough?
In what order do customers consume the page?
Are there any frictions or rage clicks on the page?
Stage 2: analysis resolution
Now you’ve got a few hypotheses to test, it’s time to work out how to prioritize what to test first.
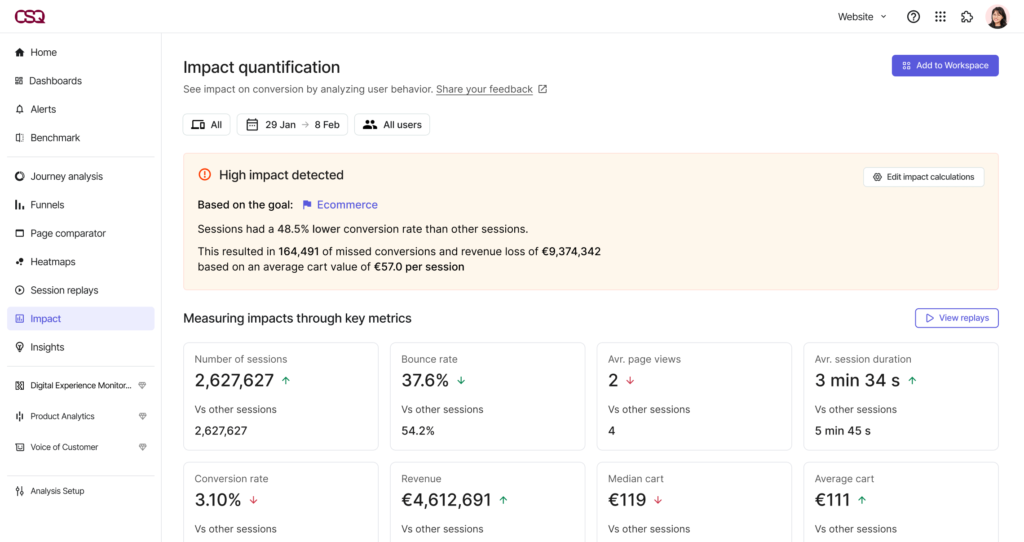
The focus should be on tests with low effort, high reward and those with the biggest impact on your key performance indicators (KPIs). Contentsquare’s Impact Quantification can help you prioritize your tests and make better decisions by assessing the impact of each test. All you need to do is clarify your goal and then segment users based on whether they completed the goal of your A/B test.
Contentsquare’s Impact Quantification in action.
Impact Quantification can then be used to compare these segments and confirm how much revenue the success of the test will likely generate.
Stage 3; experimentation roadmap
Once you’ve established which hypotheses have the greatest potential to impact your KPIs, it’s time to start fleshing out your testing roadmap.
This roadmap will help guide every step of your testing process—from the build to the design and copy and finally, the execution. This roadmap is where you detail who’s doing what and when, giving you an overview of your site. This is especially useful if you’re running tests on multiple pages.
The dos and don’ts of your testing roadmap
Do’s
✅ Run your tests in at least 2-week increments to account for site traffic cycles and seasonality.
✅ Color-code your roadmap for the different stages of your experimentation so it’s easy to quickly see where each test is at.
Don’t
❌ Have 2 tests running on 2 pages at the same time—it can muddy the data and lead you to potentially misread your results.
❌ Don’t run multiple tests on the same page independently—use multivariate tests to see how changes to multiple sections interact with one another.
Stage 4: start A/B testing
All that hard work has finally paid off—it’s time to put your hypotheses into action and start running tests with AB Tasty.
Using your roadmap as a guide, start building out your tests in AB Tasty to optimize, personalize, and improve your customer experience.
Stage 5: analysis and results
Get site statistics directly through AB Tasty and couple that with Contentsquare’s customer behavioral insights.
From AB Tasty, get direct reports based on page statistics—giving you a snapshot of what’s going on in your campaign testing period.
From Contentsquare, as soon as your test goes live, you can watch how your customers behave in the control and variation, side-by-side using Heatmaps and Session Replay. Get a visual understanding of why and how your customers behave differently in your variation and use these insights to inform your next testing phase.
How the partnership works in real life
Now that you know how the Contentsquare and AB Tasty partnership works, it’s time to see what it’s like in the real world.
Here’s how 2 leading brands have embraced the integration of experience analytics and experimentation into their CX to drive real growth outcomes.
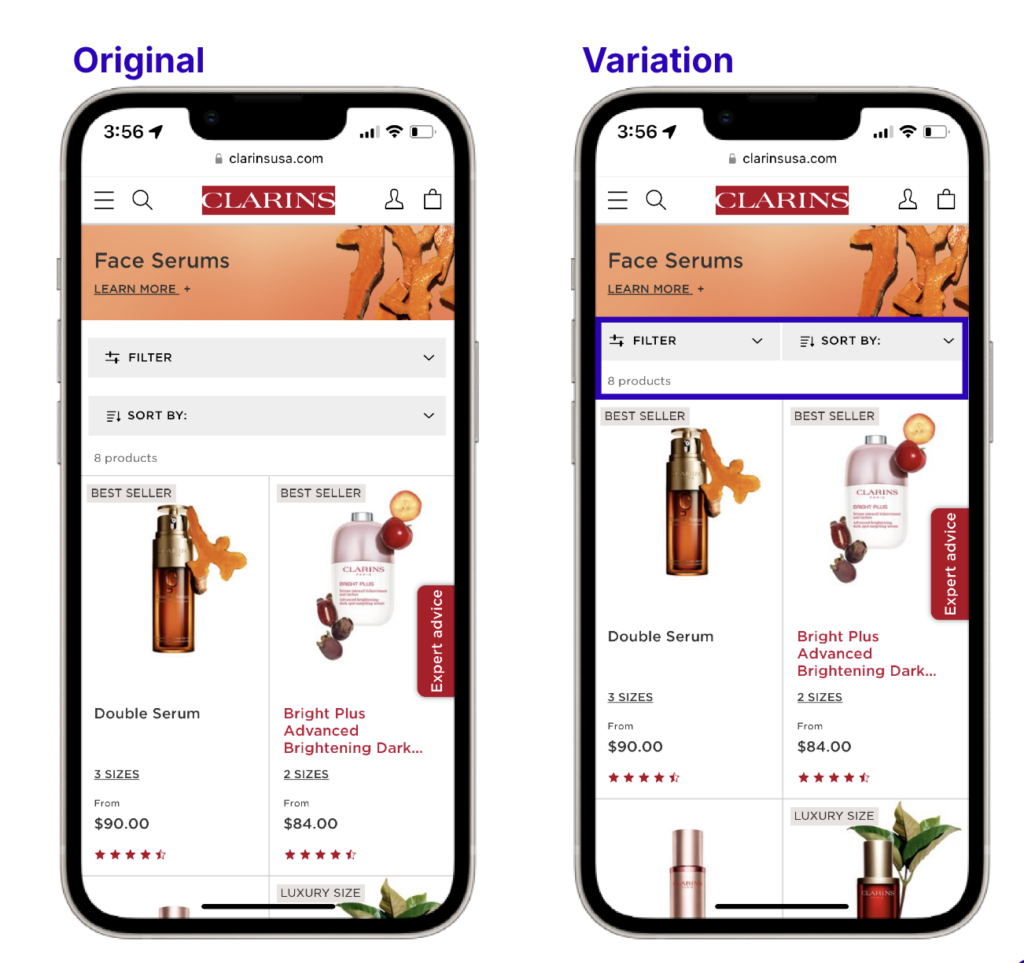
Clarins
Global skincare company Clarins wanted to find out whether a “wishlist” option on their site would help to increase pageviews and conversions.
Using the Contentsquare integration with AB Tasty, they tested adding a heart icon to their product listing pages (PLPs) and product description pages (PDPs). This heart allowed users to save their favorite products to potentially purchase them at a later stage.
This test increased the overall number of transactions and resulted in
+1.54% increase in basket page views
+1.83% increase in transactions
“We are really passionate about continually optimizing what we’re already doing well plus also testing new theories to drive a great customer experience and continue to drive the commercial priorities of our website.”—Roisin O’Brien, Ecommerce Trading Manager at Clarins UK
Rather than focusing on conversion rates, Mel Parekh, Head of ecommerce at Hotel Chocolate and his team wanted to focus on engagement and clickthrough rates.
Recognizing the importance of layout and user experience on customer engagement, the goal was to create a more visually appealing and intuitive homepage.
WithContentsquare’s integration with AB Tasty, his team redesigned the homepage, focusing on the category tiles, which were found to be the most attractive elements on the page.
By optimizing the homepage, they saw a
-10% reduction in bounce rates
+1.67% increase in visiting time
+0.54% increase in overall conversion rates, +7.24% increase on desktop
Mel Parekh, Head of ecommerce at Hotel Chocolate talked about customer loyalty at a recent Contentsquare CX Circle event.
Smarter insights with Contentsquare
Contentsquare is the all-in-one Experience Intelligence platform designed to be easily used by anyone that cares about digital journeys. With our flexible and scalable platform, you quickly get a deep understanding of your customers’ whole online journey.
Our AI-powered insights provide those “ah ha” moments you need to deliver the right experiences. You get to work faster and smarter with the confidence to know what to do next to improve your digital experiences. Leading brands use Contentsquare to grow their business, deliver more customer happiness and move with greater agility in a constantly changing world. Our insights are used to optimize the experience on over 1.3 million websites worldwide. For more information, visit: www.contentsquare.com