It’s no secret that today’s digital marketplace is highly competitive. Consumers are exposed to an increasingly high number of messages each day. How can you make your message relevant to your consumers and break through the noise?
To capture consumers’ attention, brands need to focus their attention on crafting unique user experiences to deliver 1:1 personalization based on data.
One of the most important focal points to convert visitors into customers and build customer loyalty is 1:1 personalization. More and more customers feel less motivated to complete a transaction when they’re online shopping if their experience is impersonal. Let’s take a look at some data from Forbes:
- 80% of consumers are more likely to complete an online purchase with brands that offer personalized customer experiences.
- 72% of consumers explain that they only interact with personalized messaging.
- 66% of consumers share that coming across content that isn’t personalized would deter them from purchasing.
Customers want personalization. Think about when you walk into a physical store and an employee really listens to your needs, helps you find exactly what you’re looking for, or goes above and beyond your expectations to help you. That is exactly what customers want in the digital marketplace.
A unique, digital one-to-one personalization experience strategy gives companies the potential to customize messages, offers, and other experiences to each website visitor based on data collected about each user.
Digital one-to-one personalization starts with concrete data. Are you leveraging data to better serve and convert your visitors?
To help you answer “yes” to this question, we’ll take a deeper look at:
- What is 1:1 personalization?
- What data helps you know your customers better?
- How to find data?
- How to leverage the data you find
- What messages should you personalize?
- Examples of one-to-one personalization

What is one-to-one personalization in marketing?
Delivering a unique (or one-to-one) experience to each online consumer is a technique known as one-to-one personalization in marketing.
By mastering the technique of 1:1 personalization, brands can deliver an exceptional level of customer service by providing personalized messages, product recommendations, offers, and specialized content at the right time based on the user’s needs and expectations.
This type of unique user experience is only made possible thanks to the availability of extensive customer data. If you don’t get to know your customers based on their interactions with your brand and user behavior, you’re missing an opportunity to meet your customers’ expectations.
One goal of personalization is to create a “wow” effect. This means you should be making the customer think, “wow, they really know me.” The more information that a company knows about a certain customer, the more personalized the user experience will be.
Without extensive, personalized data, one-to-one personalization isn’t achievable.
What data to collect to improve your customer experience with personalization?
On a wider scale, it’s important to understand the location of your customer, their demographic information (age, gender, education level), purchasing habits, and website browsing information. However, in the hypercompetitive world of personalization, this surface-level data is not enough.
Brands need to move beyond knowing who the customer is and understand how the customer behaves.
Knowing that your customer is a recent college graduate who lives in New York City and spends a lot of time making Pinterest boards will not be enough information to create a strong buyer persona to achieve a unique and pleasant user experience.
Enhancing your customer’s profile will require you to collect relevant data about how your customer interacts with your brand on all channels, what motivates them to purchase, and what makes them tick on top of knowing who they are.
More specifically, robust personalized data will help you better understand:
- Location and demographics
- Interests and hobbies
- Shopping and purchasing habits
- Device and channel frequency
- Where and how they prefer to shop and purchase
- Satisfaction level
- Likes and dislikes
All of this information will allow you to create a sophisticated customer profile. Understanding their motivations, preferences, and expectations helps you characterize users into intricate market segmentations to give them the best possible experience imaginable.
Ideally, the customer will have a positive experience and feel unique based on the information derived from the robust data collection.
How do you find user data?
Extensive data can be found and refined by cross-indexing information stored on separate databases.
For example, you can harvest personalized data from a customer’s interactions with your business by analyzing and storing comments on social media sites, ratings on review sites, mobile app usage vs. desktop usage, customer service interactions, download requests, and more.
How to leverage one-to-one personalization with personalized data
As you can see, personalization cannot exist without data. To achieve one-to-one personalization on your digital channels, your brand must have the ability to transform the collected data into action.
After monitoring and gathering rich data on your customer’s interactions, history, and behavior on your site, it’s time to convert this personalized data into a refined customer buyer persona to serve your customers better.
By segmenting your profiles, you will be able to better understand your customer’s preferences and pain points, which will help you craft these personalized messages and display them at the right time.
How to personalize interactions with customers:
Once you have substantial personalized data collected about your visitors, you can determine the best way to interact with them. There is a fine line between being helpful by displaying personalized messages and being invasive.
The difference in these two feelings will depend on the amount of prior engagement that the customer has with you. For example, a customer who is subscribed to every newsletter has a company discount card and frequently completes transactions on your website will expect you to know their preferences fairly well, like a regular coming into a coffee shop. On the other hand, a first-time visitor will not expect you to know much about them, but they will expect to be welcomed.
The best way to understand how to serve your customers is by asking yourself how you would want to be interacted with at their level of engagement with your brand. What would make you feel welcomed and what would make you feel overwhelmed or uneasy?
What messages should you personalize?
The possibilities for personalized messages can stretch as far as your mind (or your software capabilities) will allow.
Think about personalization in a broad sense. Let’s say a company wants to put its logo onto personalized gifts for its employees. The company’s logo can be put onto t-shirts, pens, stickers, coffee mugs, phone cases, backpacks, sunglasses, golf balls, holiday baskets– the possibilities are nearly endless. The same goes for personalized messages for your own customers.
In marketing communication, some of the most common outlets for 1:1 personalization are:
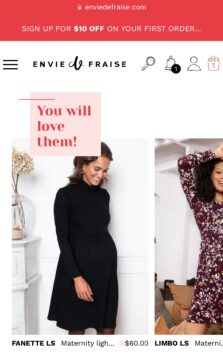
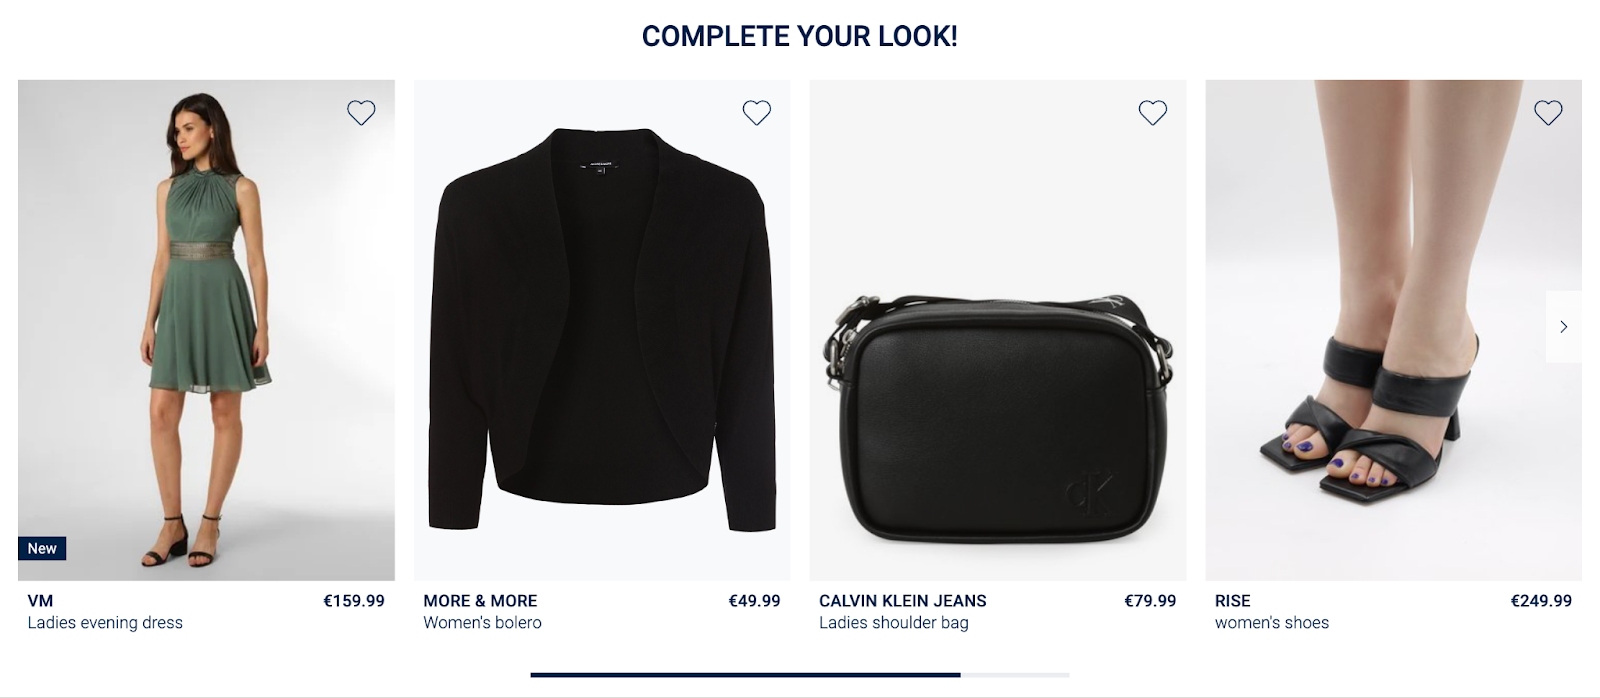
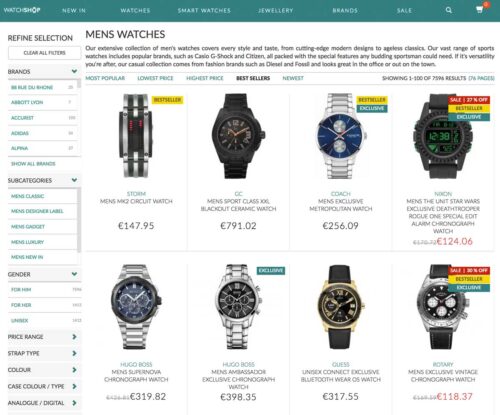
- Product recommendations
- Emails (subject lines and content)
- Intro and exit banners
- Pop-up messages
- Conversational marketing (chat boxes)
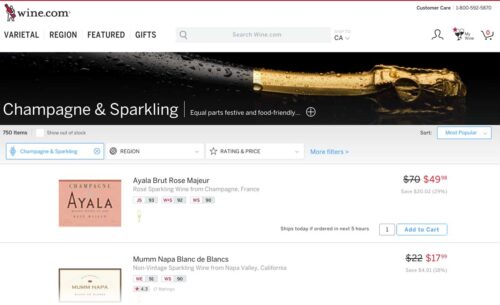
- Offers and discounts
- Language
- Landing pages
- Pricing
- Greetings
To attract and retain your customer’s attention in a market filled with saturated messages, your brand should focus on personalization as much as possible and in as many channels as you can.
What platform to use for one-to-one personalization in marketing?
The journey to a seamless one-to-one personalization, or one-to-one marketing, experience for your customers starts with sophisticated and intuitive software to help transform your ideas into reality.
AB Tasty is the complete platform for experimentation and personalization equipped with the tools you need to create a richer digital experience for your customers — fast. With embedded AI and automation, this platform can help you achieve omnichannel personalization and revolutionize your brand and product experiences.

What is omnichannel personalization?
In marketing, employing one-to-one personalization across multiple channels, platforms, and touchpoints is commonly referred to as omnichannel personalization.
Customers crave personalization wherever they are – on a mobile device, desktop, social media platform, mobile app, or email. When customers receive a personalized experience, they expect this standard of communication across all channels or platforms that they are interacting with.
Achieving omnichannel personalization requires a seamless flow of customer data from one platform or channel to the next. By gathering information on user preferences, behavior, and interests from all virtual touchpoints, your customer’s profile strengthens.
By receiving this consistent level of personalization across all channels, consumers will be inclined to purchase more and to purchase again from the same brand that made them feel seen and heard.
What are the advantages of omnichannel personalization?
- Higher conversion rates
- Increased average order value (AOV)
- Reduced cart abandonment
- Improved brand value and customer loyalty
- Higher customer lifetime value
- Delivering messages at the right time and place
8 Examples of 1-1 Personalization strategies from retail brands
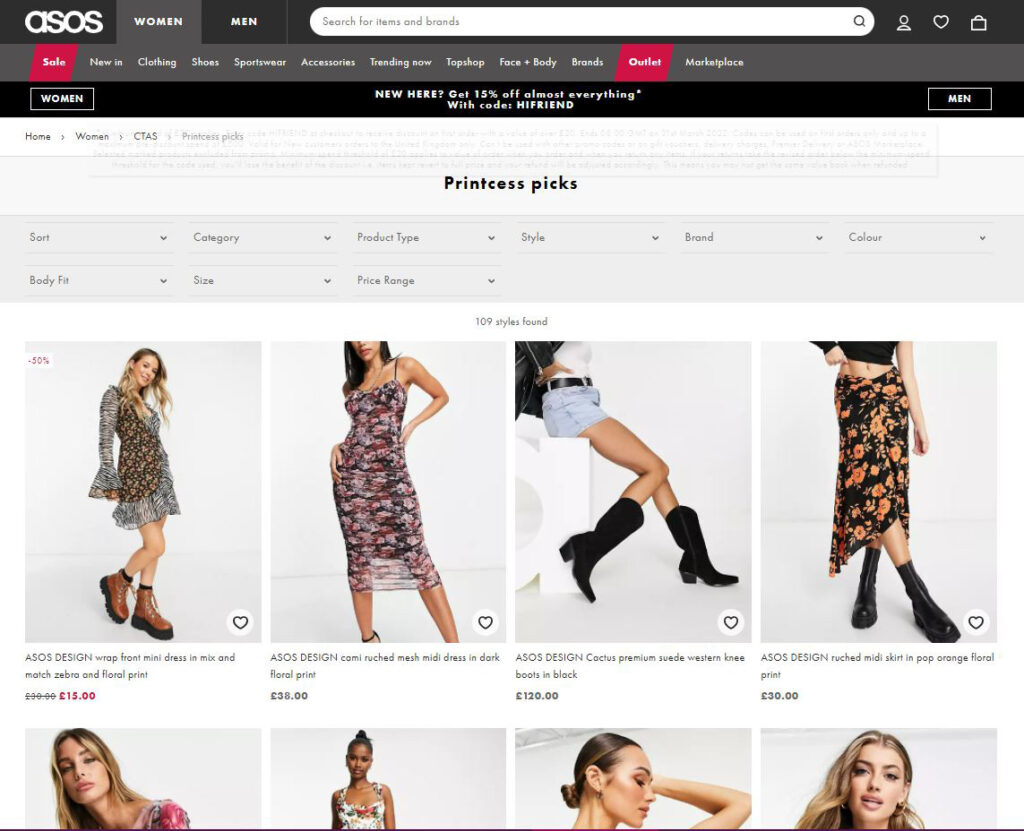
1. ASOS’s Social Connection
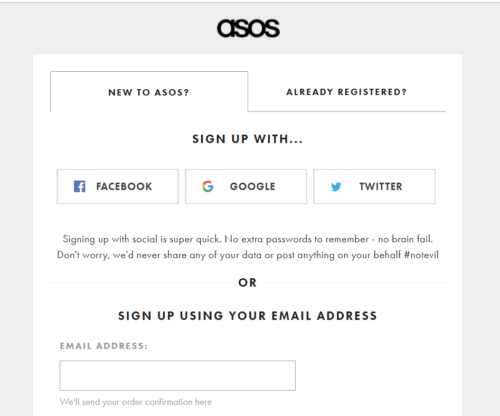
Online retailer ASOS prides itself on offering both new and existing customers a range of personalized discounts and deals, which vary depending on if:
- It’s a new customer
- It’s a returning customer that’s demonstrated a particular interest (e.g. shoes)
- A regular customer (who could then be offered premium next-day delivery, for example)
But how does ASOS get this information? One method they might use is encouraging customers to log in to the site using social media platforms, which would allow ASOS to access further details such as age, gender, and location—which can then be used to tailor even more personalized messages.
Why it works: The ability to use a social platform for account creation makes the process simple for shoppers, while giving ASOS more insight into what deals or promotions would be of the most interest to them.
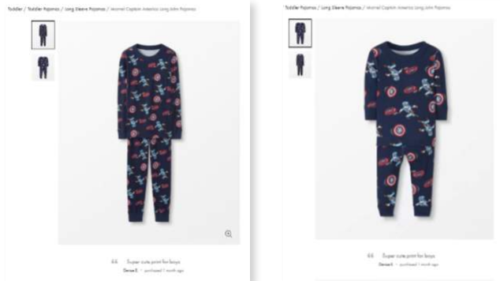
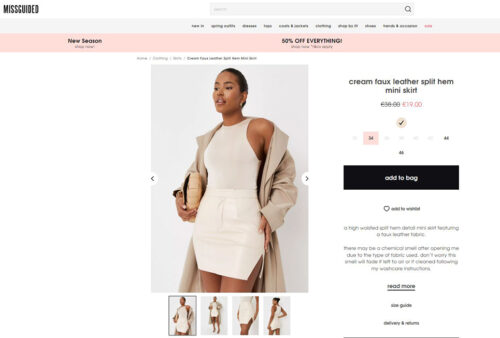
2. Nordstrom Remembers Your Size
Nordstrom gave its online shopping cart a simple yet effective personal touch: remembering returning customers’ clothing sizes. This may not seem like a massive approach to deliver a personal experience, but it creates a more seamless checkout for the user and brings them one step closer to the purchase. It’s a rather clever move from Nordstrom that hasn’t gone unnoticed.
Why it works: Remembering the customers’ preferred size (based on previous purchases) instantly shows the brand’s attentiveness while making checkout even more simple.
3. Clarins personalization and gamification
Before the booming holiday season, Clarins, a multinational cosmetics company, saw an 89% increase in their conversion rate and a 145% increase in the add-to-basket metric by implementing 1:1 personalization and gamification with AB Tasty.
On Single’s Day, a few weeks before Black Friday, Clarins saw a perfect opportunity to experiment and learn culture by implementing a “Wheel of Fortune” concept in certain countries. The gamification gifts were personalized according to each country’s local culture. Any visitor arriving at their website would play the digital game, spin the wheel, and receive a gift automatically in their inbox. This ease of automatic implementation was a great user experience, especially for mobile visitors.
Read the full story here: How Clarins Uses AB Tasty for Personalization and Retention
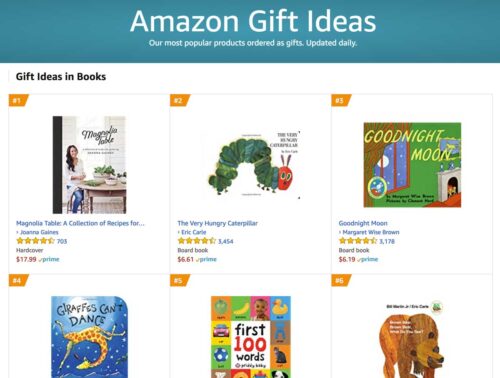
4. Amazon’s ‘Recommended For You’ Approach
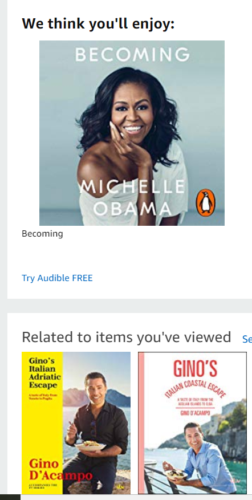
Amazon is no stranger to personalization marketing. In fact, it could be argued they were the first major e-commerce retailer to really put personalization into action. The company has become known for its product recommendation emails and personalized homepages for logged-in customers. Using their own algorithm, A9, Amazon goes above and beyond to first understand customers’ buying habits and then deliver an experience that’s been deliberately designed for relevance.
Why it works: Customers feel valued and understood by the retailer when seeing emails and recommended “picks” that are tailored to their interests. Consistency also plays a part in Amazon’s approach, as they continue to deliver an even more granular personalized approach for customers.
5. Nike and Their Customized Approach
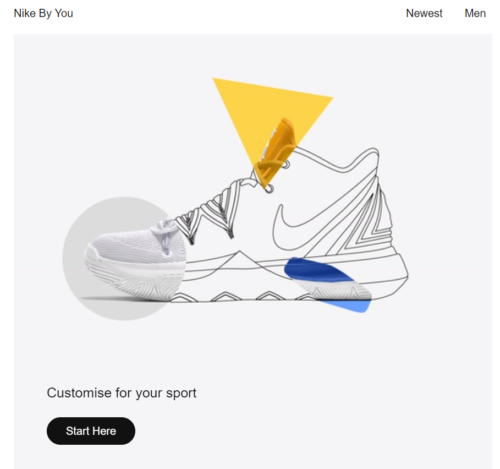
Nike always goes the extra mile to personalize the shopping experience, as we’ve seen with their SNKRs app that allows premium (loyalty, Nike+ shoppers) access to a large catalog of products that they can then customize. It’s the perfect way to cement customer loyalty by offering them the unique opportunity to tailor items to their exact liking.
Why it works: By giving customers a certain degree of autonomy with design, Nike is giving customers the freedom to express their individuality, even while the company continues to produce the same style of shoe around the world. Despite being a huge brand, Nike has created a great loyalty program that engages customers and stokes their excitement about buying Nike products.
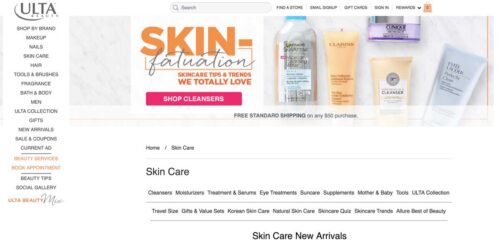
6. Net-A-Porter’s Personalized Touch
Luxury online retailer Net-A-Porter has adopted the ‘recommended for you’ approach but with a unique twist to appeal to its high-end customers who want a more premium service when they shop. The company gives away freebie products to customers based on previous purchases, adding a personal touch to an otherwise standard online shopping experience. This is not unlike Amazon’s recommended emails, except Net-A-Porter customers receive a physical product — and who doesn’t like a gift!
Why it works: These gifts show the appreciation Net-A-Porter has for its customers and help to bring the luxury shopping experience online.
7. Coca-Cola’s Name Campaign
In 2011, Coca-Cola launched its Share a Coke campaign in Australia, printing thousands of names on their diet and original soft drinks. This simple yet effective campaign made sales skyrocket, supporting the notion that consumers engage with brands that address them by their first name (albeit in a rather broad sense!) Personalized bottles became all the rage, with people trying to find their own names along with those of their friends and family members. The campaign was globally recognized and started the ball rolling for other brands such as Marmite, which also saw great success with a naming campaign.
Why it works: Is it the simple notion of vanity that makes these name campaigns so popular? Consumers love to see their own names on popular products, making them almost ‘gimmicky’ with a collectible edge that makes people feel special!
8. Target’s Guest ID
The US retail giant Target decided to up its personalized campaign game by assigning each customer a guest identification number on their first interaction with the brand. Target then used the data to obtain customer details like buying behavior and even job history! Target used personalized data to understand the consumer habits of its customers and to create a view of their individual lifestyles. Target focused particularly on customers who also had a baby registry with them and even used their marketing data to make ‘pregnancy predictability scores’ for customers who were browsing particular items!
Why it works: Arguably, delivering a personalized experience for every customer visiting a physical store is a tough job for any retailer. By assigning a ‘guest ID’, Target was able to understand buying behaviors and patterns from their customers in-store and use the information to make suggestions on products they may be interested in.
Everyone wins with one-to-one personalization
The data you collect equally benefits your brand and your customers. By understanding what your customers are looking for, you save them time by providing them with informed recommendations, personalized messages, and unique experiences to solve their pain points.
Without proper data collection or genuine segmentation, it’s nearly impossible to provide users with a 1:1 personalized experience. Loyal customers want to feel like their brand really knows them and what they’re looking for. Achieve one-to-one personalized experiences by correctly analyzing and leveraging personalized data. If you’re looking to serve your customers, increase sales, and build brand loyalty at the same time, you’ve found your blueprint with personalization.


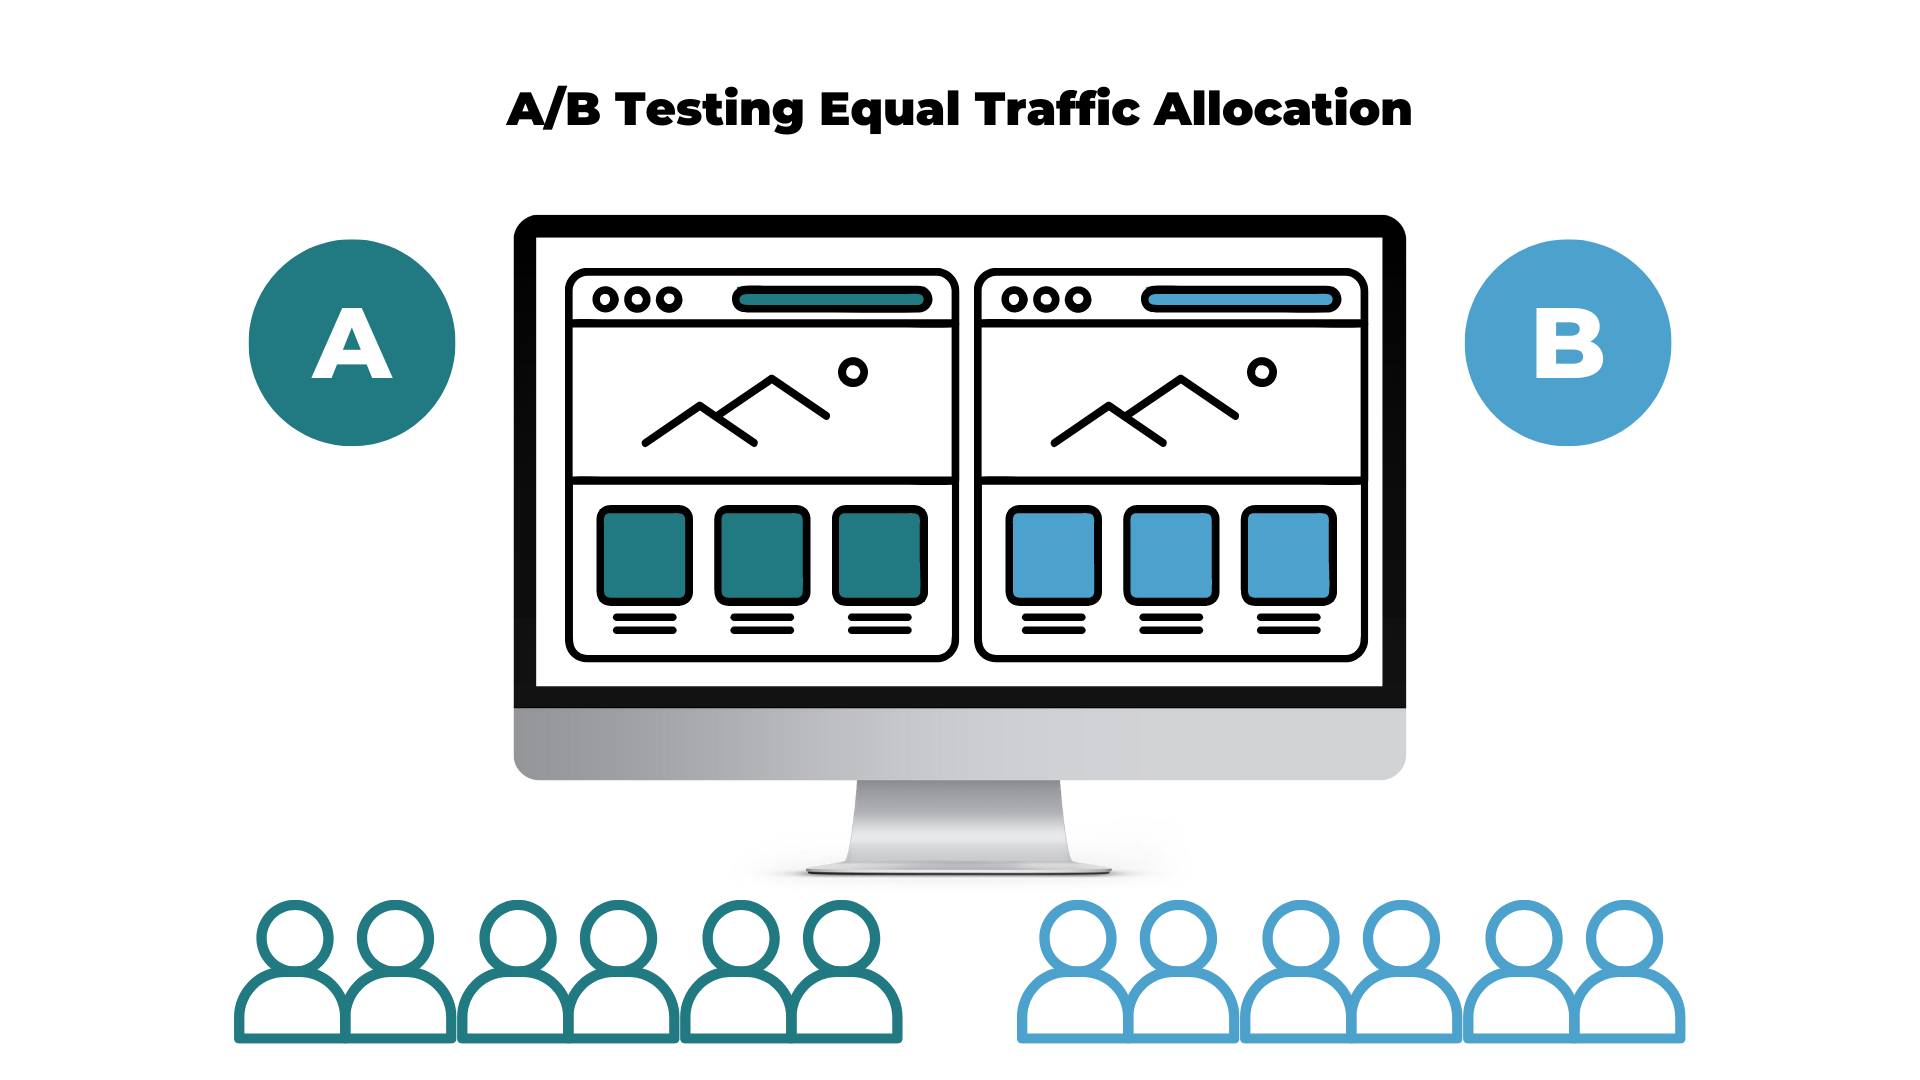
 Variation:
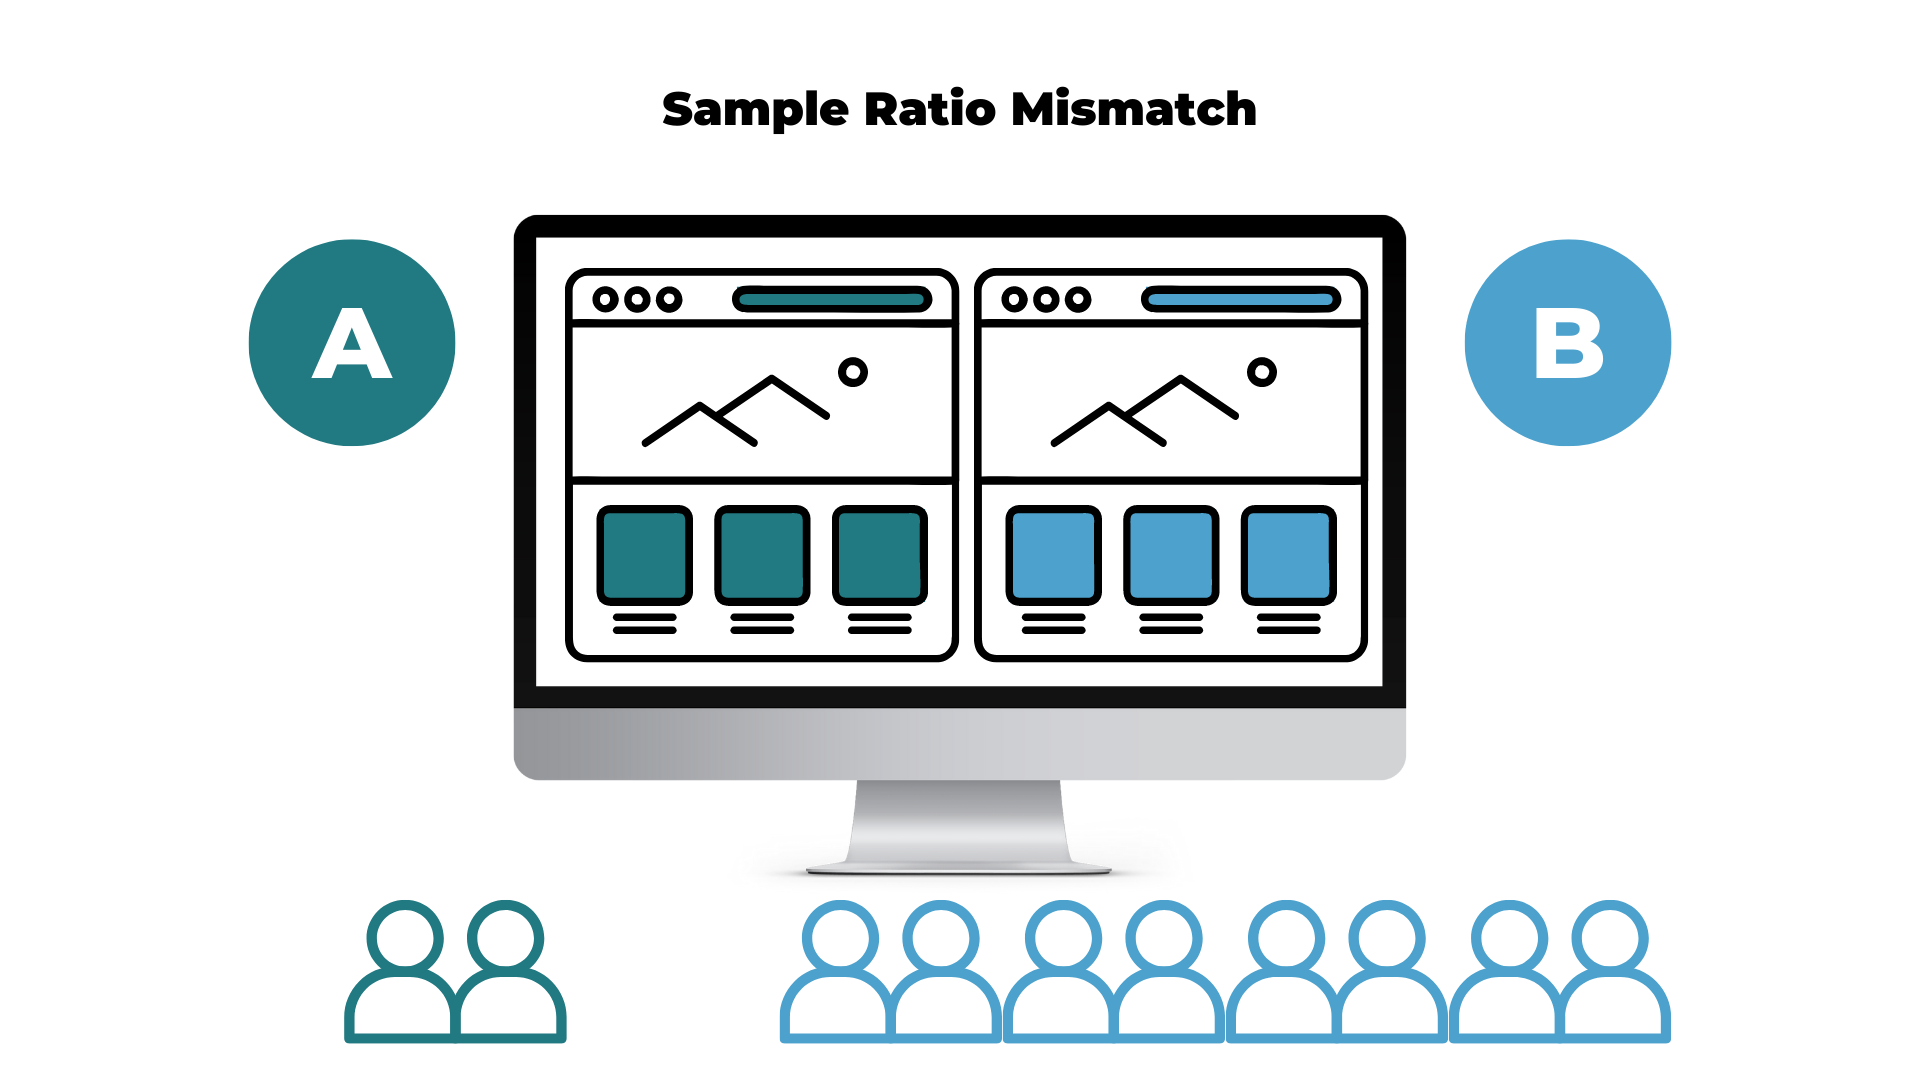