With digital channels now the default for travel planning, the game has changed. Passenger revenues are hitting record highs, but intense competition means thinning margins on ticket sales. To counter this, airlines are tapping into the $144 billion ancillary revenue market, with 73% now investing in AI-driven personalization and pricing tools according to the Boston Consulting Group. The shift is clear: your digital storefront is the critical battleground.
This isn’t just about a prettier booking form. It’s a strategic shift happening right now. The real question is, are you ready for it?
From timetable to travel partner
An airline’s website used to be a simple payment portal. Today, that model is obsolete. The modern airline site is a continuous commerce engine and a personalized travel concierge. The industry is moving toward a retail-like experience where every interaction is an opportunity to add value and drive revenue.
This transformation is driven by what we’ve all come to expect from the best e-commerce sites: seamless and relevant experiences. Research from the Baymard Institute shows significant gaps remain in user-friendly booking.
With 72% of all travel reservations now made online, the winners will be those who close these gaps, creating a journey that feels less like a form and more like a conversation.
The friction that grounds your conversions
Even the biggest carriers fall victim to common UX issues that create friction. The result? CellPoint Digital reports an industry cart abandonment rate of nearly 90%. That means nine out of ten booking processes are never completed. These are the problems we see time and again:
- Opaque fare comparisons & surprise fees: The single biggest driver of abandonment is unexpected costs. A 2025 study found that 39% of users leave a purchase because extra fees are too high. Hiding what’s included in different fares forces users to hunt for information, breaking the booking flow.
- A slow and complex funnel:Baymard Institute has found that a complicated checkout process is responsible for 18% of all abandonments. Every second a page takes to load, especially on mobile, is a chance for a user to navigate away. A one-second delay can reduce conversions by 7%, according to SITE123.
- Clunky ancillary flows: Poorly designed interfaces for adding bags, meals, or upgrades can make the process frustrating, leading to users skip it entirely.
- Widespread accessibility failures: A critical and pervasive failure is in digital accessibility. A 2024 study found a shocking 76% of airline websites are not accessible enough for users with disabilities, effectively excluding a market segment that includes 16% of the world’s population.
- Deceptive urgency: As detailed by Web Designer Depot, dark patterns like high-pressure countdown timers or misleading “only 2 seats left” banners can erode trust.

Your pre-flight checklist for a better UX
Before you can find your better, you need to know where you stand.
The interactive flip cards below (move cursor over card to flip) will reveal a checklist to audit your site and pinpoint key areas for improvement.
Performance
How quickly does your flight search load? According to SITE123, 40% of users will abandon a site that takes more than three seconds.
Search & availability UX
Is it easy to filter results and compare dates? Are you putting the most relevant information front and centre? Working with Iberojet, we made simple search box adjustments that increased clicks by 25%.
Fare clarity
Are all fees and inclusions presented upfront to avoid the 39% of drop-offs that the Baymard Institute attributes to surprise costs?
Ancillary merchandising
Are add-ons presented clearly, or do customers need to click around to understand what you’re offering?
Personalization signals
Are you recognizing logged-in users or remembering their recent searches?
Mobile experience
Does your site work seamlessly on a small screen? Data from hotelagio.com reveals over 45% of all online travel bookings in Q1 2025 were on a mobile device.
Accessibility
Does your site meet the benchmark of a Google Lighthouse score of 90 or above? According to MarketingTech, only a third of airlines currently do.
Trust signals
Are security logos, clear policies, and recognizable payment options visible? These elements are crucial for building the user confidence needed to complete a high-stakes transaction involving sensitive personal and financial data.
Checkout abandonment triggers
Where are users dropping off? Research from the Baymard Institute indicates that mandatory account creation alone causes 19% of users to abandon their purchase.
Better, faster: your first 30 days
You don’t need a complete overhaul to see meaningful results. Start with these high-impact changes you can implement quickly.
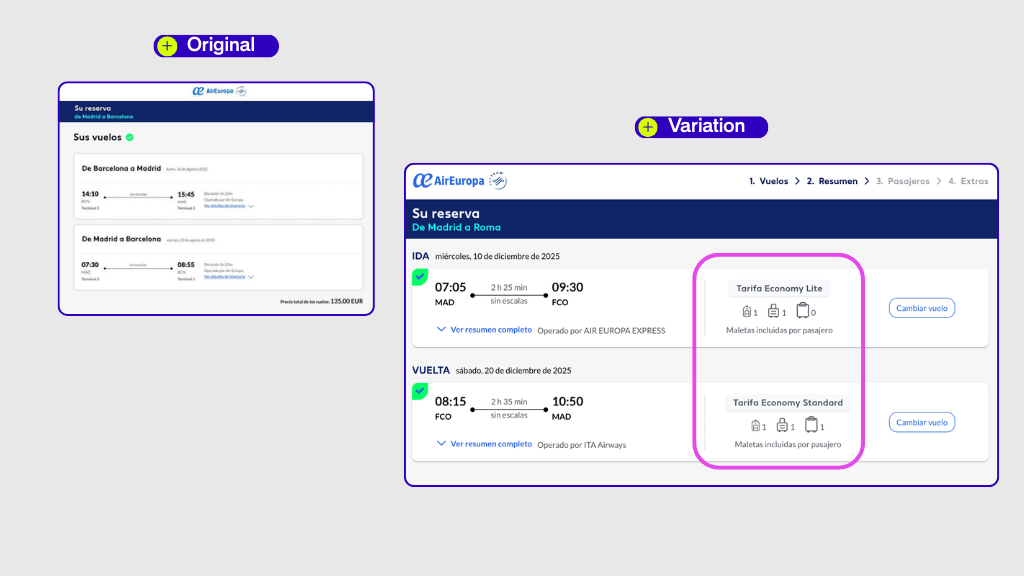
- Simplify the fare breakdown: Use a clear, visual grid to show the differences between fare types to combat the trust erosion from hidden fees.
- Show price guarantees: Add a simple message like “Find a lower price within 24 hours? We’ll refund the difference.” Let customers know that they are getting the best deal by booking with you.
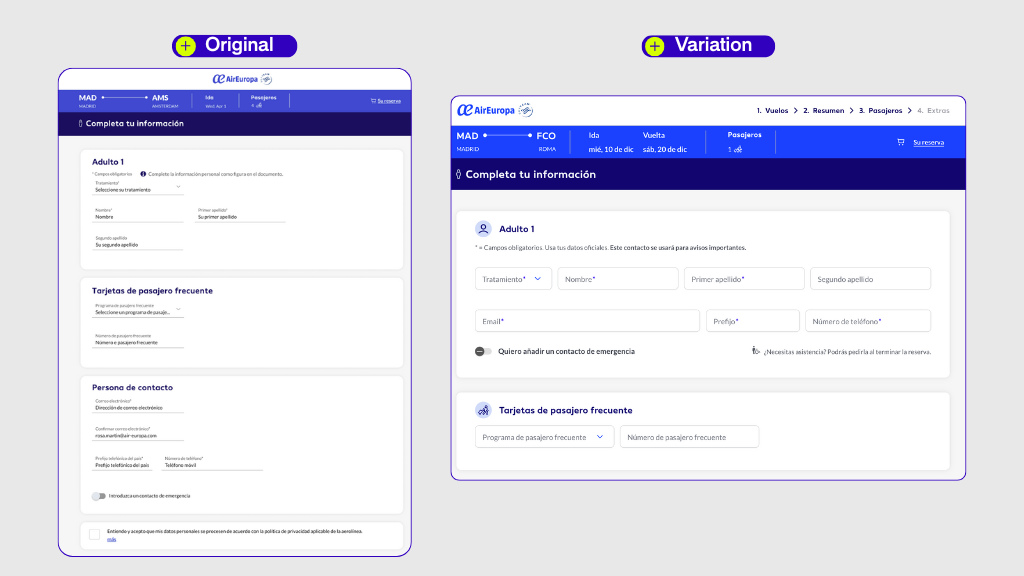
- Reduce form fields: Do you really need every piece of information, like passport details, at the initial booking stage? It’s much more practical to capture only the essential details needed to secure the purchase. Less critical information can be collected post-booking through a “Manage My Booking” portal, reducing initial friction and getting more customers across the finish line.
- Add a progress indicator: Show users exactly where they are in the booking process (e.g., “Step 2 of 4”) to reduce the friction and help set customer expectations.
- Highlight the most popular ancillaries: Pre-select the most commonly chosen baggage option to simplify choice, making the process feel easier and faster.
- Optimize mobile search: Use a larger, thumb-friendly calendar and single-column layout for mobile search forms, targeting the 45% of bookings coming from mobile.
Trial and better: A 60–90 day roadmap
With quick wins in place, it’s time to build a culture of continuous improvement. Here are concrete A/B test ideas to get you started.
Test dynamic ancillary placement with personalization
Hypothesis: Offering ancillaries at different points in the funnel based on user behavior will increase take-rate.
We can test this by using our personalization engine to segment users. For “decisive” users who quickly select a flight, we’ll offer a bundled “Trip Pack” immediately, while “browsing” users who spend time comparing will see ancillary offers on the seat selection page. We will use funnel tracking to measure the impact on the primary metric of ancillary revenue per booking, as well as progression through the checkout flow.
Test personalized destination banners
Hypothesis: Personalizing the homepage banner based on a user’s origin or past searches will increase engagement.
As a variant, instead of a generic banner, we can use our audience builder to target users from Chicago with a “Weekend Getaways from ORD” banner, responding to findings from Skyscanner that 66% of travelers want personalized offers. The primary metric for this test would be the click-through rate on the homepage banner.
Test guest checkout flow with feature flags
Hypothesis: Offering a prominent “Continue as Guest” option will significantly reduce abandonment caused by the friction of mandatory account creation.
We can use a feature flag to safely roll out a redesigned login page where “Continue as Guest” is the primary call-to-action for a small segment of traffic before running a full A/B test. Funnel tracking can then be used to precisely measure the impact on the primary metric of checkout completion rate.

The right way to say, “we remember you”
True personalization is about being helpful, not intrusive. The goal is to use data to remove friction and add value. The incentive is powerful. Companies that excel at personalization generate 40% more revenue on average, which makes sense when71% of consumers now expect it.
However, consumers are also wary of how companies handle their data. The key is a transparent value exchange. Use what you know to be helpful. If a logged-in user frequently flies to San Francisco, show them SFO fares. If a user is searching from mobile on a Tuesday morning, they might be a business traveler who would appreciate fares with Wi-Fi. It’s about recognizing intent and responding with relevance.
Don’t trade trust for a transaction
In the rush to optimize, it’s tempting to use “dark patterns” that manipulate users. But tactics like hidden opt-outs or false urgency burn trust. A 2022 European Commission report found 97% of popular apps use at least one deceptive design element.
The better path is transparency. Aggressive dark patterns can lead to unintended purchases and post-purchase regret, eroding the loyalty you need. With the FTC in the USA now banning“drip pricing” fees, the tide is turning toward honesty.
For example, instead of a pre-checked insurance box, try a version where the user has to actively select “Yes” or “No.” You might find that a clear, well-explained offer converts just as well without the negative feelings.
Embrace positive change to transform your digital presence. By auditing your site, securing quick wins, and developing an experimentation roadmap, you can create an experience that converts casual browsers into dedicated customers.