If you’d like, you can review our introduction to the Customer-Centric Data Series here or read the previous installment, Creating Emotional Connections with Customers Using Data.
For the fourth installment in our series on a data-driven approach to customer-centric marketing, we got together with Filip von Reiche, CTO of Integrated Customer Experiences at Wunderman Thompson, and Gaetan Philippot, Data Scientist at AB Tasty. We discussed the pros and cons of vanity metrics, how they’re different from actionable metrics, and the roles all types of metrics play when measuring a brand’s digital impact.
Let’s begin with digital transformation. What is it, and why have companies been so focused on it over the past few years?
Digital transformation, as defined by Salesforce, is the process of using digital technologies to create new – or modify existing – business processes, culture, and customer experiences to meet changing business and market requirements. It began in the late 20th century and underwent rapid acceleration in the first two decades of the 21st century, spreading across almost all industries.
Resisting digital transformation is risky. TechTarget tells the fateful story of Blockbuster LLC, a once-global entity with video rental stores throughout the US and the world. But its presence and relevance precipitously declined from about 2005, as Netflix harnessed emerging technologies and capitalized on consumer appetite for on-demand entertainment delivered by the then newly-available streaming services.
But digital transformation can also be seen as a buzzword, says Filip, “in the sense that people think it’s something they need to do. The original impetus behind digital transformation was that brands were trying to be more competitive – in how they grew their market share, how they were perceived, and so on. And digital transformation was the engine that enabled them to achieve these things, to react faster, and to be able to measure their impact.
“Initially, it was focused on giving brands an online presence, and of course, it has achieved that, but over time, it has acquired new uses. Its latest purpose is to help brands create personalized experiences by providing them with the right content and flow which allows them to have better conversations with their customers, and that leads to more conversions.”
For Gaetan, “Part of it is imitative: people say ‘Amazon is doing a thousand experiments a year, so we have to do the same,’ but not everyone has the vast resources of Amazon, or can hope for the same results.”
But if the objective is to have personalized brand experiences, Amazon isn’t a website where people want to spend much time. “On the contrary, people go to Amazon because they can get in, buy what they want, and get out fast. It’s totally impersonal,” explains Filip. “However, the reason I spend more time with a brand is because I want a specific product or service they offer, and I expect personalization from brands I’m engaged with.”
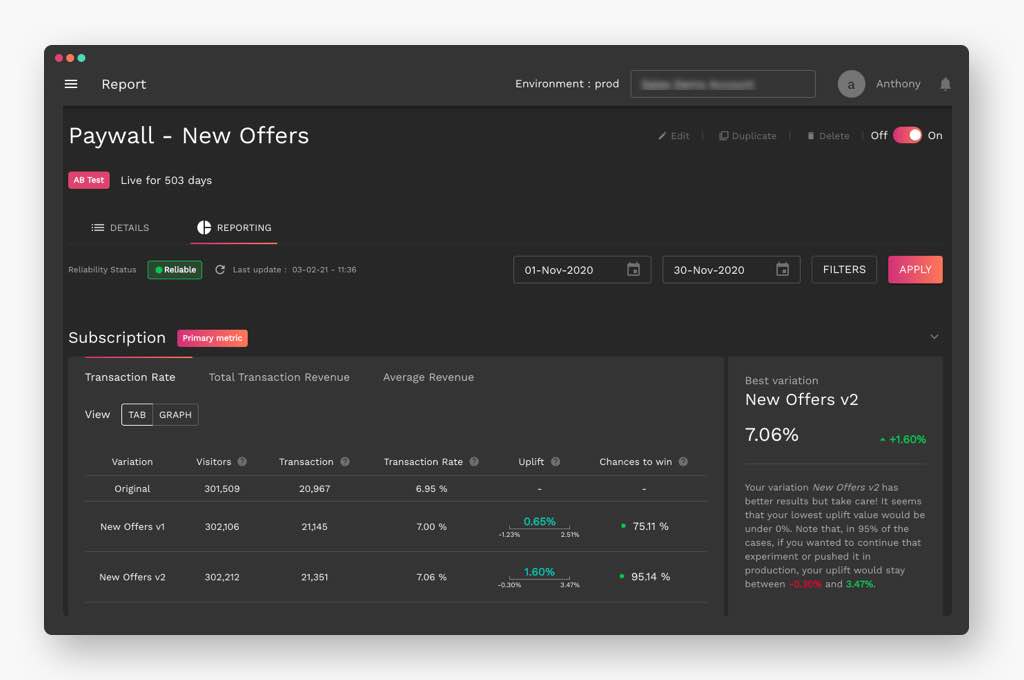
For personalization to be successful, there must be constant validation of your perceptions before going live with any website or campaign.“More than half of all campaigns that customers perform using AB Tasty have to do with personalization or experimenting with personalization,” remarks Gaetan.“They’re the foundation on which everything else is built.”
What are the differences between vanity metrics and actionable metrics?
The use of vanity metrics varies across different verticals at different levels and from client to client. The one constant is that vanity metrics are very alluring because they provide what Filip calls “A dopamine rush that lights up your brain – and in some cases, depending on what you’re trying to achieve with your personalization, that ‘rush’ might be sufficient. But ideally, you want to know what the long-range impact will be.”
The problem is that the impact is not always easily attainable. “Let’s take real estate as an example. It’s unfortunately not as simple as the target sees a personalized message, the target clicks, the target purchases a house. Wouldn’t that be great? But in reality, the lapse of time between that initial personalization and the purchase might be 30, 60, 90 days, or even longer. In some cases, you do need a vanity metric such as page likes, favorites, shares, etc., as an indicator to tell you where things are going, but it’s always better to have a conversion metric in the background to tell you what it all really means,” explains Filip.
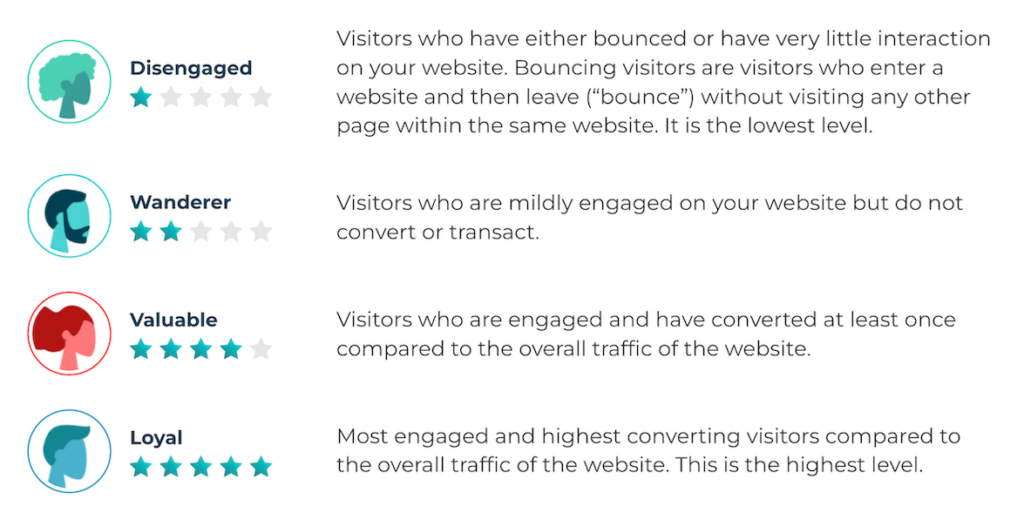
“This is where more in-depth analytics come into play. If you have a customer who is engaged but not converting, you need to find out what the barrier is and find a way to get around it. If you can propose a solution using personalization that meets the consumer’s needs and knocks down that barrier, great. But you always have to respect the trust the consumer has placed in you by giving you the data you need for personalization. You can’t just pop out and say “Hi! We see you’re looking at our website! That’s creepy. But you can indicate that you, as a brand, are present and listening to your consumers’ needs. It’s a delicate balance.”
Can vanity metrics be transformed into actionable metrics?
It should be emphasized that the use of a “superficial” or vanity metric is always justified when there is a notable response, whether positive or negative, because it may prompt a company to want to dig deeper and analyze further; to do so, they turn to actionable metrics for answers.
Gaetan remarks, “But it’s important to remember that not everything is actionable immediately: sometimes the payoff will be further along. The value of each type of metric varies according to industry and also according to client maturity. For example, e-commerce clients that are just starting out will test all sorts of things before they learn which key metrics are the most useful and offer the best results for their businesses.”
“The entire metric discussion needs to begin as soon as you devise your personalization or testing strategy,” says Filip. “You’ll have a goal in mind: to achieve a certain type of awareness or engagement or a certain number of conversions, etc. Everything you test that you want to use as a measure of success must align with that goal. If a vanity metric can support that goal, then it’s sufficient. If the final conversion is needed to prove my point, then we need to figure out how to get it. Sometimes that can be more complicated and involve offline integrations, but that’s usually how it works.”
What questions should companies ask to find the right metrics to track?
For Filip, a vital question concerns the scope of the project you’re undertaking. Are you measuring an entire campaign or are you breaking it down into individual parts? A high-level scope is easier to measure, meaning fewer metrics are needed, generally speaking. A detailed scope is more complex, as measuring on an individual basis raises questions of how to determine identity, how to relate conversions back to specific individuals, etc., especially when using data from a Customer Data Platform (CDP).
But the most fundamental question is: ‘Should I be testing and personalizing my experiences?’ And Filip’s answer is “Hell yes! But there are lots of different paths to take to do these things. One way is to ask a company like Wunderman Thompson to help you in doing analysis, acting as a consultant to show you what’s working and what isn’t, where there are blockages, places for improvement, etc. (Sorry for the sales pitch).
“But if you’d rather appeal to consumers on your own, from a consumer experience point of view, you need to test to discover what the best way is to have a conversation with them. How can you show them you want to help them without being intrusive? It may help companies to think of this in terms of a retail store experience by asking themselves, ‘How do I, as a customer, want to be welcomed, assisted, guided?’ Understanding this is the best way to start their personalization framework.”
How is Customer Lifetime Value measured?
Customer lifetime value (CLTV) is the profit margin a company expects to earn over the entirety of its business relationship with the average customer. A CleverTap article explains further: “Because CLTV is a financial projection, it requires a business to make informed assumptions. For example, in order to calculate CLTV, a business must estimate the value of the average sale, average number of transactions, and the duration of the business relationship with a given customer. Established businesses with historical customer data can more accurately calculate their customer lifetime value.” A bit blunt, but that’s how it works.
A visual example of calculating customer lifetime value using sale, transactions, and retention metrics – all of which can be impacted by experimentation.

Source: CleverTap
Now, where to find this precious historical customer data?
“CDPs play an essential role in measuring CLTV because they can combine data from dozens of sources to retrace a customer’s entire history of interactions with a brand, from their web and mobile experiences to their in-store and support experiences. And with this data, you can measure how long you’ve been engaging with that customer, what the value of that engagement has been, what things you offer that they’re interested in,” says Filip.
“Obviously, if a consumer has been engaging with a particular brand for a very long time, they’re going to expect a certain level of personalization from you. They’re going to expect the warm embrace and friendly conversation you have with someone you’ve known for years, not just the quick hello and small talk you’d offer to someone you just met. And it’s worth offering this level of personalization because the better you know your customers, the longer you can continue your conversation with them, which results in loyalty and retention and hopefully, referrals.”
There are techniques to maximize CLTV, including segmenting, personalization, increasing marketing channels, cross-selling, and up-selling, to mention but a few.
In today’s economy, where the markets are crowded with competitors vying for the same customers, engagement and conversion are crucial to the success of any business.
Watch for the fifth installment in our Customer-Centric Data Series in two weeks!


 Knowing one dimension makes it possible to calculate the other. If you have an element with 1000px width, your height would be 750px. This calculation is made as follows:


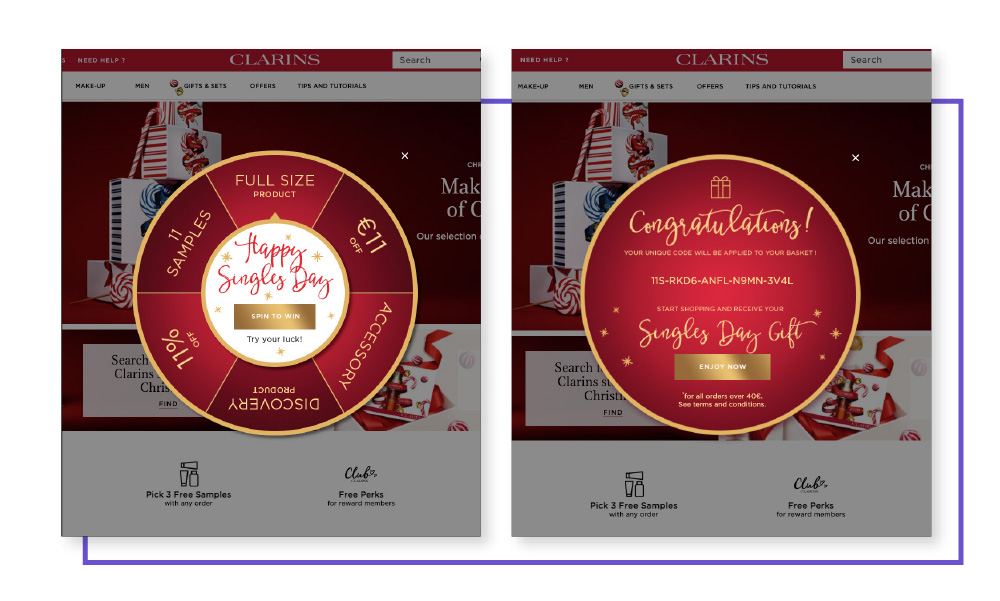 Clarins delivered a customer experience on par with their clients’ expectations (