In the digital age, companies can no longer only focus their efforts on optimizing for desktop especially as more and more consumers are using their mobile devices to visit websites and make purchases through apps.
However with millions of apps out there, competition and consumer demands and expectations are at an all-time high. This means your app needs to stand out in an overcrowded market.
It’s important to point out that deploying mobile apps doesn’t follow the same process as a website app.
In this article, we will investigate the challenges of mobile app deployment and release and how feature flags are the key to help you deliver optimized mobile apps that meet your consumers’ needs.
The challenges of mobile app deployment
Mobile development teams are particularly susceptible to bugs and long, tedious release cycles.
In short, there are two main problems when it comes releasing or updating features on mobile apps:
- You have to wait until approval from app stores (which could take some time and significantly delay a release).
- Afterwards, you have to wait for users to manually download the update from the store (which could also take a lot of time).
For example, let’s take a look at this scenario: you’re working on an update to your mobile app. You finally release it only to find out that there’s a bug you missed that’s causing your app to crash.
By the time you release a new update with a fix to the issue, wait for the release to the app store and watch for users to download the update, you might risk losing a significant number of users.
Mobile developers and engineers are all too familiar with such a scenario.
Therefore, it can be a painstakingly long process to get a release approved. Once approved, any buggy release will need to be fixed and put through the app store approval process all over again, leading to further delays.
Although the review time has improved in recent years, if your app fails to meet the app store review guidelines it may be further delayed. This means that you cannot push real-time updates to production as you would with web apps.
Put simply, the process of deploying mobile apps is not as straightforward as it might be for web apps.
Unlike web apps which are automatically updated once visitors access the site, users have to download an update of the mobile app in their store to get the latest version. As updates pile up after going through the review process, you have no control over whether users download the latest versions.
Therefore, it can take more time to deploy mobile app updates compared to web apps. And in an age where customers demand the best every time, it’s not feasible to have them wait that long for an update, especially when there’s a bug involved, much less having to wait to deploy a new app version once the bug is removed.
In modern software development, when continuous delivery is vital to retain competitiveness and meet fast-changing consumer demands, teams must turn to another solution to achieve a more frequent release cadence.
The value of feature flags in mobile app deployment and release
This is where feature flags come into play.
Unlike client-side testing where experiments are focused on web browsers, feature flags give teams the ability to carry out server-side experiments across multiple channels including mobile apps.
Feature flags allow teams to enable or disable features to users of their choosing to minimize risk and negative impact.
This is because feature flags allow you to decouple deployment from feature releases meaning you can turn functionality on or off remotely without redeploying code to app stores and waiting for its approval or having to wait for all changes to be ready at the same time to release your own changes. This way you can deploy code to whoever whenever you want.
Read more: What is remote configuration in app development?
Thus, you can upgrade your app continuously in real time based on feedback from your users without sending an app store update or waiting on its approval. You can also gradually release new features without users having to go through the hassle of always having to update their app version.
With feature flags, mobile developers can safely test in production on a pre-defined audience and disable any features with a kill switch should any issues come up, thereby reducing any negative impact. Developers can then work on pinpointing the issue and fixing it before releasing the feature to all users.
How can you use feature flags in mobile apps?
Feature flags can be used not only by developers but also by product and release managers to optimize mobile experiences in various ways.
Here are some examples of use cases for mobile feature flags:
- A/B testing: With feature flags, you can divide your users into subsets with each set of users receiving a different variation of the feature. This allows you to test and determine which is the top-performing variation to roll out to all your users. Put simply, running A/B tests allow you to collect valuable live feedback from your users so you can make informed decisions about how to optimize your features and products.
- Targeted rollouts: Teams can use feature flags to test out their ideas by progressively rolling out their feature, giving only a limited number of users ]early access to the app through beta testing for example. This helps generate buzz around your release and lets you monitor its impact on these select users. Targeted rollouts allow teams to make more informed decisions about what to optimize and fine-tune an app based on live user feedback.
- Personalization: Feature flags are a great way to personalize experiences for different types of users rather than delivering a unified experience for all your users. By changing the features that certain users receive, you can tailor the user experience in mobile apps to individual users or user segments. For example, you can offer a unique experience based on the country the user is in.
- Roll back/kill switch: What’s really unique about feature flags is that they enable teams to roll back any buggy updates quickly. By simply disabling the relevant feature flag, you can solve a bug without going through the lengthy app store review process.
Mobile feature flags: Use cases
We’ve talked mainly about how feature flags can be used in mobile app deployment but they’re also a great way to reduce risk when deploying and testing on mobile sites, especially when it comes to deep level modifications tied to back-end architecture such as testing new payment methods.
This can be easily done using a feature flagging platform, where teams can safely deploy frequent releases with an easy-to-use platform that can be used by all teams.
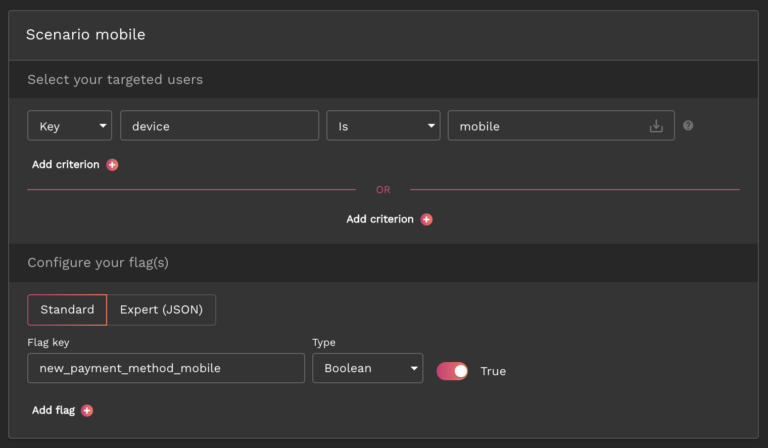
For example, let’s say you developed two payment features: one for desktop and one for mobile. Before doing a full release, you’re looking to test them on a small group of early adopters to monitor its impact and determine its usage rate.
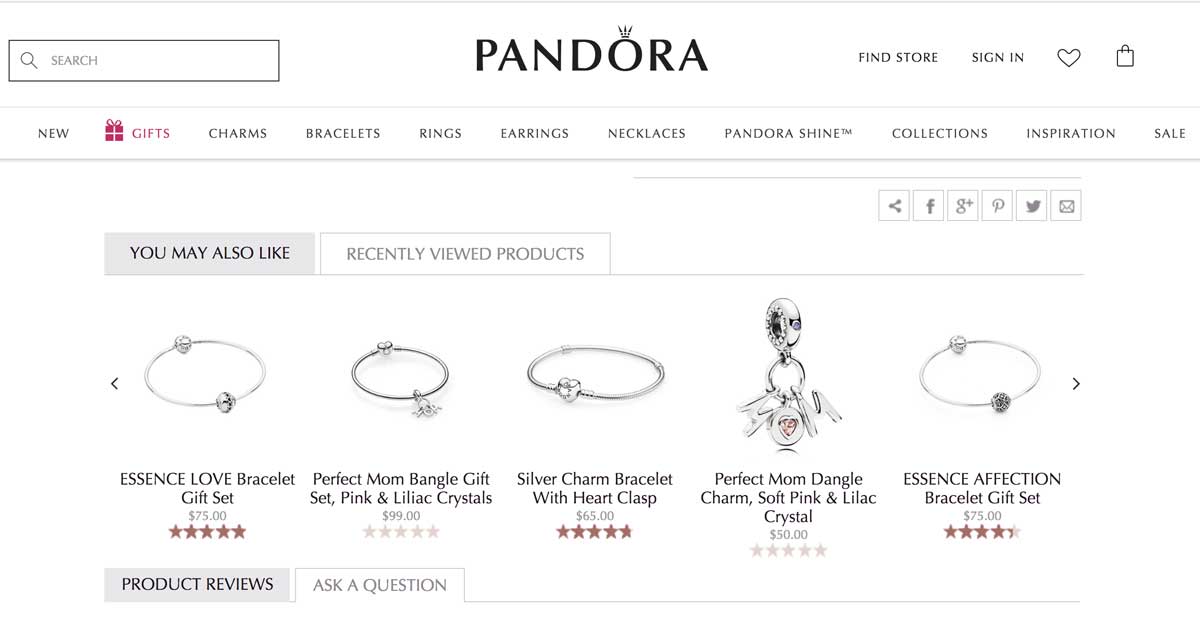
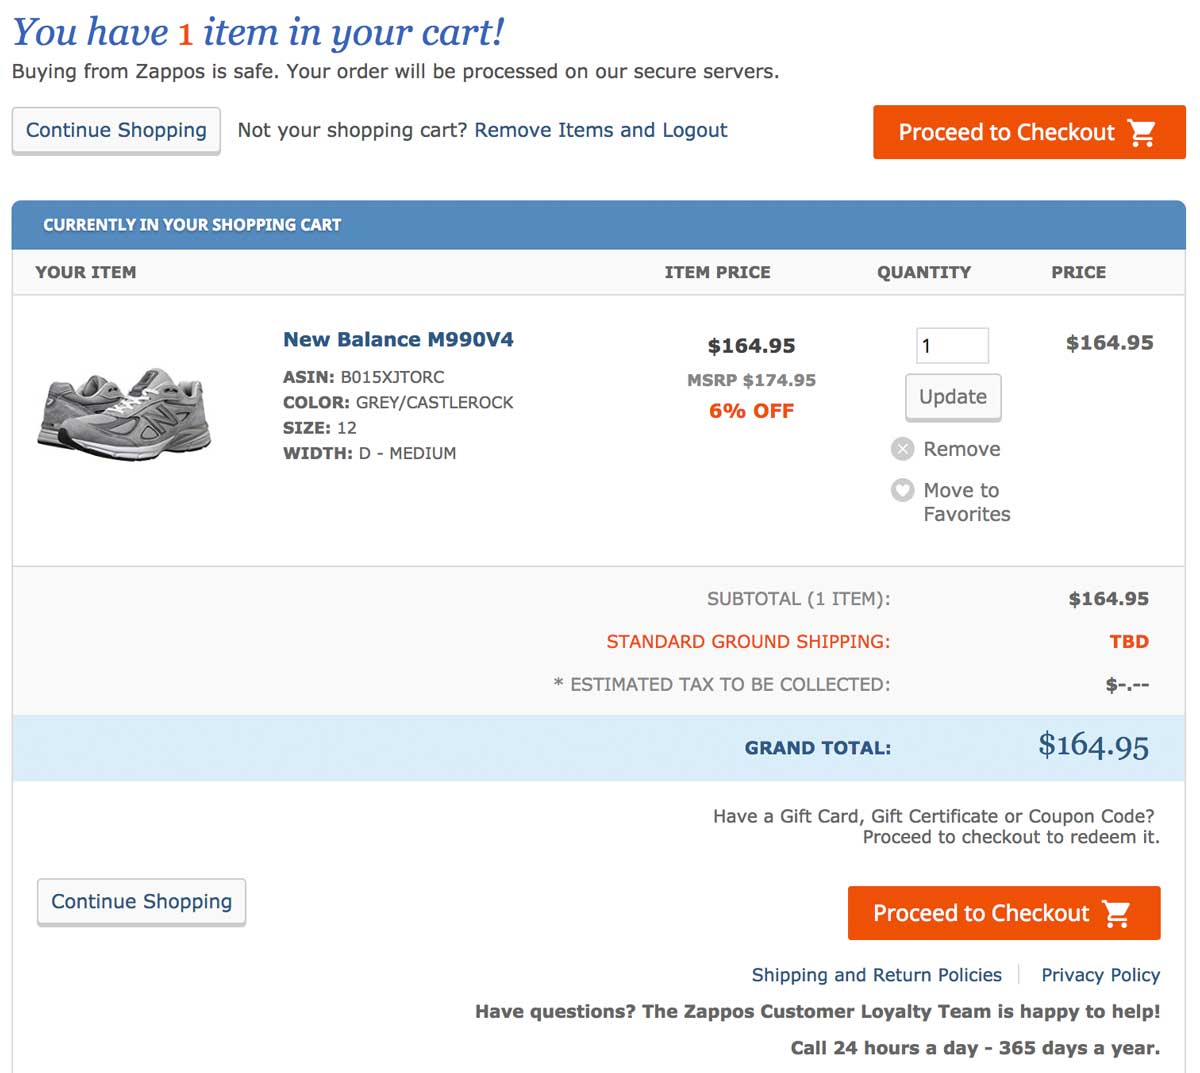
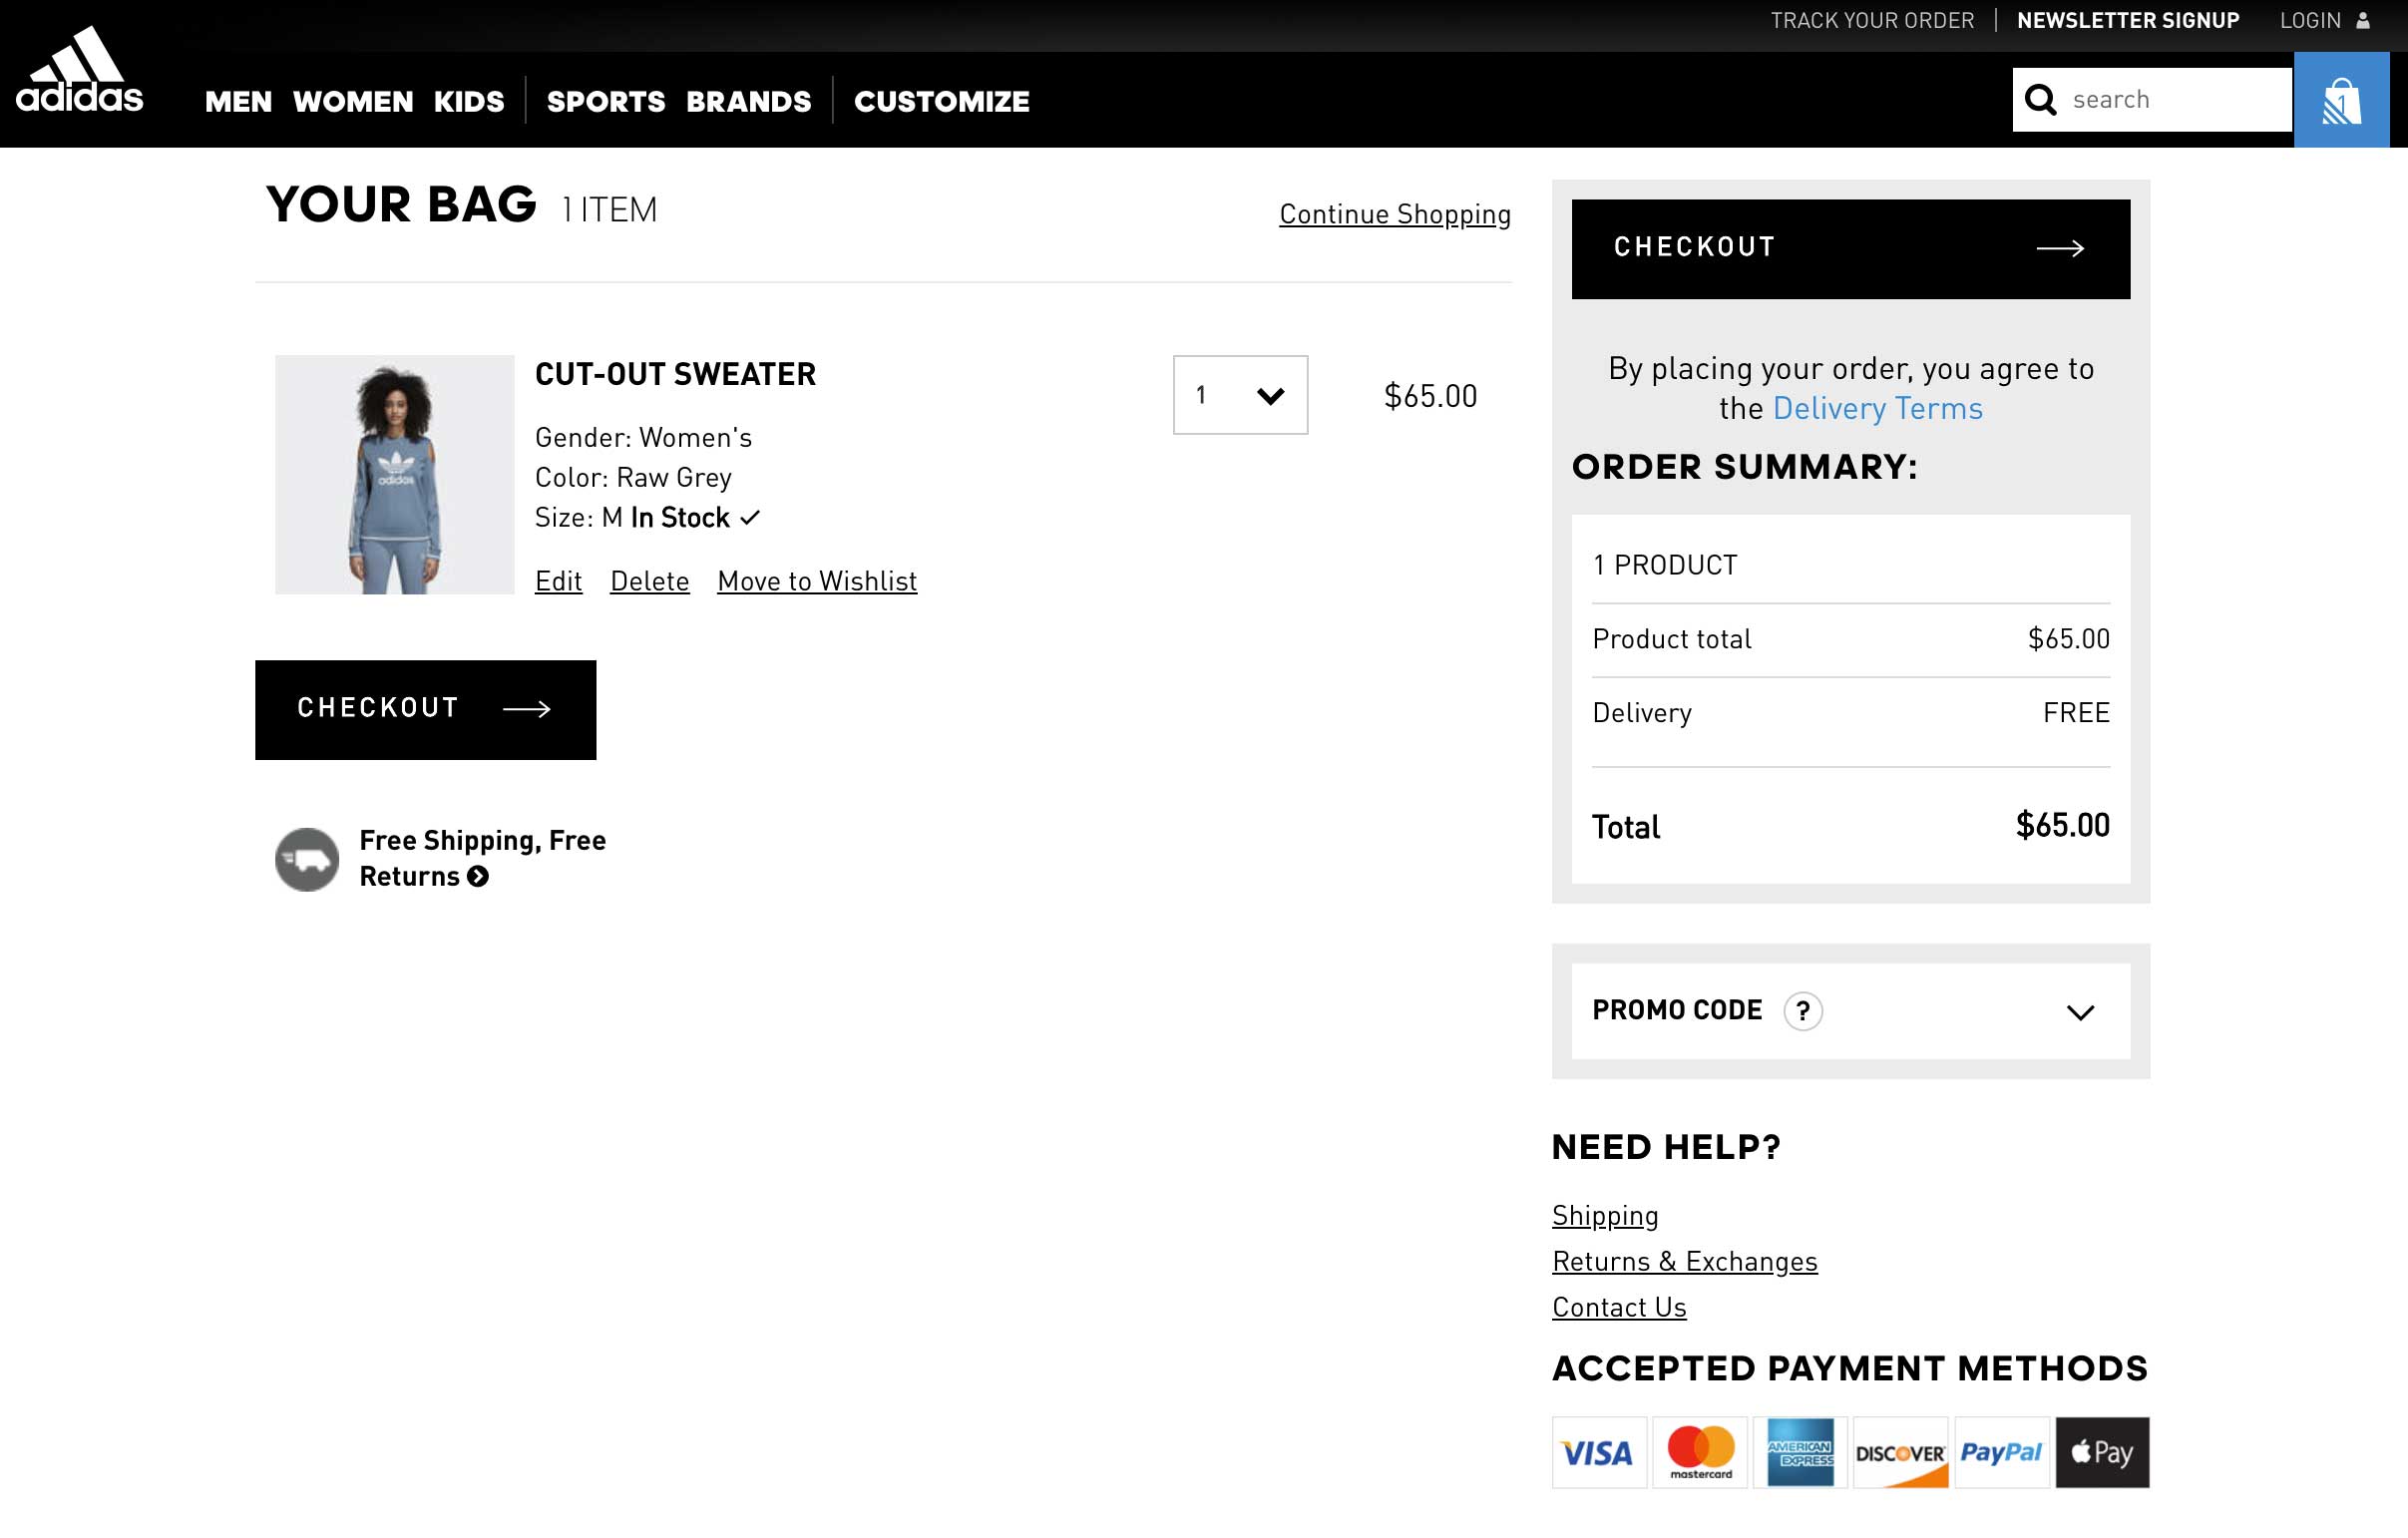
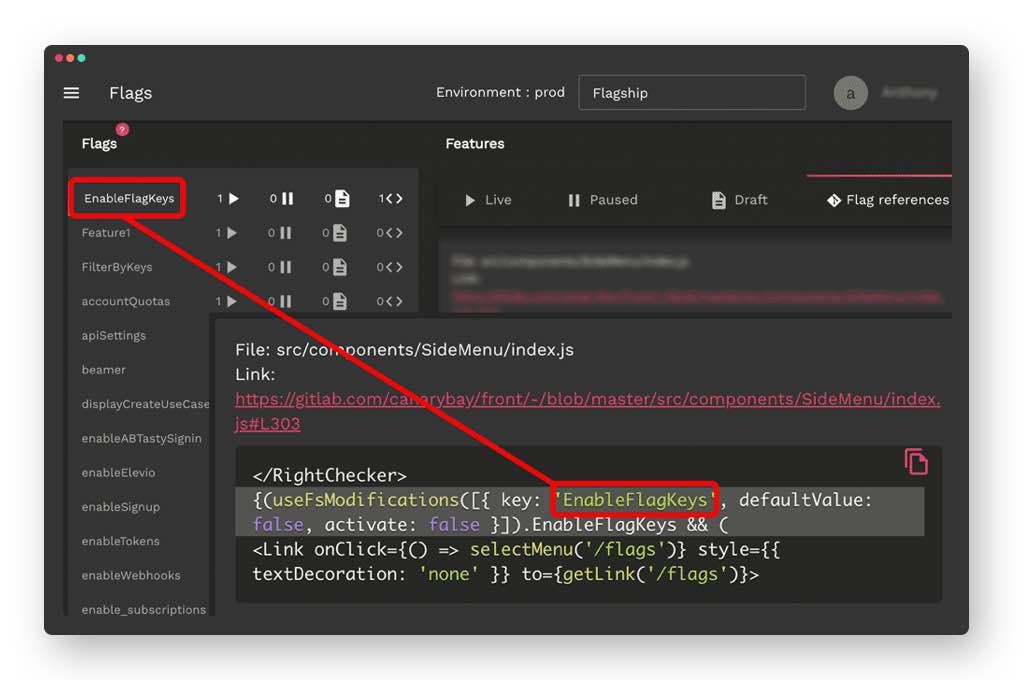
Using AB Tasty, you can easily create a Feature Toggling use case on your AB Tasty account and choose the KPI you want to follow, in this case that would be the clicks on the “Proceed to checkout” button and then “conversion rate” as a sub KPI.
You can then define the two scenarios: one to enable the feature on desktop and another to enable it on mobile devices. You will then configure the flag that will turn on the new payment method for each scenario as seen in the image below in the “Scenario mobile” on the dashboard.
Next, let’s take a look at real-life examples of how AB Tasty clients use feature flags to carry out mobile testing:
Use case 1
Decathlon, a French sporting goods retailer with over 2,000 stores in 56 countries, wanted to test CTA placement to measure its impact across all devices, including mobile, and product listing pages (PLPs) with the help of feature flags.
In the original version, seen below, Decathlon APAC’s team was looking to test an earlier placement of the “add to cart” button on mobile on the main page below the product image to ensure a positive rollout and measure uplift. In the original version, users had to click on the product to go to the PDP before seeing this button.
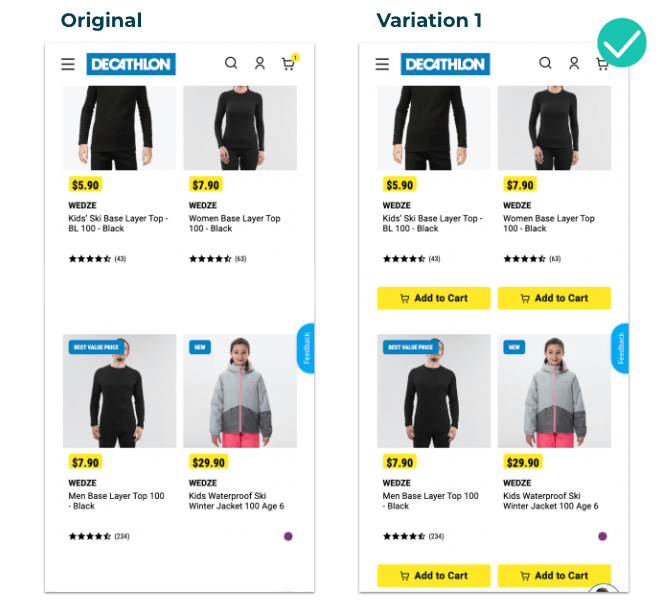
With AB Tasty’s robust solution, the team was able to test the impact of this new feature on conversion. Changing the CTA placement proved to be a success, resulting in a 10.37% increase in transaction rate and an $11.27 increase in the average order value.
Use case 2
EDF (Electricité de France) is the largest electricity supplier in France for over 70 years. The team at EDF wanted to increase the number of online subscriptions and calls via their application.
In particular, they wanted to monitor the effect of changing the CTA design in the app. Using feature flags to increase the visibility of the CTAs, the team could then measure the impact on (and boost) clicks for online subscriptions and/or calls with EDF advisors respectively.
The team ran an A/B test with the subscription CTA against an orange background and the call CTA against a green background. They also added text to communicate hours of operation.
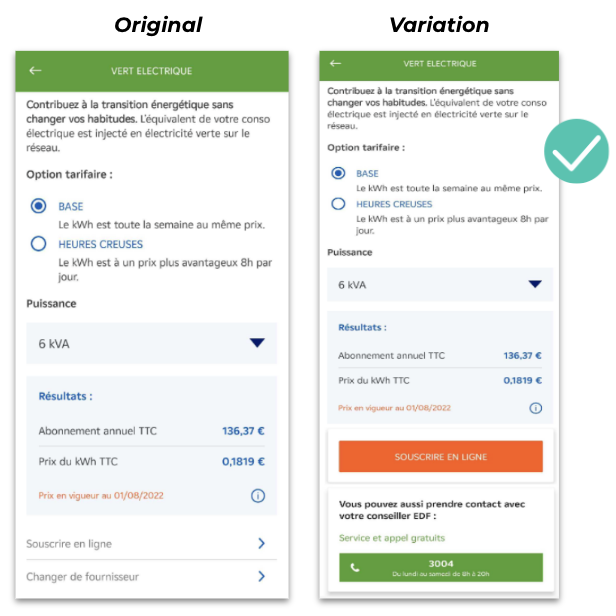
The call CTA was the one that yielded more positive results allowing the team to generate more qualified leads with an increase in calls with EDF advisors.
Thus, with a 20% increase in calls, the team could then confidently develop and roll out an adapted variation in the app where the new call CTA was more visible.
Use case 3
Often, A/B tests are a fool-proof way to eliminate potential bias and can save a company from investing in an optimization campaign that would otherwise take up a lot of valuable time and resources.
That was the case with Ornikar, a driving school platform in France with more than 2.5 million customers. The team was looking to revamp the home screen of their application and needed to identify which changes should be kept and which should be discarded.
The team set up an A/B test on AB Tasty to replace the existing carousel of four slides and two CTAs (left image) with a new screen featuring Ornikar benefits, a new CTA order and a more detailed carousel (right image).


The test was conducted for a duration of three weeks. After a week, they found that the new variation was not performing as wellas they expected so the team paused the test and adjusted the CTA and ran the test again for two weeks.
The results were still negative after two weeks and the team decided not to deploy the new home screen into production.
Due to the flexibility of the AB Tasty platform, the team was able to make quick iterations over a short period of time. Above all, Ornikar was able to avoid losing out on conversions and wasting time and resources as well as minimizing negative impact by testing the new home screen first before rolling it out to all its users.
Feature flags: The ultimate tool for better mobile experiences
As we’ve seen, feature flags are a powerful tool allowing teams across an organization to have more control over mobile testing and release while reducing risk.
Beyond giving you full control of new feature releases despite App and Play Store approval processes, feature flags enable teams to optimize their mobile apps and personalize the user experience. They also allow you to ship features more often and obtain quick feedback from your most relevant users.
With increasing mobile usage and millions of mobile apps to compete with, it’s essential to provide the very best user experience on mobile devices. Running experiments and using progressive rollouts with feature flags are key to delivering optimal and great mobile experiences.
Using a third-party feature flagging platform makes it easy to toggle features on and off and remotely configure your flags straight from the interface. By controlling all your feature flags in an easy to use web dashboard, it also ensures you’re keeping up with essential best practices to set you up for success and help you stand out from competitors.


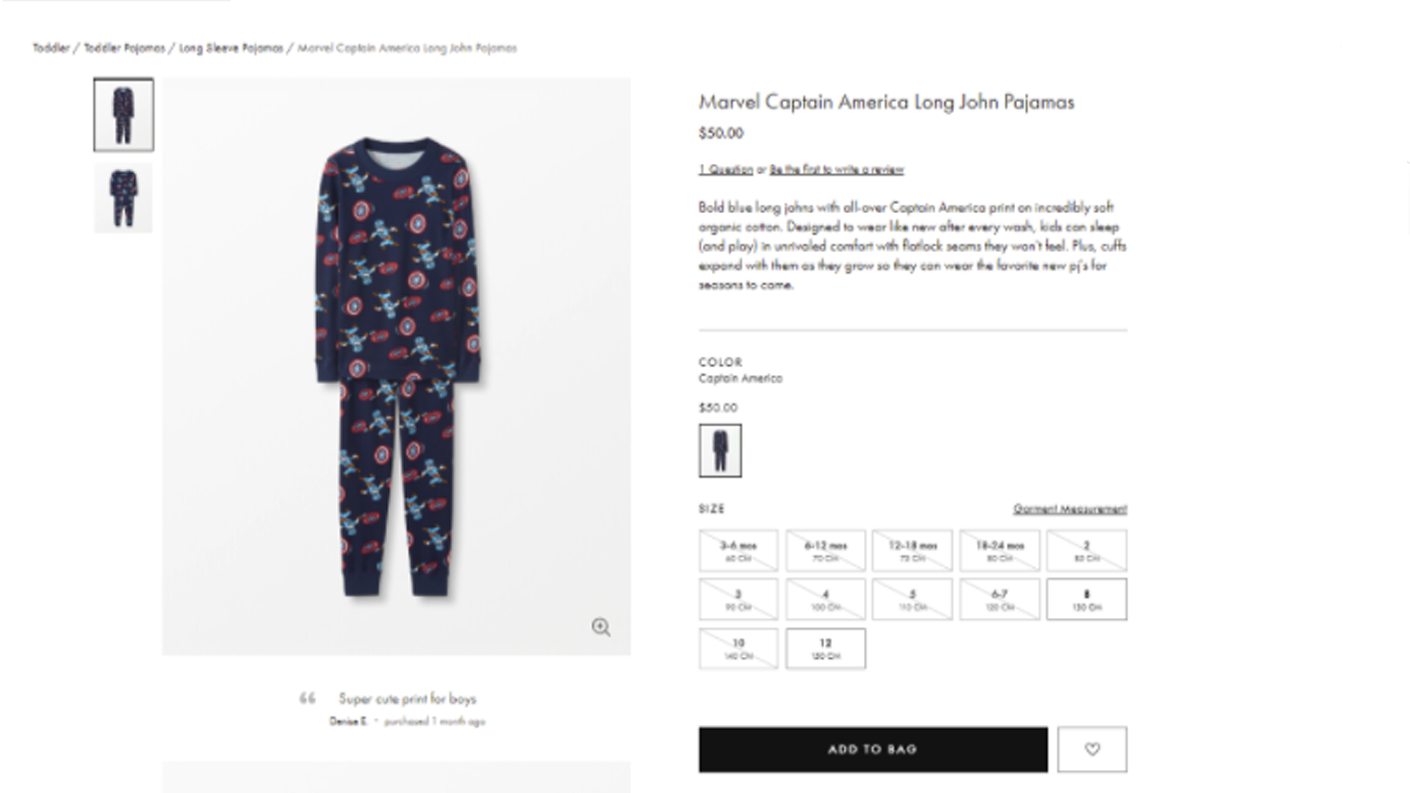 Variation:
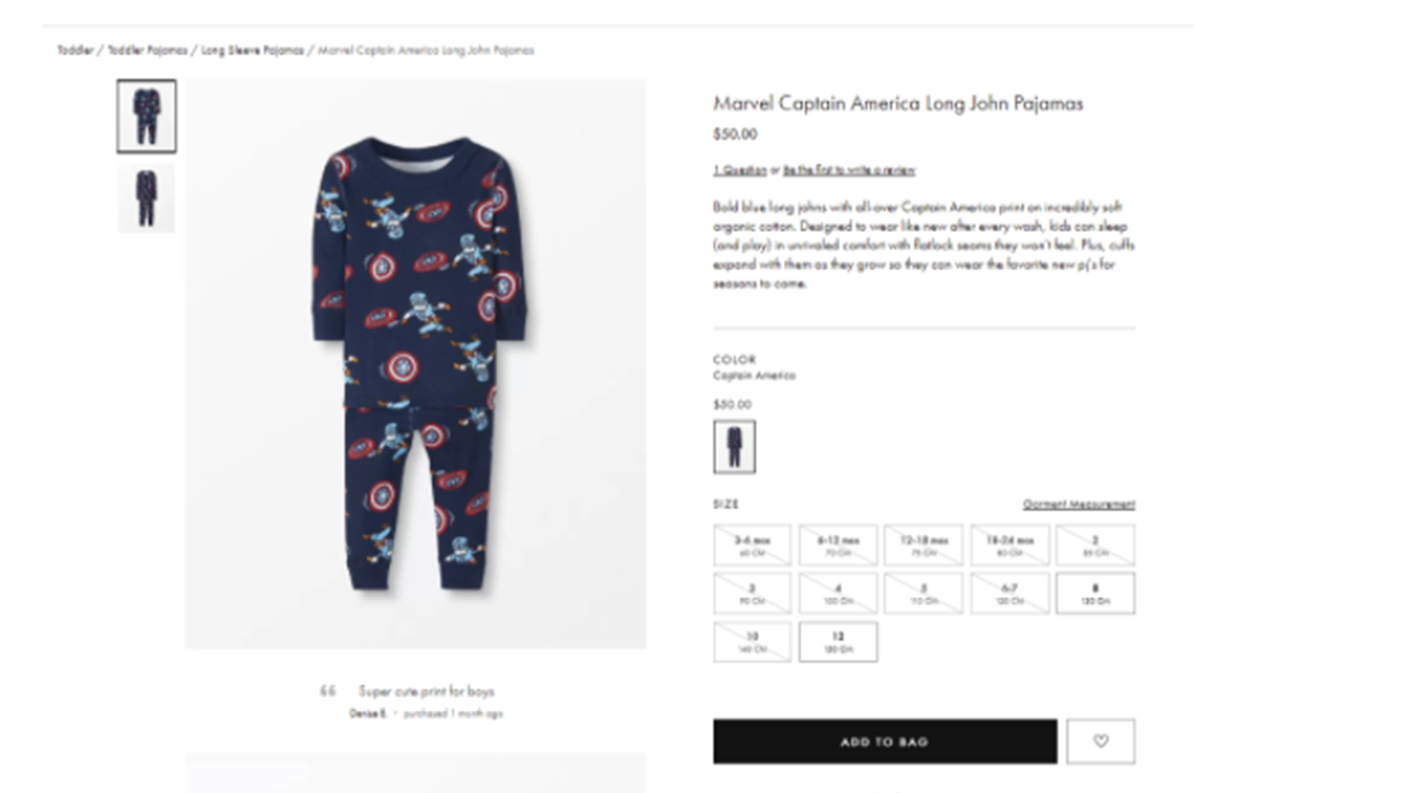


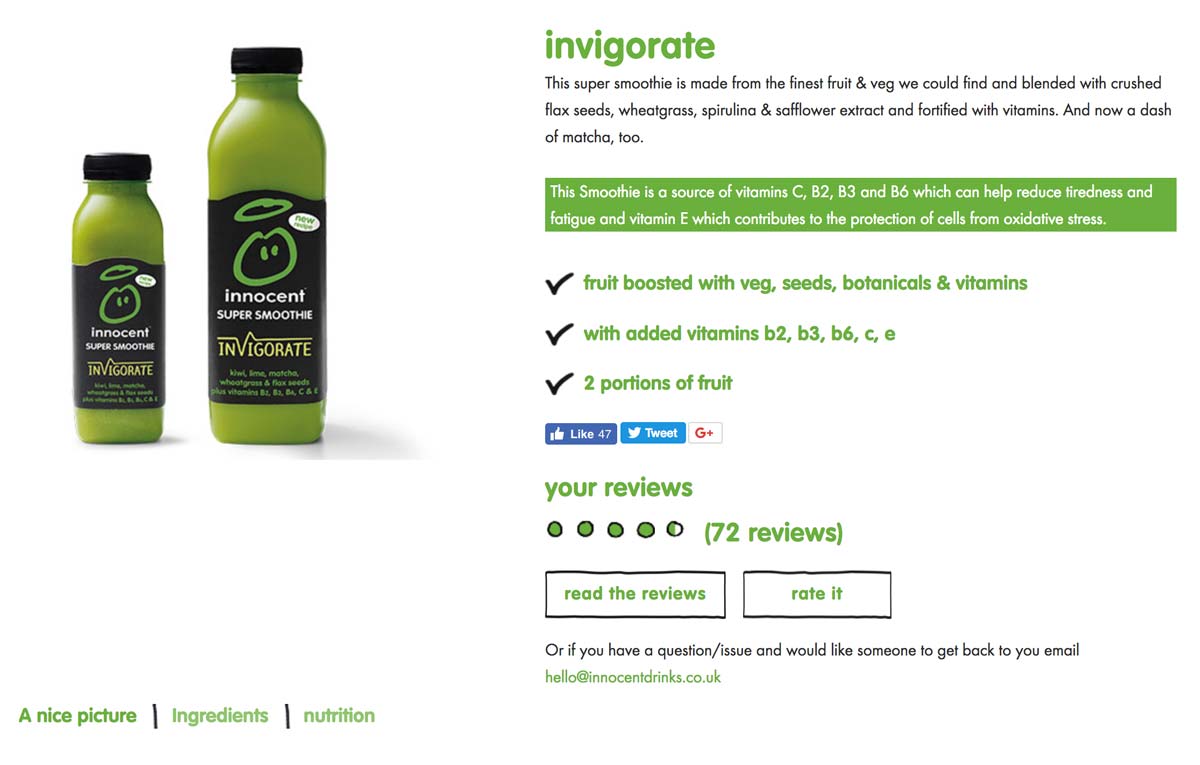 In the image above, you can see that they even highlighted in green that their smoothie is, “a source of vitamins C, B2, B3 and B6 which can help reduce tiredness and fatigue…”