Nowadays, as software development processes become more decentralized and as the number of teams working on different projects (in different places too) increases, it becomes that much harder to set and track metrics to measure performance across these teams.
And yet data is now more important than ever. Data is a company’s most valuable asset in order to measure how efficiently teams are performing over time to deliver the best products and user experience to customers.
This is especially relevant for DevOps teams where there’s a need for a clear framework to measure their performance.
This is where DORA metrics come in.
What are DORA metrics?
DORA metrics provide a standard framework to help leaders who are implementing a DevOps methodology in their organization to measure the performance of their teams.
This framework was the result of a six-year research program conducted by Google Cloud’s DevOps Research and Assessment (DORA) team after analyzing survey responses from over 32,000 professionals worldwide. Their goal was to determine the most effective ways to develop and deliver software.
Through the use of behavioral science, the research identified four key metrics that would indicate the performance of a software development team.
With these metrics, teams can measure their software delivery performance, monitor it over a period of time and be able to easily identify areas of improvement to optimize performance. In that sense, they shed light on the capabilities that drive high performance in technology delivery.
Therefore, DORA metrics are especially relevant for DevOps teams as they provide them with concrete data to measure performance and improve the effectiveness of their DevOps operations. It also allows them to assess whether they are building and delivering software that meets customer requirements as well as gain insights on how to improve and provide more value for customers.
The four DORA metrics
In this section, we will list the four main metrics that the DORA team identified for DevOps teams to measure their performance.
The following chart shows from the 2022 State of DevOps report, updated each year, shows the ranges of each metric according to the different categories of performers:
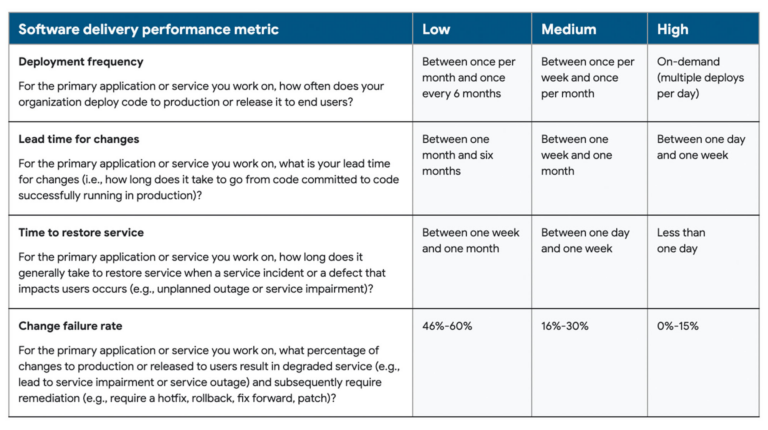
The four key metrics used are:
- Deployment frequency
Deployment frequency measures velocity. In this case, the goal is to measure how often an organization successfully deploys code to production or releases it to end users.
This is an important metric particularly for DevOps teams whose ultimate goal is to release software quickly and frequently. It helps teams to measure their productivity and agility as well as uncover issues and bottlenecks in their workflow that may be slowing things down.
High performing teams deploy on-demand, multiple times a day. Thus, this metric stresses the importance of continuous development and deployment, which is one of the principles of a DevOps methodology.
Each organization will need to consider what constitutes a “successful” deployment for its teams such as taking into account what level of traffic is sufficient to represent a successful deployment.
How to improve this metric:
To enhance this metric, it’s usually best to ship code in small batches on a frequent basis. This will allow you to reduce risk of deploying bugs and increase speed of delivery. Implementing an automated CI/CD pipeline will also enable you to increase deployment speed.
- Lead time for changes
Lead time for changes is the amount of time it takes a commit to get into production. Therefore, this metric also seeks to measure velocity and gives an indication of a team’s cycle time. The lower the lead time for changes, the more efficient the team is at deploying code.
This metric requires looking at two pieces of data: when the commit happened and when it was deployed. The goal is to keep track of the time development starts until the committed code is finished and deployed to uncover any inefficiencies in a team’s processes. The average time can then be used to analyze overall performance.
In other words, the purpose of this metric is to give an indication of the waiting time between the initial stages of implementing the change and deployment. A high lead time may suggest inefficiencies in the CI/CD pipeline and not enough automation, especially if every change has to go through manual testing instead which significantly slows things down.
How to improve this metric:
Again, here it’s best to work with smaller changes. This allows for faster feedback so developers can immediately fix any issues. Teams should also eliminate bottlenecks and integrate automated testing at every stage of the CI/CD pipeline to detect issues early on.
Feature flags are also a great tool to lower lead time as any unfinished changes can be hidden behind a flag while other changes can be deployed.
- Change failure rate
This represents the number of deployments causing a failure in production. In other words, it measures any changes to code that resulted in incidents, rollbacks or any other failures. This depends on the number of deployments attempted and how many of those resulted in failures in production.
As a result, this metric is a measure of the stability and quality while the previous two focus mainly on speed of software delivery.
This metric requires the number of deployments that resulted in failures divided by the total number of deployments. The percentage calculated will give insight into how much time is dedicated to fixing errors as opposed to delivering new code.
The lower the rate the better. High performing teams have a change failure rate of 0-15%.
Consequently, teams with a low change failure rate is a sign that these teams have an efficient deployment process in place, which can be mainly achieved through automating every step of the process to avoid common manual errors.
It’s important to note, however, that this metric can be hard to quantify as the definition of failure can vary widely. Therefore, it’s best for each organization to set goals for its teams according to their unique business objectives.
How to improve this metric:
Automation is crucial to also help improve this metric. Automated tests can evaluate code at every stage in its development. This way, issues are caught and fixed early on so they’re less likely to make it to production. Creating critical feedback loops are necessary to get a low change failure rate to prevent incidents like this from happening again in the future.
- Time to restore service
Also referred to as “mean time to recovery MTTR”, this indicates how long it takes for an organization to recover from a failure in production that impacts user experience.
This metric, like change failure rate, is meant to determine the stability of a system or application when unplanned outages occur. Thus, information about when the incident occurred and when it was resolved then deployed will be needed to measure the time to restore service.
Therefore, the “time to restore service” metric is important as it encourages teams to build more stable systems and create action plans to be able to respond immediately to any failures. High performing teams will resort to deploying in small batches to reduce risk while increasing speed of delivery.
This is particularly applicable to DevOps teams as they place high emphasis on the idea of continuous monitoring, which will in turn help them to improve their performance when it comes to this metric.
How to improve this metric:
Consider using feature flags. Feature flags act as switches enabling you to turn a change on or off in production. This means that if any issue occurs, you can toggle the switch off if something goes wrong with a change in production with minimal disruption while it’s being resolved. This will then help reduce your MTTR.
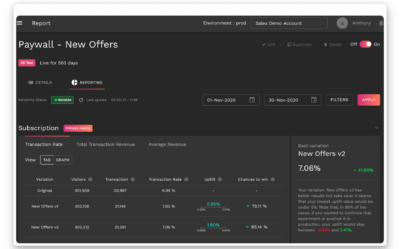
The DORA metrics can then be compiled into a dashboard. To do so, DORA created the Four Keys dashboard template to generate data based on the metrics and visualize the results. See example below of this dashboard:
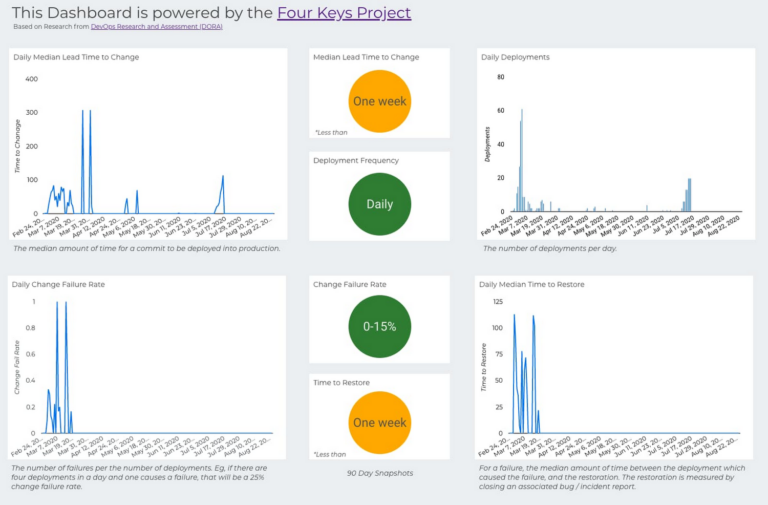
The dashboard gives a higher-level view for senior stakeholders of their organization’s DORA metrics to understand how their teams are performing and what corrections can be done to remedy any problems.
Why are DORA metrics important?
As we’ve already mentioned, DORA metrics are a great way to keep track of the performance of DevOps teams and identify areas of improvement.
It helps organizations assess their delivery process and encourage teams to streamline their processes and increase the speed of delivery while maintaining quality.
As a result, the main benefits of these metrics are:
- More effective decision-making– with the data acquired from these metrics, teams know what aspects to focus on that need improvement. Teams can easily detect issues and bottlenecks within the software development process and devise an action plan to address them. Decisions will be based on data rather than opinions or gut feelings which may be misleading.
- Better value- DORA metrics will give teams an indication whether they’re delivering value to customers by evaluating the efficiency of your value stream and finding areas to improve within your delivery process to build higher quality products.
- Continuous improvement- this is particularly important as it is one of the main pillars of a DevOps methodology. Using DORA metrics, the team gets insight on their performance and set goals to improve the quality and delivery of software.
Challenges of DORA metrics
DORA metrics have a lot of advantages, but they do come with their own challenges as well.
One of the main challenges when faced with these metrics is that they will vary across organizations and teams as, often, they have different definitions and processes in place. In other words, no products or teams are the same and may operate at their own level of complexity. As a result, it’s important to put this data into context before making decisions.
DORA metrics give a good overall picture of how teams are performing in certain categories. This means that it’s important to have a valid way to keep track of the data but don’t rely solely on them.
Teams may be facing issues beyond what is accounted for in these metrics. DORA metrics are focused mainly on the bottom line instead of the inputs and processes that lead to the outputs being measured. Sometimes, there’s more to the story than what DORA metrics measure so tread carefully.
Ultimately, enhancing performance will be unique to each organization. Work on shifting your attention to your team and goals to give context to the story all these metrics are telling. Focus on building the right culture for your team and providing them with the tools they need to enhance performance. This, in turn, will help them deliver business value faster.
DORA metrics: The key to unlocking more value
DORA metrics are a great starting point, especially to help teams make informed decisions about what can be improved and the steps to take to achieve that.
They give a good indication of a team’s progress along their DevOps journey and encourage the implementation of the key principles of DevOps including shipping in small batches more frequently.
In particular, it enables them to assess and analyze the efficiency of their development and delivery processes by offering a framework for measuring performance across two important variables in DevOps: speed (deployment frequency & lead time for changes) and stability (change failure rate & time to restore service).
Teams will then be able to create more value for their customers faster. Above all, DORA metrics are a way for teams to shift their focus to maximizing velocity and stability.
It’s important to note that tracking these metrics should be in line with your organizational goals and customers’ needs to give context to these metrics, make sense of them and improve them.
Feature flags are also another effective way to improve performance across these metrics. They will allow you to ship new changes in small batches and hide any that are not yet ready to speed up deployment while reducing risk of big bang releases making problems easier to detect and resolve.
Get a demo of AB Tasty to unlock the value feature flags can bring to your teams today.


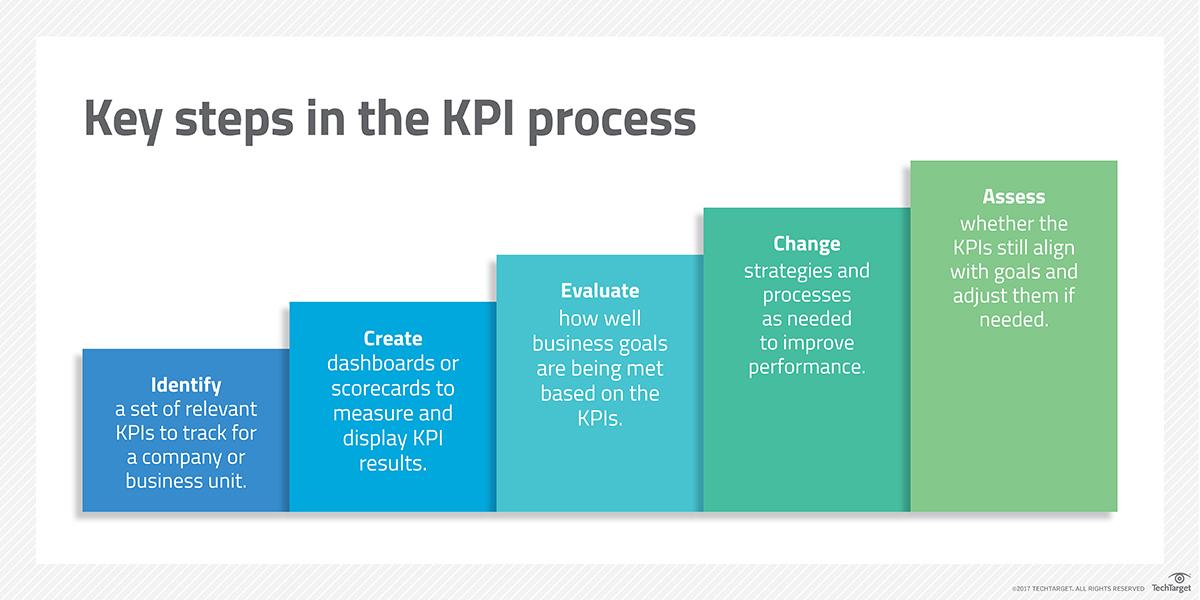
 Once all these criteria have been met, a KPI can be properly designed and implemented with confidence. However, it will need monitoring and adjustment as time goes on once the KPI has been fully integrated.