In an increasingly cutthroat digital age, standing out in your niche while meeting the exact needs of your consumers is essential to business growth and longevity.
By getting under the skin of your customers, you can tailor your messaging, applications, and touchpoints to meet their exact needs —that’s where eye tracking enters the mix.
Consider this for a moment:
You’re running a usability test on a product landing page for a new range of gym shoes. Your test subject, Nancy, browses the page and chooses a shiny new pair of gym shoes with ease. But, on the next page, there is a snag. She hesitates and eventually abandons her cart because the journey was confusing.
You take notes based on Nancy’s feedback and think about how you can improve your checkout journey. But, if you could view her movements— or see what she sees—you would have the power to make informed improvements that will ultimately increase conversions and drive more sales.
With eye tracking, you can. But while this widely-used sensor-based technology offers a deep glimpse into user browsing behavior, some industry experts believe that eye tracking is an unnecessary expense.
Like many platforms and digital innovations, with the right approach, eye tracking will give you the tools to offer your customers a seamless level of user experience (UX)—the kind that will increase loyalty while helping you boost your bottom line.
Here we explore the dynamics of eye tracking and explain why it could make an excellent investment for your business.
So, what is eye tracking?
Eye tracking is a type of sensor technology that gives a computer or mobile device the tools to understand and trace where a person is looking.
An eye tracker can detect the presence, attention and focus of a user while engaging with a specific app, touchpoint or website.
From a marketing perspective, eye tracking dates back to the 1980s, where it was used to test and measure the value of ads in print papers or magazines.
An effective alternative to lie detection-style techniques such as voice stress analysis and galvanic skin response (neither of which offer truly reliable results or data), eye tracking gave the advertisers of the day essential insights into which elements of a page people read as well as how long they spend engaging with specific pieces of content.
The popularity of the eye tracker rose over the years and the rapid evolution of digital technology paved the way for a wealth of innovative developments.
Now, eye tracking technology is able to offer deep-dive insights into user behavior and dynamic page as well as app design as well as offering intuitive tools that enhance the user journey for disabled people.
In the modern age, one of the most prominent features of eye tracking is a little something called Facial Expression Analysis (FEA).
Based on ‘points of fixation’—times during the user journey when someone stops and focuses long enough to process the content before them (commonly known as a ‘saccade’)—FEA technology helps marketers gauge the effectiveness of their page design and messaging.
But, how does this apply to business and why is it so useful? Let’s find out.
Why is eye tracking useful in the digital age?
As a marketer or business owner, the more you understand your target audience, the more chance you have of creating a fluent and engaging customer journey across platforms.
As eye tracking provides a visual map of how your users engage with your website, landing pages, and mobile applications, you can identify strengths and weaknesses related to user experience (UX) and content placement.
An essential part of the consumer research process, eye tracking is a powerful medium as it taps into the fact that 95% of human decision-making (particularly online) is carried out sub-consciously.
By using eye tracker tools to trace navigational patterns, you can adopt your customers’ vision, uncovering information that will help you to make improvements that boost engagement, improve your customer experience (CX) offerings, and ultimately, accelerate the growth of your business.
From heat mapping to task-based usability tools, there are a wealth of eye tracking innovations available to businesses in today’s digital world.
Invest in the right eye tracking tool for your business and you will:
- Understand what your target audience is looking at and for how long
- Identify redundant or disruptive visuals or design elements
- Document how users scan and interact with your web pages or apps
- Gain a practical understanding of what works and what doesn’t
- Prove the value of certain marketing strategies, techniques or campaigns
- Continually improve and evolve your efforts in a landscape that is ever-changing
Eye tracking is an effective means of seeing through the lens of your customers. But, as powerful as it is, eye trackers alone are unlikely to give you a complete insight into the content that really sticks in the users’ mind.
To gain additional context on how to use your data to improve usability and drive engagement, eye tracking should be a pivotal part of your consumer research strategy rather than a sole means of information.
That said, if you use it the right way, eye tracking can help you understand your customers in ways that can give you an all-important edge on the competition.
How eye tracking can help you understand your customers
Using eye tracking to understand your customers on a deeper level boils down to adopting a cohesive mix of the right tools and techniques.
Eye tracking tools and software provide a visual representation of your users’ focus points—returning data based on:
- Fixation points or saccades: information that can tell you how engaging or eye-catching particular elements or pieces of content on a webpage are to your customers.
- Navigational patterns: by understanding common navigational patterns, you can see how people scan or interact with your page. This level of knowledge will give you the data you need to optimize your content and design for increased engagement and conversions.
- Problematic elements As mentioned, an eye tracking test will return invaluable data based on any images, graphics, calls to action (CTA) or command buttons, informational content or design elements that hinder the user experience and prevent customers from either getting what they need from your page or carrying out a desired action (clicking through to a specific product page or signing up to an email newsletter, etc).
Automotive repair and wreckage company, Truckers Assist, conducted eye tracking tests to track the performance of its homepage.
This test showed that while the ‘NO FEES’ graphic (the red point on the image) was gaining a lot of attention, it wasn’t clickable. As a result, many users were focusing their attention in the wrong place, steering them away from more valuable information as a result.
To fix this glaring issue, Trucker Assist improved its homepage design, removing the ‘NO FEES’ banner and placing focus on its contact information and service search bar.
Conducting successful eye tracking testing takes consistency as well as a clear cut goal. Do you want to improve the user journey of your new mobile app? Are you looking to drive more revenue through a specific product page? Perhaps you’re trying to understand if your general messaging and branding is performing the way it should?
There are many actionable insights you can gain from eye tracking—and outlining your specific goals will give your tests or studies direction.
This hand-picked video offers practical advice and information to help you get started with eye tracking:
How eye tracking benefits UX optimization
88% of consumers are less likely to return to a website after a poor user experience. Today’s consumers expect a seamless level of UX from brands and businesses—anything less and you could see customer loyalty as well as sales drop through the floor.
Eye tracking and UX go hand in hand. Through eye tracking, you will gain access to objective and unbiased insights that will show you where improvements are necessary.
With eye trackers, you can drill down into a specific UI element (is it facilitating the right interactions or are your consumers missing it altogether?) to test whether it fits into the user journey while getting to the very root of any distracting, problematic or misleading page elements.
This perfect storm of on-page information will empower you to make very specific improvements to any app, web or landing page—enhancing its usability and performance significantly.
How eye tracking works in a nutshell
As a concept, a significant part of eye tracking is based in Fitts’ Law. Essentially, every visual object or element carries a certain amount of ‘weight’ and this determines the amount of attention as well as clicks it ultimately earns.
Concerning eye tracking and UX, Fitts’s Law is important because it can help you predict the amount of time taken to move the eyes or cursor to a specific target.
Armed with this information, you can establish a visual hierarchy and optimize your webpages or applications to ensure consumers can connect with the right functions or information at the right times within their journey.
To get your eye tracking tests off to the best possible start, giving you users clearcut instructions while ensuring good lighting and consistent positioning is essential. Doing so will give you reliable data, as detailed in this infographic from IMOTIONS:
![]()
Essential eye tracking methods & techniques
There are thousands of eye tracking tools and countless ways of approaching this most powerful approach to user testing.
To guide you along the right path, here we’re going to explore the most essential eye tracking methods and techniques.
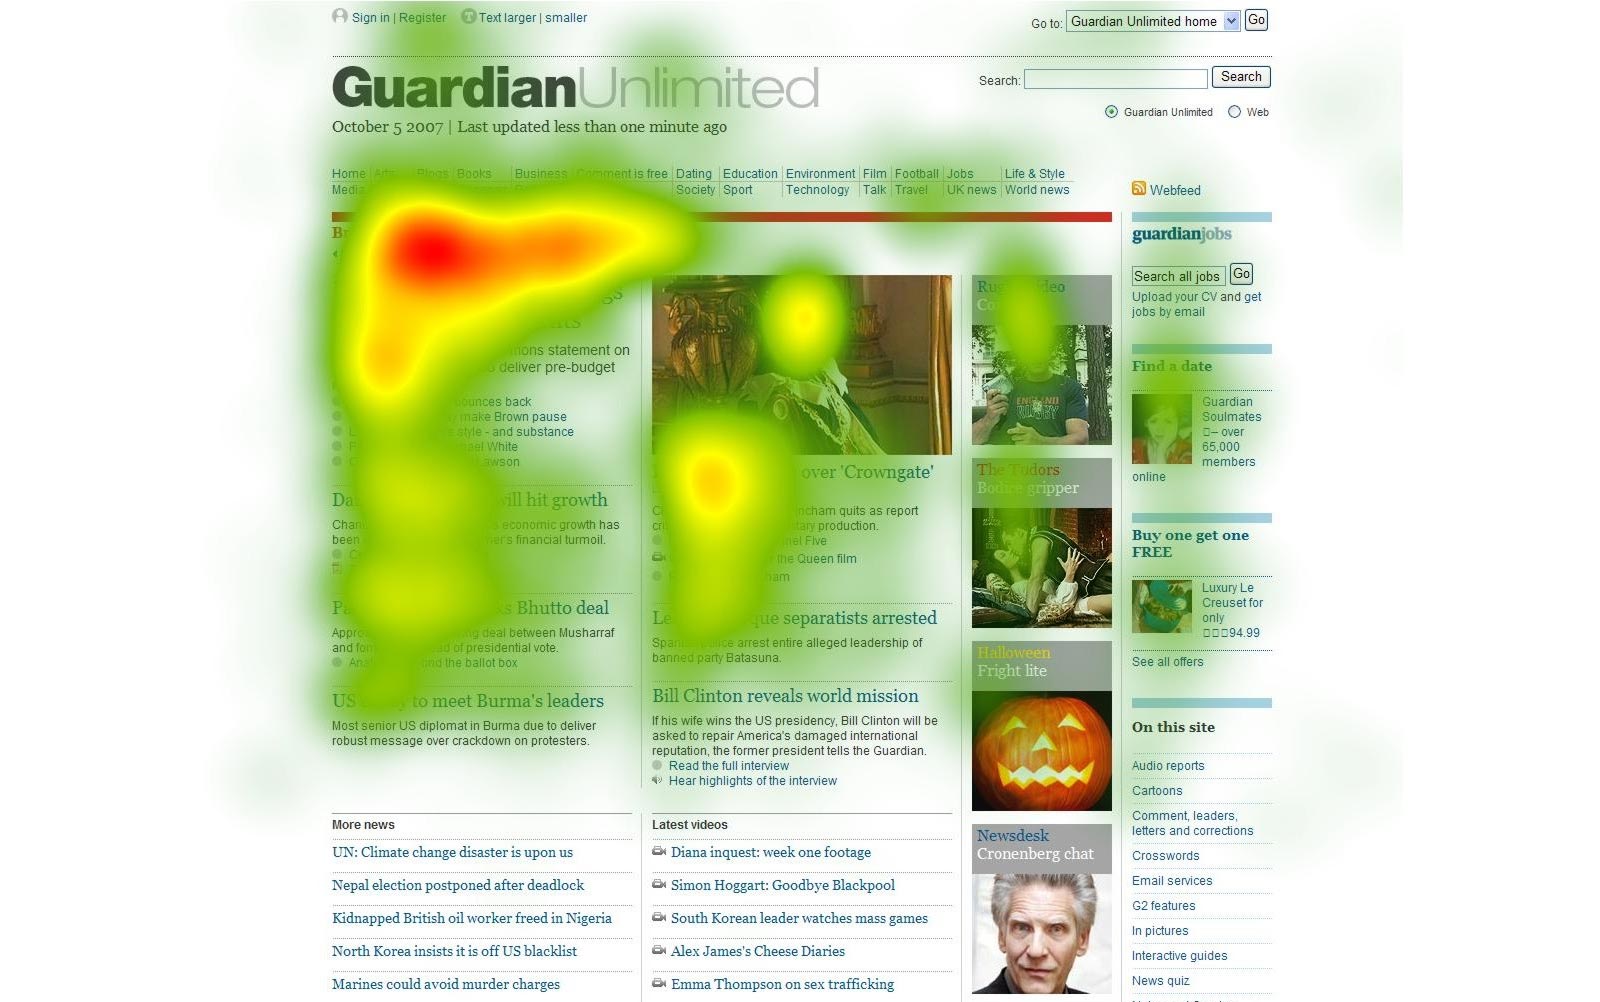
Heat maps
A branch of eye tracking, a heat map is a dynamic tool that offers a definitive visual representation of where users focus their attention and how they navigate your website based on their on-page interactions.
Heat mapping platforms provide color-coded data to give an indication of the areas of a website or mobile page users are interacting with the most.

As you can see from the image above, the red spots show the areas where users focus their attention most while the lighter colors are the areas with the lowest engagements.
Heat mapping technology also serves concrete data based on how much particular buttons or links are clicked by users on a page while offering navigational information such as scroll rates to show how far people move down the page before bouncing off.
To gain a full working insight into this effective optimization tool, read our full guide on using heat mapping to uncover areas of improvement on your website.
Focus mapping
Essentially an inversion of heat mapping, focus mapping provides digestible visual insights on the main fixation points on a specific page.
With focus maps, the page is blanked out except for the spots that receive the most attention or fixation.
A visual technique to complement additional eye tracking tests and consumer research strategies, with focus mapping you will get a panoramic view of which elements are working as well as the content you need to improve to encourage focus and engagement.
Gaze path plots
As sensory-based technology, eye tracking can provide a wealth of valuable insight in a single browsing session.
By adding metrics related to time as part of your eye tracking strategy, you can follow the path a user takes on a webpage and the time they spent on each element.
As you can see from the ‘Where’s Wally’ video, gaze plots make an effective eye tracking technique as they offer a dynamic interpretation of how users interact with your site or mobile app.
If you follow these paths, it’s possible to get a real-time insight into the eyes of your audience. This wealth of visual eye tracking data will empower you to drill down into specific areas of a web or app page, making design or content tweaks to optimize the overall user experience.
Eye tracking metrics
In addition to diversifying your approach to eye tracking and working with a mix tool or platforms, focusing on the right metrics will improve your chances of success exponentially.
Here are the main eye tracking metrics you should work with during your user research tests and studies:
- Areas of Interest (AOIs): Before running an eye tracking test or study, you should determine your AOIs. Mapping out your main areas of interest on a particular web or mobile page will give your test definitive direction while ensuring you only collect or concentrate data to provide answers to the right questions.
- Dwell time: This metric is focused on the actual amount of time a user or test subject spends interacting with a predetermined AOI. You can, for instance run A/B testing to compare two versions of a webpage to see which one returns the healthiest AOI dwell times and thus, offer the best return on investment (ROI).
- Fixation count: Like dwell time, fixation count can offer interaction data based on your AOIs. But, rather than quantifying time, fixation count records up how many fixations your AOIs receive during a test or time period. As such, you can compare fixation and dwell time data to identify a correlation while painting a panoramic picture that will make your optimization efforts more successful.
- Ratio: In an eye tracking context, ratio will tell you how many users or test subjects have guided their gaze to a particular AOI. Tracking ratio will give you an insight into whether you need to alter a specific piece of content or design element to capture the attention of more users and streamline your site navigation.
- Revisits: Based on your AOIs, revisits determine how many times a user returns their gaze to a specific point during a test or browsing session. This metric is beneficial for understanding whether your design and layout make it easy for people to navigate a page or not. If you find that a particular AOI is showing a high rate of revisit rates, it might be that your content is a little confusing or that there is a design element causing distraction.
Getting started with eye tracking: best practices
Now that you understand how eye tracking works and you’re acquainted with essential techniques, we’re going to look at some top tips to help you get the most from your eye tracking test efforts:
- Once you’ve established the aims and criteria of your test, allow your users to complete the process uninterrupted. Asking questions during the test itself is likely to distract your test subjects, skewing your results in the process.
- Make sure that your participants remain within the monitoring range from start to finish. If a subject falls out of position, halt the test to ensure they are back in the monitoring range. Doing so will ensure the best quality data.
- For qualitative testing and manual eye tracking, around five test subjects will typically offer the level of insight you need for the job. For heat maps and broader eye tracking studies, it’s recommended to use at least 39 test subjects for well-rounded and actionable results.
- For mobile optimization tests, you should focus on the performance and value of your functional icons across devices; the precision of your error messaging; and the consistency as well as responsibility of your mobile design and layout.
- To maximize your eye tracking efforts, working with customer experience optimization experts will help you run successful eye tracking-type tests that will return data that is aligned with your specific strategies and goals.
Final thoughts
“You can’t solve a problem on the same level that it was created. You have to rise above it to the next level.”
—Albert Einstein
Niche or sector aside, without knowing your audience and understanding how they interact with your business, you are merely shooting in the dark.
In an ever-evolving digital age, a data-driven approach to consumer research and UX optimization will help you meet your users’ needs head on while empowering you to adapt to constant change.
Eye tracking may not be the answer to all of your consumer-centric needs but this most innovative of sensor technology could easily play an important role in your ongoing marketing and development strategy.
There is no one-size-fits-all way to approach eye tracking—success will depend on your goals and needs as a business. But, by embracing the methods and techniques we’ve discussed, you will open yourself up to a treasure trove of data-driven insights that will accelerate the growth of your business.
We hope our guide to eye tracking has helped you on your way and for more business-boosting pearls of wisdom!