Article

7min read

How to Effectively A/B Test your Content Headlines

Breaking news: according to CopyBlogger, 80% of all readers never make it past the headline.

If you read this, you’re among our happy 20% and you shall not be disappointed.

The truth is: it’s a pretty serious issue for all publishers.

Similarly, the Washington Post reported that 6 in 10 Americans acknowledge that they don’t read past the headlines regarding any type of news.

So, should we just stop writing?

Obviously not.

In 2018, the written content is still one of the most consumed media (in competition with videos) and remains a powerful tool to:

  • Build brand awareness
  • Generate B2B Leads
  • Report news
  • Drive sales
  • Grow your audience
  • Rank on search engines

Knowing that most readers won’t spend more than 15 seconds reading an average article (source: Buffer), crafting powerful and catchy headlines has never been more important to ensure that your audience will stick around for a while and that you don’t produce content in vain.

But how do you make sure that your headlines really work?

It’s simple: you need to run some headline A/B testing.

What is headline testing?

Definition: headline testing consists of creating several title variations for the same article (or online media piece) in order to find out which one performs the best.

Based on your objectives, headline testing can be used to track several metrics such as:

How to conduct headline testing

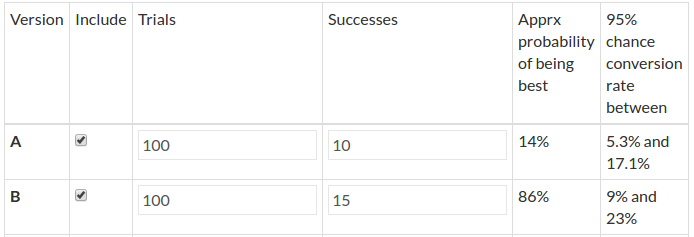
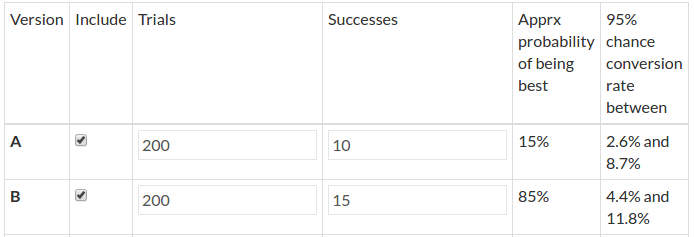
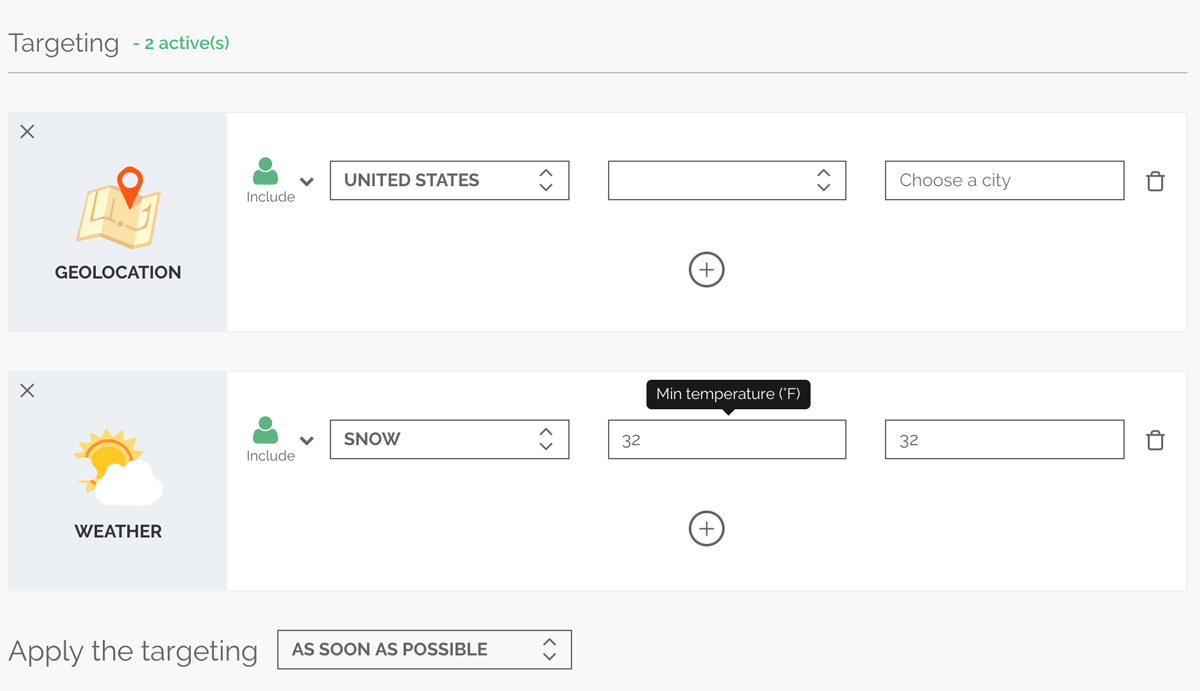
Headline testing requires you to define a title as the “control version” in order to compare it with one or more variant.

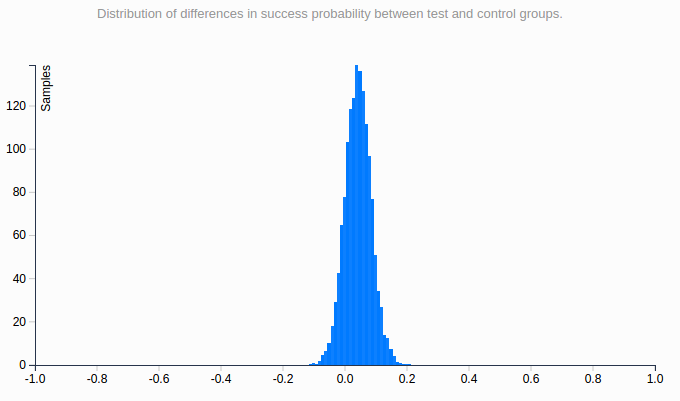
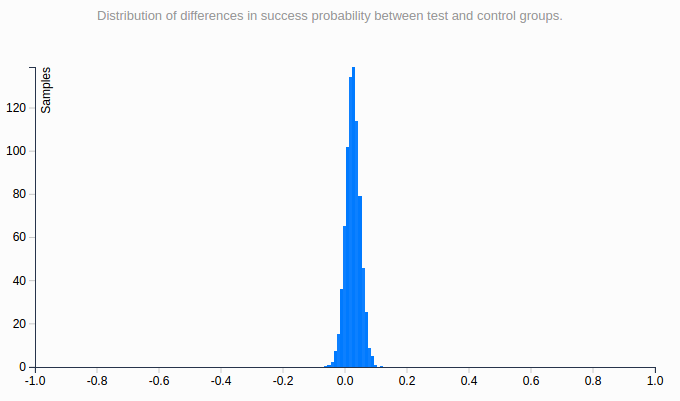
While choosing the number of variants, bear in mind that the more variants you wish to test, the larger sample you will need in order to obtain statistically relevant results.

Once you’ve chosen your variants, you will use an A/B testing tool to run your tests and see which headline outperforms the others.

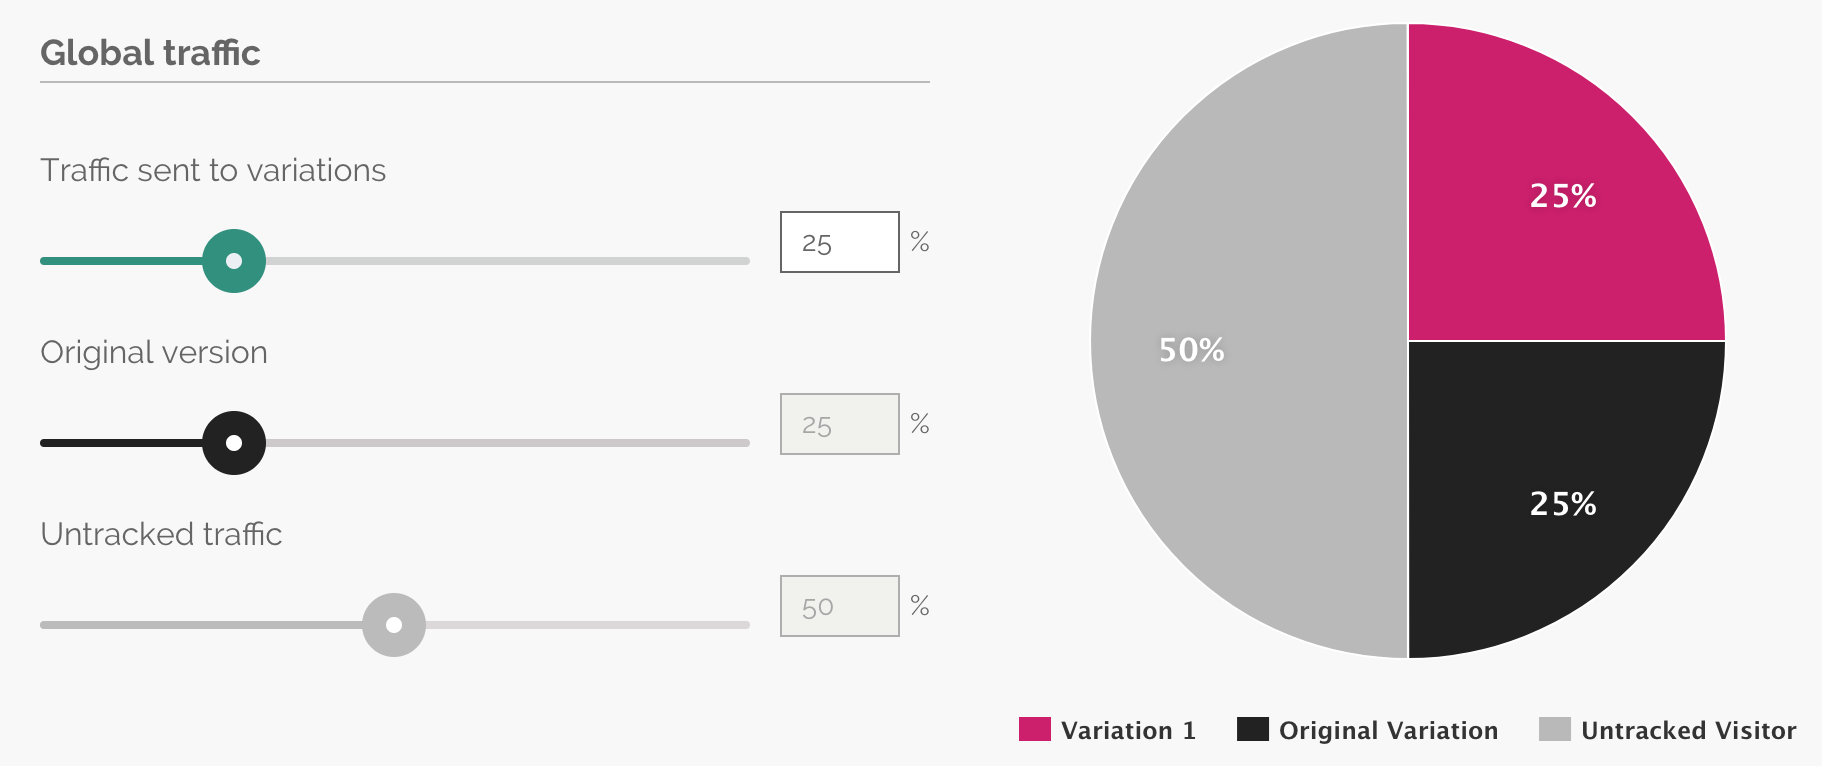
Typically, an A/B testing tool will send a percentage of your page’s traffic to each variant until it identifies a winner.

From there, the tool will allocate 100% of the traffic to the “winner” in order to maximize your page’s performance.

Sound good?

Let’s see how to come up with brilliant headline ideas that you will be able to A/B test later on.

How to brainstorm headline ideas

Headlines come in many forms depending on whether you’re writing an article, a landing page or even a product description.

Given this variety of headlines, we’ll try to help you craft various headlines through general guidelines to meet your business objectives.

Catchy content headline to test
Source: EveryDayBright

Include real data and numbers

Numbers act like candies for the brain: we just love to see them because they give us facts and figures to work on.

Overall Headline Preferences
Source: Conductor

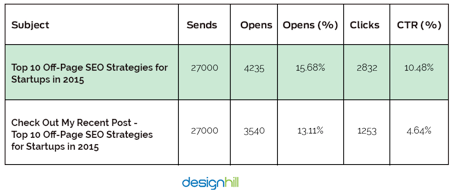
In 2013, Conductor came up with a study that showed the impact of adding numbers to your headlines: it appears that readers do prefer headlines that include numbers.

Craft a strong value proposition

Creating a value proposition for your readers means that you need to work on including a real benefit inside your headline.

Working on your value proposition is the cornerstone of every headline creation process: it helps you address your core audience while promising something in exchange for their attention.

Depending on the content you’re working on, crafting your value proposition is a process that basically sells your content: it will determine whether or not your potential readers will click on your content.

Headline testing
Source: GoinsWriter

Here are some formulations commonly used to craft a strong value proposition:

  • Recipes for success
  • Expert opinions
  • Special offers and discounts
  • Tips and advice
  • Guides, ebooks
  • Facts, studies
  • Ideas, strategies

Trigger your readers’ curiosity

Capturing your readers’ attention is no easy task given the average level of online competition that most publishers encounter.

Raise curiosity with your content headline
Source: SmartBlogger

In order to grab your visitors’ attention from the beginning, try to avoid headlines that can easily be answered by “Yes” or “No”.

“Yes and No” headlines are dangerous because they force your visitors to form an opinion about your question or your statement; which will eventually lead to a significant share of visitors choosing not to click.

Here’s a list of formulations used to trigger curiosity:

  • “How to …”
  • “The 7 facts you didn’t know about …”
  • “How [insert_name] managed to [action] in [days]”
  • “The Complete Guide to 
”
  • “What every [target] should know about [subject]”

Watch your competition

There’s no secret for marketing success: practice makes perfect.

Because most businesses typically have dozens of competitors, you should pay attention to your competitors’ headline formulations.

From there, try to identify general trends and success formulas that you could apply to your own content.

Watch headlines used by your competitors

Ideas for effective headlines from the competition can be found in:

  • Newsletters
  • Websites pages and landing pages
  • Product descriptions
  • Ebooks
  • SERPs (Search Engine Result Pages)

Keep them simple and clear

Online visitors and shoppers are over-exposed to marketing messages all day long.

Knowing this, it can be clever to keep your headlines short, simple and clear in order to deliver straightforward information to your potential readers.

Because marketers are always searching for new magic formulas, they sometimes come up with complex, tricky formulations that you should avoid.

Use a headline analyzer

Headlines analyzers are online tools that score your headlines based on a certain number of parameters.

Typically, these tools will grade your headlines on a 100 scale in order to help you craft catchier, better headlines.

They often measure the length and analyze your headline’s structure to determine optimal word order, keyword use, and formulation.

Here are 2 free tools you can use to analyze your headlines:

https://coschedule.com/headline-analyzer
Source: CoSchedule

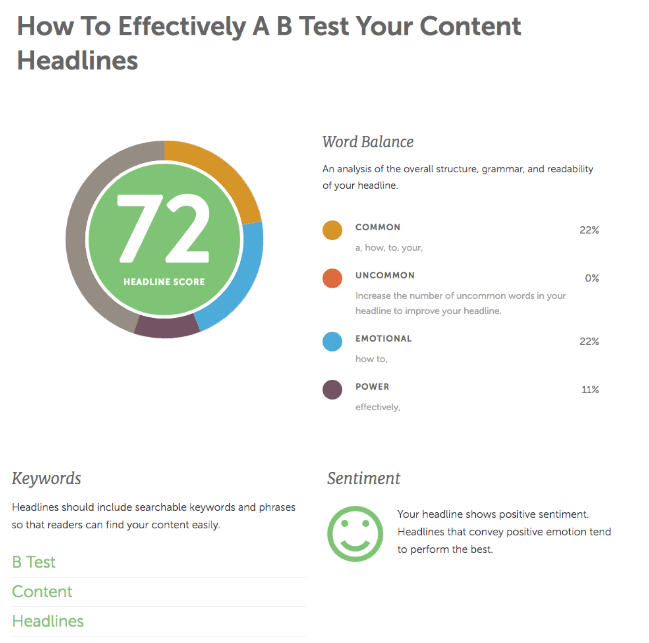
We’ve analyzed our own headline to see what type of results we would get.

Key Takeaway: our headline “How to Effectively A/B Test your Content Headlines” scored a reassuring 72/100 because it contains a power word “effectively” and an emotional element that triggers curiosity “How to…”.

The tool even identified our main keywords, which is a good starter for search engine optimization.

Run A/B tests and compare results

Impact of Headline Testing on Pageviews
Impact of Headline Testing on Pageviews. Source: Priceonomics.com

As you know, headline testing can bring tremendous benefits to your key metrics such as page views, CTR and conversions.

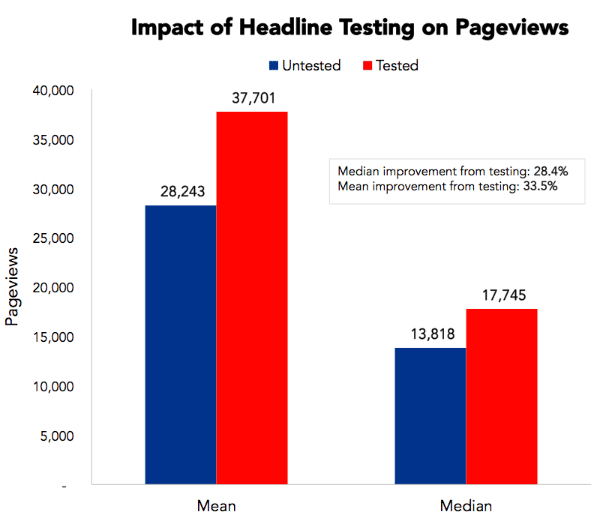
To prove this point, Priceonomics came with an analysis that showed a 33% improvement on pageviews following headline testing: a major improvement that could drastically improve the way visitors behave on your website.

Now that you’ve come across our best practices for headline creation, it’s high time you start testing your own headlines variations to find out the most effective ones.

In order to do so, here’s a little checklist you can follow:

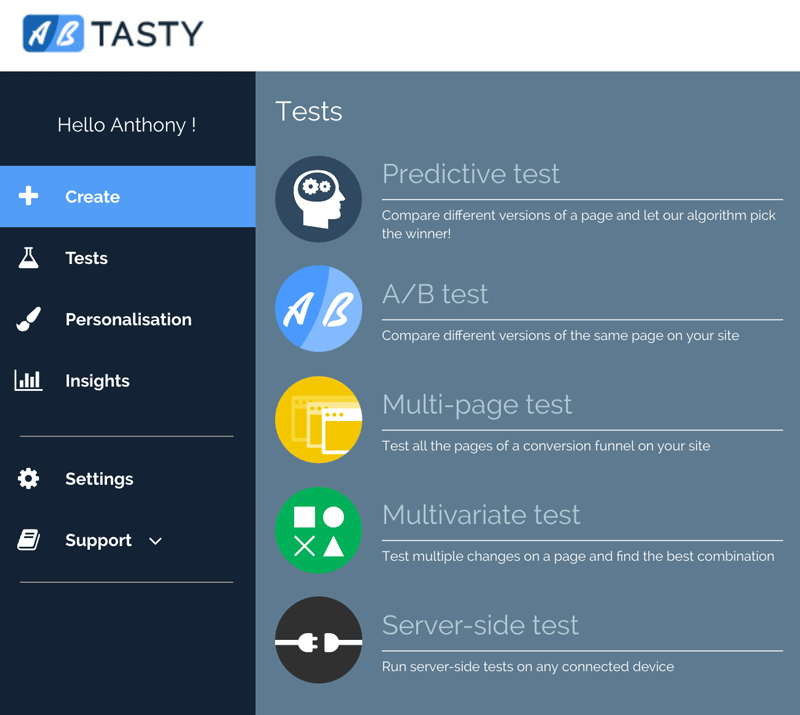
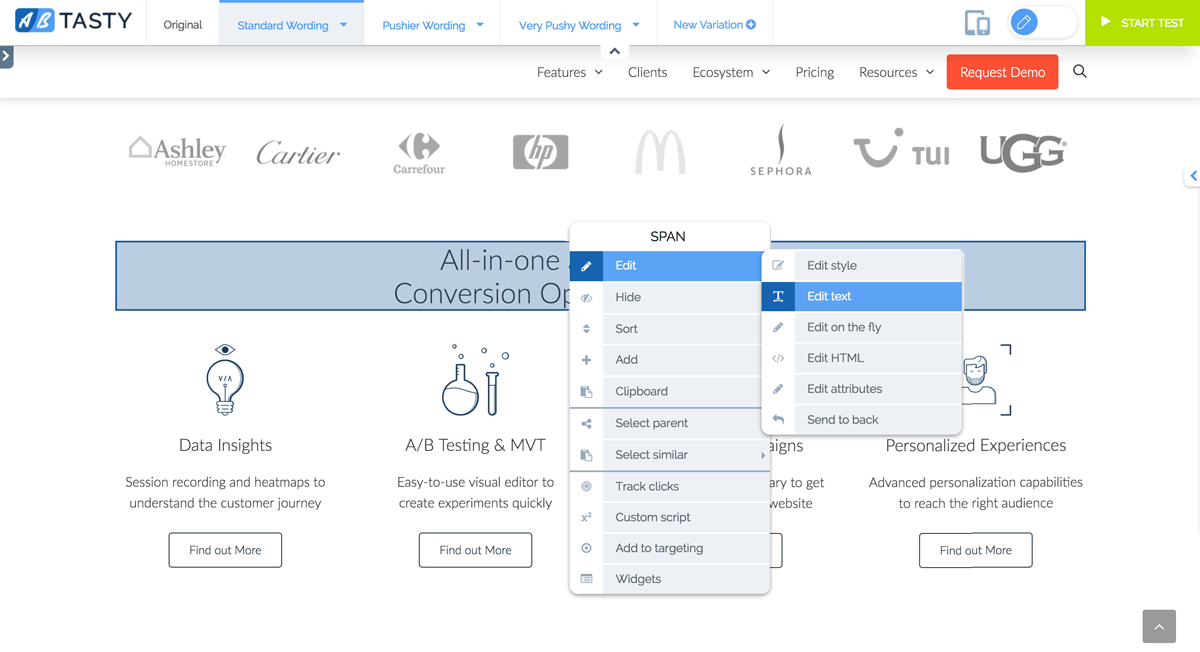
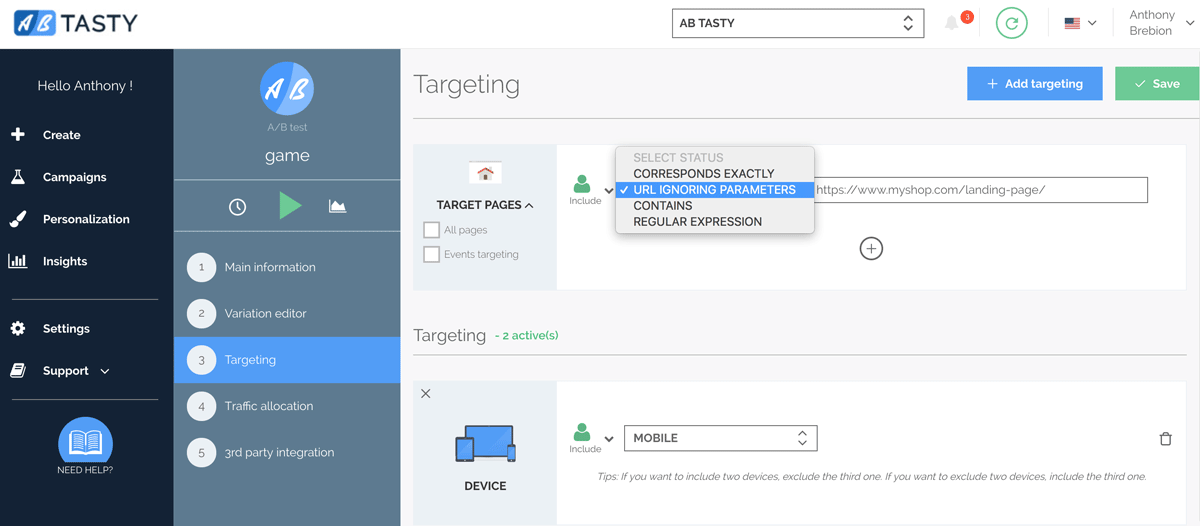
  1. Use our A/B Testing tool to set up your experimental environment
  2. Our WYSIWYG editor makes it easy to test headlines
  3. Start brainstorming headline ideas and formulate hypotheses
  4. Try to run some headline ideas through CoSchedule to measure your chances of success.
  5. Run your tests and collect results
  6. Measure your tests results and track important KPIs to monitor any change

Did you like this article? Feel free to share and check out our other in-depth articles on how to optimize your website, ecommerce and digital marketing.

Article

10min read

A Beginner’s Guide to A/B Testing your Emails

Email marketing is all about maximizing your open, click and response rates while generating as many leads and sales as possible for a given email campaign.

However, in our era of over-saturated email boxes, chances are your prospects won’t actually open your emails as they receive so many.

On average, MailChimp estimates that open rates vary from 18% to 28% depending on the industry concerned. While it’s not catastrophic, it still means that 75% to 80% of your emails will remain… unopened.

Let’s be honest: there is not a single magic formula to craft the perfect email. Otherwise, it would have largely spread over the internet and become overused in a matter of weeks.

The truth is, no one can really guess the perfect email campaign for your company – it will depend on a myriad of factors that we will cover later in this article.

As a consequence, the only way to design and write the most effective emails is to A/B test them.

Not just once, but many times.

By doing so, you’ll vastly increase your chances of uncovering magic tricks that will effectively increase your open, click-through and response rates.

Using email A/B testing, you’ll also discover what actually works on your prospects and how to address them.

Without further ado, let’s begin this guide by answering one simple question:

Why does email A/B testing matter?

Despite being one of the oldest online marketing channels, email marketing remains one of the top performing solutions to reach a broad audience and convert prospects into leads or clients.

More importantly, emailing is a marketing channel that is both:

  • Highly profitable
  • Often affordable
Return on investment of email compared to other channels
Sources: Neil Patel & EmailMarketingGold

As you can see, email marketing returns an average of $40 for every dollar spent, which is a massive improvement compared to display campaigns or banner ads for instance.

Knowing that email marketing is profitable, let’s see how email A/B testing will truly help your business:

It will improve your open and click-through rates

After a few A/B tests, your company should start to identify trends and common factors that lead to higher open and click-through rates.

This means that you will get more views but also more clicks to your website or online forms, which leads us to our second point.

It will increase conversions and generate revenues

Using a marketing automation software, you will be able to analyze your funnel and traffic sources, which is crucial to identifying how many opened emails actually resulted in leads or sales.

Knowing that, you will get a precise estimation of your email marketing ROI, which is a good start to further increase conversions and revenues.

From there, it’s up to you to conduct additional tests on your email campaigns in order to generate more revenues.

You will know what works for your audience

As we said in our introduction, not all industries are identical when it comes to email statistics.

Meanwhile, your prospects most likely have special needs and questions that need to be addressed in a specific way – which most marketers won’t be able to do on the first try.

After you’ve conducted a few conclusive tests, you’ll soon discover major differentiating factors that will account for your future email marketing campaigns success.

Using A/B tests, you’ll be able to craft tailor-made emails that will fit your prospects and generate more engagement.

You will save time and money

Although email marketing isn’t the most expensive online channel, it does cost a significant amount of money to send emails to a large audience and create adapted visuals, landing pages and forms.

Using email A/B tests, you’ll save time and money by quickly identifying the recipe for success in your given industry and by implementing incremental changes that will lead to better results.

What elements should I A/B test first in my emails?

At this point, you’re probably wondering how to set up a proper email A/B test and start gaining insights on what works and what doesn’t.

In order to help you do so, we’ve prepared a list of the 8 most important elements that could lead to significant improvements for your email campaigns.

Ready?

Subject & Preheader

A/B test email subject & preheader

Subjects lines and preheaders form the only touch point before an email is opened.

Therefore, they’re highly valuable items that require extensive attention despite their size.

Remember: your headlines and preheaders will determine whether or not your emails will be opened.

On average, optimal length for email subject lines is around 60-70 characters, no more.

You could try to tweak several parameters for your subject lines, including:

  • Word order (try reversing the order)
  • Tone (neutral, friendly, provocative)
  • Length (try shorter, try longer)
  • Personalization (try including their first name)

When it comes to preheaders, they’re usually pulled from the first line of your email. But as your email marketing senses sharpen, you could try to create intentional preheaders that most emailing tools now support.

If you can create your own preheaders, try to write complementary information and add relevant words that could trigger your prospects’ curiosity.

Different days and hours

For various reasons, email campaigns don’t perform the same depending on when you send them.

For starters, you could try to send emails on different days of the week: GetResponse reports that Tuesdays get the best open rates compared to the rest of the week, although the gap is relatively small (19.9% for Tuesdays compared to 16.9 on Saturdays).

Because studies can be biased and cultural differences can change this data, it’s important that you try different days in order to find what works best for your company.

Likewise, there are studies like MailChimp’s and HubSpot’s that tend to show a particular trend for optimal sending time around 10am to 11am.

Optimal sending time for your email campaigns
Source: MailChimp

Knowing this, you could try to adjust your campaign around different hours of the day just to see if one performs better than the others.

Length

The length of your email’s body can have a significant impact on your readers’ behavior, depending on what they have been used to.

With several studies all reporting serious decreases in our attention span, it may be worth deleting one or two paragraphs just to see if your email performs better.

One general piece of advice is to be straightforward and cut out the unnecessary, overused commercial taglines.

Of course, your emails’ ideal body length will mostly depend on your prospects’ expectations and your industry’s emailing practices.

In the fashion industry, the trend is moving towards flashy, punchy visuals with minimal copy that often features a very basic call-to-action.

On the contrary, B2B emails can purposely be long and feature bullet lists as well as multiple call-to-actions.

Visuals

Since our brain just loves visuals (read full study here), adding engaging visuals to your emails can be a very powerful tool to generate more engagement from your readers.

Add engaging visuals to your emails campaigns
House of Fraser, source: PiktoChart

Similarly to body length, visuals won’t show the same efficiency in all industries.

In fact, adding too many visuals can distract readers from the core message which often leads to having your call-to-actions ignored.

If you want to get a clear idea on whether or not images are adapted to your email marketing efforts, just try to run a Version A with no visuals (but the same subject line, body and CTAs) versus a Version B that contains visuals: you’ll see which one performs better.

Getting more personal

Adopting a friendlier, more casual tone and copy can often transform the way your readers perceive your email activities.

Using most recent emailing tools, you can dynamically add first and last names inside your emails: this will create a sense of personalization that most people like.

The copy

While there is no secret recipe to writing perfect copy (because it depends on your objectives), try running different versions through A/B tests while only changing the copy: this could lead to tremendous changes for your conversion rate.

If you’ve formulated different hypotheses about your readers’ expectations, create two different copies based on anticipated behaviors and send them to the same mailing list to see which one outperforms the other.

Call-to-actions & buttons

Whether they’re hypertext, images or buttons, your CTAs’ design and copy can have serious consequences on your readers’ likeliness to click them.

If you want to conduct in-depth CTAs A/B testing, try to compare different colors and formats to see if one stands out from the rest.

If that doesn’t deliver statistically significant results, you could try to change your value proposition; i.e the offer behind your call-to-action.

The best practices for email A/B testing

Now that we covered the main elements that can be tested through email A/B testing, let’s have a quick look at the 4 best practices to bear in mind before running email A/B tests.

Having a goal in mind

Defining objectives prior to running any A/B tests is a massive time-saver for any marketer.

In fact, it’s highly important that we as marketers formulate hypotheses based on the data we exploit.

  • You need to increase the open rate: In this case, you should mainly focus on your subject lines and preheaders: these are the two main elements that will affect this metric.
  • You need to increase your click-through-rate, downloads or subscriptions: If you want to increase engagement, then test all body-related content such as the copy, the tone, the visuals and the call-to-actions as they may all trigger an increase in clicks, subscriptions or purchases.

One vs Multiple Variables Testing

When it comes to A/B testing, adding multiple variables in your tests means that you will need an ever-increasing sample size in order to get statistically relevant results.

Besides, comparing two versions with multiple variants each will make it difficult for you to get relevant results as you won’t know which element triggered an increase or a decrease for your key metric.

If you have a small sample size, our general advice is to test one variable at a time.

However, there are cases where you will want to A/B test two completely different versions of your email: you can do so easily as the “winner” could be used for future benchmarks or as a template for your next A/B tests.

Testing at the same time vs testing at different times

Although you can absolutely A/B test your emails based on sending days and hours, try to avoid sending variants at different times: you won’t know if the changes were caused by the time or the email content.

Tracking results and building on your findings

Running email A/B tests makes no sense if you don’t actively track your campaigns results afterwards.

There are 4 main metrics that should you track in order to measure success:

  • Open Rate
  • Click-through Rate
  • Response Rate
  • Subsequent Conversion Rate

For most campaigns, open rates and click-through rates will be your basic performance indicators and you should track any sensible change, be it positive or negative.

On certain campaigns (namely lead generation and ecommerce promotional offers), you’ll also want to actively track the conversion rate associated with your call-to-action.

Simply put, you should track sales or the number of forms completed on your website derived from your email analytics in order to measure your overall return on investment.

In these scenarios, you’ll be tracking real conversions instead of the number of opened emails which will provide you with much more tangible data for your marketing analysis.

Did you like this article? Feel free to share and check out our other in-depth articles on how to optimize your website, ecommerce and digital marketing.

Article

7min read

How to A/B Test Without Jeopardizing your SEO Efforts

A/B testing is an effective way to improve your site’s user experience and its ability to convert users to clients.

While changes made to your site may impact your user’s behavior, they are also seen by search engine crawlers, especially Google. The latter is perfectly capable of interpreting JavaScript, the scripting technology behind a lot of A/B tests.

As A/B testing experts, we are often asked about the impact of A/B testing on our clients’ organic search rankings. If SEO is not taken into account, an A/B testing campaign can impact the visibility of the site, notably for tests based on URL redirects.

This post is a good opportunity to review A/B testing best practices for SEO and help you do what’s best when it comes to optimizing conversions, without jeopardizing your rankings and web traffic.

General SEO recommendations

To start, let’s review some general recommendations from Google.

Google completely accepts A/B testing and even encourages it if it’s geared towards improving user experience. Google also offers its own client-side A/B testing tool (Google Optimize) that uses JavaScript to manipulate the DOM (Document Object Model) to create page variations.

On its blog, Google shares rules to be respected so that its algorithms do not penalize your site. The main rule concerns opening your test to the search engine’s robots, who must navigate on the same version of your pages as your visitors.

So, one of the first best practices for SEO is to not exclude Google’s bot from your A/B tests. Even if your A/B testing solution offers some advanced user-targeting capabilities, like user-agent detection, do not use them to exclude Googlebot.

It is also recommended that you do not display pages that are too different from one another to your users. For one, it will be more difficult to identify which element(s) had a greater impact on the conversion rate. Second, Google may consider the two versions to be different and to interpret that action as a manipulation attempt. Losing ranking may result or, worst case scenario, your site may be completely removed.

Depending on your objectives, the A/B testing setup may differ and each way of doing things can have an impact on SEO.

Best practices for A/B tests with URL redirects

A/B testing using URL redirects, also known as split testing, is one of these methods. Instead of using a WYSIWYG (What You See Is What You Get) editor to design your variation, you redirect users to a completely separate page, often hosted on your site, that has its own URL. Using this method is justified if you have a lot of changes to make on your page; for example, when you want to test a different design or another landing page concept.

This use case is the most prone to error and can have a dramatic impact on your search engine ranking, namely your original page being removed from the Google index, and replaced by your variant page. To avoid this, remember the following points:

  • Never block Google’s bots via your site’s robots.txt file with the Disallow instruction or by adding the noindex command on your alternate pages. The first prevents bots from reading the content of targeted pages, whereas the latter prevents them from adding the pages to Google’s index. It’s a common error, as the site publisher is afraid that the alternate version will appear in results. If you respect the following instructions, there is no reason for your alternate version to “rank” instead of your original version.
  • Place a canonical attribute on the variant page and set the value to the original page. This tells Google the original page is the one it must take into account and offer to internet users. Search engine bots will understand that page B has no added value compared to A, which is the only version to be indexed. In the case of a test on a set of pages (e.g. you want to test 2 product page formats across your catalog), you must set up this matching for each page.
  • Redirect visitors via a 302 or JavaScript redirection, both of which Google interprets as temporary redirects. In other words, the search engine considers it to be a temporary modification of your site and does not modify its index accordingly.
  • When a redirect test is completed, you must put into production the changes that have been shown to be useful. The original page A is then modified to include the new elements that foster conversion. Page B, meanwhile, can either be redirected to page A with a 301 (permanent) or 302 (temporary, if the page will be used for other tests) redirection.

Best practices for standard A/B tests

Applying a JavaScript overlay is by far the most common way to conduct A/B tests. In this case, your variants are no more or less than changes applied on the fly when the page loads into the user’s browser. The A/B testing solution manages the whole process from the JavaScript code interpretation of changes you made via a graphics editor, up to data collection, by randomly assigning users to one of the variants and respecting this assignment throughout the test. In this case, your URLs do not change and changes only occur in the client browser (Chrome, Firefox, Internet Explorer, etc.).

This type of A/B test does not harm your SEO efforts. While Google is perfectly capable of understanding JavaScript code, these changes will not be a problem if you do not try to trick it by showing it an initial content that is very different from that presented to users. Therefore, make sure that:

  • The number of elements called by the overlay is limited given the overall page and that the test does not overhaul the page’s structure or content.
  • The overlays do not delete or hide elements that are important for the page’s ranking and improve its legitimacy in the eyes of Google (text areas, title, images, internal links, etc.).
  • Only run the experiment as long as necessary. Google knows that the time required for a test will vary depending on how much traffic the tested page gets, but says you should avoid running tests for an unnecessarily long time as they may interpret this as an attempt to deceive, especially if you’re serving one content variant to a large percentage of your users.

Tips:
While it’s better to avoid overlay phases that are too heavy on pages generating traffic, you have complete freedom for pages that Google’s bots do not browse or that do not have an SEO benefit (account or basket pages, purchase tunnel pages, etc.). Don’t hesitate to test new optimizations on these pages that are key to your conversion rate!

What about mobile SEO?

Using your A/B testing solution to improve the user journey on mobile devices is a use case that we sometimes encounter. This is a particularly sensitive point for SEO since Google is rolling out its Mobile First Indexing.

Until now, Google’s ranking algorithm was based primarily on the content of a site’s desktop version to position it in both desktop and mobile search results. With the Mobile First Indexing algorithm, Google is switching this logic around: the search engine will now use the mobile page’s content as a ranking signal rather than the desktop version, no matter what the device.

Therefore, it’s particularly important to not remove from mobile navigation – for UX reasons – elements that are vital to SEO, like, for example, removing page-top content that takes up too much space on a smartphone.

Can personalization impact your SEO?

Some A/B testing tools also offer user personalization capabilities. AB Tasty, for example, helps you boost user engagement via custom scenarios. Depending on your visitors’ profile or their journeys on your website, you can easily offer them messages or a personalized browsing experience that is more likely to help them convert.

Can these practices have an impact on your SEO? Like for A/B tests using JavaScript, impact from SEO is limited but some special cases should be taken into consideration.

For instance, highlighting customized content with an interstitial (pop-in) presents a challenge in terms of SEO, notably on mobile. Since January 2017, Google considers it to be harmful to the user experience since the page’s content is not easily accessible. So personalized interstitials must be adjusted to Google’s expectations. Otherwise, you take the risk of seeing your site lose ranking and the resulting traffic.

Note that Google seems to tolerate legal interstitials that take up a majority of the screen (cookie information, age verification, etc.) for which there is no SEO impact.

To learn more, download your free copy of our A/B testing 101 ebook.

Article

10min read

How to A/B Test your Landing Page: a Step-by-Step Guide

Landing pages are essential tools in your modern marketer’s toolkit.

By driving supposedly qualified visitors – who you carefully targeted on ad networks or through smart traffic acquisition strategies – to a dedicated page that shows you at your best, you increase your chances of converting them into clients or subscribers.

You’ll find numerous resources online about landing pages: how to design them, what are the best practices to follow when creating one, what you should include, what you should avoid


But the truth is that every website has its very personal audience, with its own characteristics, that might be more sensitive to some arguments than to others. What works for your neighbors may not work for you, as they say.

Every website has its very personal audience

The only method to make sure that supposed best practices are working for you is to A/B test them.

As a reminder, A/B testing involves comparing two versions of a landing page, known as variation A and B, to see which performs better. These versions are presented randomly to users and a statistical analysis then determines which one performed better, according to predefined KPIs, such as sign up rate or click-through rate.

Pretty straightforward. But how do you actually A/B test a landing page?

As A/B testing experts, we’ve crafted this checklist to guide you through the process. We’ll use our own A/B testing software to help you visualize each step, but the process is tool agnostic and works, no matter who your vendor is.

Important considerations

Before actually setting up an A/B test, let’s tackle three important considerations.

1. What landing page should you test?

This first consideration may sound like a trivial one, especially if you only have one landing page, but most websites actually use different ones. They may have different offers and products to promote, or they may address different personas, who each have different expectations.

If you have several landing pages and a limited amount of incoming traffic on these pages, the answer is not so obvious. A/B tests take time (not to implement but to collect enough data) and require traffic. In this scenario, you should consider various parameters to select the landing pages you’ll invest in:

  • Is this landing page a strong contributor to your bottom line? (ex: net number of leads or signups)
  • Is there some issue that suggests it can perform better if solved (high bounce rate or exit rate)
  • Does it have decent traffic?

We suggest that you use methods like PIE to prioritize the landing pages that you want to test.

2. What KPI should you look at?

Once again, the answer may sound obvious. If you are promoting a web-based subscription service, like most SaaS companies do (including us :-), your sign up rate is a good candidate.

But what if you don’t attract a lot of new users and don’t get a lot of signups? Let’s say you are running a B2B business and your sales cycle is quite long. Few leads may actually go through the whole process of creating an account.

You may have to optimize for a different type of conversion. It could be micro conversions, that is to say, small steps on the path towards your primary conversion goal (macro conversion). For instance, it could be:

  • Percent of progress in the process (filling partial information like full name and email address).
  • Number of times your demo video is viewed.
  • Page scroll depth.

3. What should I test on my landing page?

This is the most common question we’ve received so far and we’ve got a lot of resources to answer it. Check it out:

Now let’s get started with actually setting up an A/B test on your landing page

1. Install the A/B testing vendor tag on your landing page

Once you’ve created an account with an A/B testing vendor, the first step is to install its JavaScript tag on your page. This simple line of code does all the magic on the client-side (your web browser): it buckets the incoming traffic to the available variations, applies your modifications through JavaScript code and sends data to collect hits to track goals. Example of AB Tasty’s code:

2. Select the type of test to run

Different type of tests to experiment on your landing pages

Most A/B testing tools let you decide on the type of test to run: standard A/B test, split test with URL redirect, multivariate test. To learn more about how to choose between these options, refer to this article.

As shown in the AB Tasty interface, you can also run server-side A/B testing which is a completely different approach used to experiment with product features, deeply tied to your back office.

3. Load the landing page inside the WYSIWYG editor

If you are a marketer and want to design your landing page variations on your own, select ‘A/B’ test during the previous step, specify the URL of the original page and just hit enter. All its content is now loaded in a graphics editor (drag and drop) for you to play with.

Edit your landing page in a WYSIWYG builder

4. Craft your landing page variations

All A/B testing tools allow for the creation of several variations per page. Create as many as you want but keep in mind that the more you have, the more traffic you’ll need to reach statistical significance (more on that later). With almost any tool, you can live edit text and styles, reorder blocks, change images, adjust element position, hide content… There are a lot of options to modify your page as you like. If you think you’ve reached a brick wall, there is still the option to edit/add custom CSS and JavaScript code.

How to setup a click tracking on a A/B test

5. Setup your goal tracking

Setting up your goals and KPIs is usually a breeze. To track CTR (click-through rates), simply point and click on the call to action to track and select the appropriate menu option. If the conversion takes place on a different page, like on a confirmation page, just enter its URL. Bonus: You can track several goals inside the same test and create advanced goals like funnel conversions or scroll page rate.

6. Setup your landing page targeting (URL targeting)

While this step may not be required if you only have one landing page and one URL, in some rare cases, you may want to extend your default targeting – the URL you specify at step 3 – to include some variants, like URL with additional tracking parameters – do utm or gclid parameters sound familiar? ;-). If your test applies the same modification on completely different pages, you can use this targeting expansion feature as well.

URL targeting during an A/B test setup

7. Narrow down your audience if necessary (audience targeting)

This step may be the most important of them all. Remember the whole purpose of a landing page? It’s to direct visitors to the page that best meets their expectations. And as you know, we all have different needs. What if you could craft a personalized landing page for your users based on what you know about their profile or characteristics (source, geolocation, cookies and much more)? This personalization feature is part of many A/B testing tools.

Target your A/B test on different user profiles

In this screenshot, you can see some of AB Tasty’s targeting options (here is the full list in case you’re wondering).

8. Select the percentage of traffic to be part of the test

By default, with 2 variations, each should get 50% of the total incoming traffic. But with most tools, you can specify a different allocation. A concrete use case would be a very sensitive test for which you don’t want to expose all your landing page traffic. You may set only 25% to see variation A, 25% variation B, leaving the remaining 50% untracked (they will see the original page).

Allocate a specific percentage of your landing page traffic to your A/B test

9. Connect with third-party tools

This step is also optional. You can send to other tools, like Google Analytics, the information regarding the test and the variation a user has been exposed to. This way, you can use any type of reporting tools to read your data.

Connetc your A/B test to third party tools

10. Review and acceptance test

Before you launch this A/B test on your landing page, take some time to verify how it renders in different environments, such as mobile website and different screen sizes. A/B testing solutions make it easy to debug tests on your landing pages with some neat features like a responsive editor and mobile previews. At AB Tasty, we’ve even developed a smart QR code feature to quickly launch your modified landing page on any mobile browser.

11. Launch and sit back

Congrats, you made it! It was not that complex with the right method and the appropriate tool for the job. After you click the play button, you’ll have to wait until you get enough data to properly analyze the results. That’s the next step.

12. Interpret results

This step is certainly the trickiest one. Until now, you felt pretty confident, because setting up the changes was easy. But as soon as we start talking about statistical significance, confidence interval or type I and type II errors, you’re not showing off anymore 😉

Fortunately, A/B testing vendors made a lot of progress to make the analysis easy for you. In the next screenshot, AB Tasty reports on the expected gain for your test. In this scenario, it may be that the variation offers very small uplift, but it is also possible that the absolute gain may reach as high as 136%. The remaining scenarios (gain < 2.8% or gain >136 %) have only a 5% chance of occurring.

13. Implement changes if you detect a winner

Once you’ve identified a winner, like in the scenario above, you can stop your A/B test and ask your technical team to hard code the changes on your landing pages. Using your A/B testing tool to permanently deliver hotfixes is not a sustainable solution and we recommend stopping your test as soon as you can.

14. Start again

There is always room for improvement and you probably just reached a local maximum. You should definitely keep A/B testing your landing pages. Remember that conversion rate optimization is a test and learn approach and that you should iterate for continuous improvements.

Still have some questions? Want to know more about how much you can change your landing pages? Contact us for a customized demo of our A/B testing solution.

Article

4min read

The Pros and Cons of Multivariate Tests

Wait! New to multivariate testing? If so, we recommend you first read our article, Multivariate Testing: All you need to know about multivariate testing


During an A/B test, you must only modify one element at a time (for example, the wording of an action button) to be able to determine the impact. If you simultaneously change this button’s wording and color (for example, a blue “Buy” button vs. red “Purchase” button) and see an improvement, how do you know which of the wording or the color changes really contributed to this result? The contribution of one may be negligible, or the two may have contributed equally.

The benefits of multivariate tests

A multivariate test aims to answer this question. With this type of experiment, you test a hypothesis for which several variables are modified and determine which is the best combination of all possible ones. If you change two variables and each has three possibilities, you have nine combinations between which to decide (number of variants of the first variable X number of possibilities of the second).

Multivariate testing has three benefits:

  • avoid having to conduct several A/B tests one after the other, saving you time since we can look at a multivariate test as several A/B tests conducted simultaneously on the same page,
  • determine the contribution of each variable to the measured gains,
  • measure the interaction effects between several supposedly independent elements (for example, page title and visual illustration).

Types of multivariate tests

There are two major methods for conducting multivariate tests:

  • Full Factorial“: this is the method that is usually referred to as multivariate testing. With this method, all combinations of variables are designed and tested on an equal part of your traffic. If you test two variants for one element and three variants for another, each of the six combinations will be assigned to 16.66% of your traffic.
  • Fractional Factorial“: as its name suggests, only a fraction of all combinations is actually subjected to your traffic. The conversion rate of untested combinations is statistically deduced based on that of those actually tested. This method has the disadvantage of being less precise but requires less traffic.

While multivariate testing seems to be a panacea, you should be aware of several limitations that, in practice, limit its appeal in specific cases.

Limits of multivariate tests

The first limit concerns the volume of visitors to subject to your test to obtain usable results. By multiplying the number of variables and possibilities tested, you can quickly reach a significant number of combinations. The sample assigned to each combination will be reduced mechanically. Where, for a typical A/B test, you are allocating 50% of your traffic to the original and the variant, you are only allocating 5, 10, or 15% of your traffic to each combination in a multivariate test. In practice, this often translates into longer tests and an inability to achieve the statistical reliability needed for decision-making. This is especially true if you are testing deeper pages with lower traffic, which is often the case if you test command tunnels or landing pages for traffic acquisition campaigns.

The second disadvantage is related to the way the multivariate test is brought into consideration. In some cases, it is the result of an admission of weakness: users do not know exactly what to test and think that by testing several things at once, they will find something to use. We often find small modifications at work in these tests. A/B testing, on the other hand, imposes greater rigor and better identification of test hypotheses, which generally leads to more creative tests supported by data and with better results.

The third disadvantage is related to complexity. Conducting an A/B test is much simpler, especially in the analysis of the results. You do not need to perform complex mental gymnastics to try to understand why one element interacts positively with another in one case and not in another. Keeping a process simple and fast to execute allows you to be more confident and quickly iterate your optimization ideas.

Conclusion

While multivariate tests are attractive on paper, note that carrying out tests for too long only to obtain weak statistical reliability can make them a less attractive option in some cases. In order to obtain actionable results that can be quickly identified, in 90% of cases, it is better to stick to traditional A/B tests (or A/B/C/D). This is the ratio found among our customers, including those with an audience of hundreds of thousands or even millions of visitors. The remaining 10% of tests are better reserved for fine-tuning when you are comfortable with the testing practice, have achieved significant gains through your A/B tests, and are looking to exceed certain conversion thresholds or to gain a few increments.

Finally, it is always helpful to remember that, more than the type of test (A/B vs. multivariate), it is the quality of your hypotheses – and by extension that of your work of understanding conversion problems – which will be the determining factor in getting boosts and convincing results from your testing activity.

Article

5min read

A/A Testing: A Waste of Time or Useful Best Practice?

A/A TestingA/A testing is little known and subject to strong discussions on its usefulness, but it brings added value for those who are looking to integrate an A/B testing software with rigor and precision.

But before we begin…

What is A/A testing?

A/A testing is a derivative of A/B testing (check out A/B testing definition). However, instead of comparing two different versions (of your homepage, for example), here we compare two identical versions.

Two identical versions? Yes!

The main purpose of A/A testing is simple: verify that the A/B testing solution has been correctly configured and is effective.

We use A/A testing in three cases:

  • To check that an A/B testing tool is accurate
  • To set a conversion rate as reference for future tests
  • To decide on an optimal sample size for A/B tests

Checking the accuracy of the A/B Testing tool

When performing an A/A test, we compare two strictly identical versions of the same page.

Of course, the purpose of an A/A test is to display similar values in terms of conversion. The idea here is to prove that the test solution is effective.

Logically, we will organize an A/A test when we set up a new A/B test solution or when we go from one solution to another.

However, sometimes a “winner” is declared on two identical versions. Therefore, we must seek to understand “why” and this is the benefit of A/A testing.

  • The test may not have been conducted correctly
  • The tool may not have been configured correctly
  • The A/B testing solution may not be effective.

Setting a reference conversion rate

Let’s imagine that you want to set up a series of A/B tests on your homepage. You set up the solution but a problem arises: you do not know to which conversion rate to compare the different versions to.

In this case, an A/A Test will help you find the “reference” conversion rate for your future A/B tests.

For example, you begin an A/A Test on your homepage where the goal is to fill out a contact form. When comparing the results, you get nearly identical results (and this is normal): 5.01% and 5.05% conversions. You can now use this data with the certainty that it truly represents your conversion rate and activate your A/B tests to try to exceed this rate. If your A/B tests tell you that a “better” variant achieves 5.05% conversion, it actually means that there is no progress.

Finding a sample size for future tests

The problem in comparing two similar versions is the “luck” factor.

Since the tests are formulated on a statistical basis, there is a margin of error that can influence the results of your A/B testing campaigns.

It’s no secret how to reduce this margin of error: you have to increase the sample size to reduce the risk that random factors (so-called “luck”) skew the results.

By performing an A/A test, you can “see” at what sample size the test solution comes closest to “perfect equality” between your identical versions.

In short, an A/A test allows you to find the sample size at which the “luck” factor is minimized; you can then use that sample size for your future A/B tests. That said, A/B tests generally require a smaller sample size.

A/A testing: a waste of time?

The question is hotly debated in the field of A/B Testing: should we take the time to do an A/A test before doing an A/B test?

And that is the heart of the issue: time.

Performing A/A tests takes considerable time and traffic

In fact, performing A/A tests takes time, considerably more time than A/B tests since the volume of traffic needed to prove that the two “identical variants” lead to the same conversion rate is significant.

The problem, according to ConversionXL, is that A/A testing is time-consuming and encroaches on traffic that could be used to conduct “real tests,” i.e., those intended to compare two variants.

Finally, A/A testing is much easier to set up on high traffic sites.

The idea is that if you run a site that is being launched or has low traffic, it is useless to waste your time doing an A/A test: focus instead on optimizing your purchase tunnel or on your Customer Lifetime Value: the results will be much more convincing and, especially, must more interesting.

An interesting alternative: data comparison

To check the accuracy of your A/B Testing solution, there is another way that is easy to set up. To do this, your A/B Testing solution needs to integrate another source of analytic data.

By doing this, you can compare the data and see if it points to the same result: it’s another way to check the effectiveness of your test solution.

If you notice significant differences in data between the two sources, you know that one of them is:

  • Either poorly configured,
  • Or ineffective and must be changed.

Did you like this article? We would love to talk to you more about it.

Article

8min read

Client and Server-Side A/B Testing – The Best of Both Worlds

We’re enriching our conversion rate optimization platform with a server-side A/B testing solution. What is server-side A/B testing, you ask? It’s the subject of an announcement of ours that will make anybody who’s passionate about experimentation pretty excited…because it means they can now test any hypothesis on any device.

No matter if you want to test visual modifications suggested by your marketing team or advanced modifications tied to your back office that are essential in the decision-making process of your product team, we’ve got the right tool for you.

What’s the difference between A/B testing client-side, and A/B testing server-side?

Client-side A/B testing tools help you create variations of your pages by changing the content sent by your server to internet users in the web browser. So, all the magic happens at the level of the web browser (called ‘client’ in the IT world), thanks to JavaScript. Your server is never called, and never intervenes in this process: it still sends the same content to the internet user.

Server-side A/B testing tools, on the other hand, offload all of this work from the web browser. In this case, it’s your server that takes on the task of randomly sending the internet user a modified version.

4 reasons to A/B test, server-side

Running an A/B test server-side has many advantages.

1. Dedicated to the needs of your product team

Client-side A/B testing is often limited to surface-level modifications. These refer to visual aspects, like the page’s organization, adding or deleting of blocks of content or modifying text. If you’re interested in deeper-level modifications related to your back office – for example, reorganizing your purchase funnel, or the results of your search or product sorting algorithm – it’s a bit more complicated.

With server-side testing, you have a lot more options to work with, since you can modify all aspects of your site, whether front-end or back-end. With server-side testing, you have a lot more options to work with, since you can modify all aspects of your site, whether front-end or back-end.

All of this is possible because you remain in control of the content sent by your server to your website visitors. Your product team will be overjoyed since they’ll gain an enormous amount of flexibility. They can now test all kinds of features and benefit from a truly data-driven approach, to make better decisions. The price of this increased flexibility is the fact that server-side testing requires your IT team to get involved in order to implement modifications. We’ll get back to this later.

Your product team will be overjoyed to test all kinds of features

2. Better performance

Poor performance – loading time or the flickering effect – is often the first criticism made about client-side A/B testing solutions.

In the most extreme cases, some sites only add the JavaScript tag to the footer of the page to avoid any potential impact on their technical performance. This policy automatically means excluding using any client-side A/B testing tools, since a ‘footer’ tag is often synonymous with flickering effect.

When using a server-side A/B testing tool, you don’t have any JavaScript tag to insert on your pages, and you’re in control of any potential performance bottlenecks. You also remain responsible for your company’s security policy and the adherence to internal technical procedure.

3. Adapted to your business’s rules

In some cases, your A/B test might be limited to design-related modifications, but you have to deal with profession-specific constraints that make it difficult to interpret a classic A/B test.

For example, an e-commerce merchant might understandably wish to take into account canceled orders in their results, or else exclude highly unusual orders which skew their stats (the notion of outliers).

With a client-side A/B test, a conversion is counted as soon as it occurs on the web browser side when the purchase confirmation page loads or a transaction event type is triggered. With a server-side A/B test, you remain in complete control of what is taken into account, and you can, for example, exclude in real time certain conversions or register others after the fact, by batch. You can also optimize for more long-term goals like customer lifetime value (LTV).

4. New omnichannel opportunities

Server-side A/B testing is inseparably linked to omni-channel and multi-devices strategies.

With a client-side solution – which relies on JavaScript and cookies – your playing field is limited to devices that have a web browser, whether it’s on desktop, tablet or mobile. It’s therefore impossible to A/B test on native mobile apps (iOS or Android) or on connected objects, those that already exist and those still yet to come.

On the other hand, with a server-side solution, as soon as you can match up the identity of a consumer, whatever the device used, you can deploy A/B tests or omnichannel personalization campaigns as part of a unified client journey. Your playing field just got a lot bigger 🙂 and the opportunities are numerous. Think connected objects, TV apps, chatbots, beacons, digital stores…

Use cases for server-side A/B testing

Now, you’re probably wondering what you can concretely test with a server-side solution that you couldn’t test with a client-side tool?

Download our presentation: “10 Examples of Server-side Tests That You Can’t do With a Client-side Solution”

Included are tests for sign up forms, tests for order funnels, tests for research algorithms, feature tests…

How can you put in place a server-side A/B test?

To put a server-side A/B test in place, you’ll need to use our API. We’ve described below in general terms how it works. For more information, you can contact our support team, who can give you the complete technical documentation.

When an internet user lands on your site, the first step is to call our API to get a unique visitor ID from AB Tasty, which you then store (ex: cookie, session storage). If a visitor already has an ID from another visit, you’ll use this one instead.

On pages where a test needs to be triggered, you’ll then call our API passing in parameters the visitor ID mentioned above and the ID of the test in question. This test ID is accessible from our interface when you create the test.

As a response to your API request, AB Tasty sends the variation ID to be displayed. Your server then needs to build its response based on this variation ID. Lastly, you need to inform our data servers as soon as a conversion takes place, by calling the API with the visitor ID, and data relevant to the conversion, like its type (action tracking, transaction, custom event
) and/or its value.

Don’t hesitate to use our expertise to analyze and optimize your test results thanks to our dynamic traffic allocation algorithms, which tackle the so-called ‘multi-armed bandit’ issue.

As you’ve seen, putting in place a server-side A/B test absolutely requires involvement from your tech team and a change in your work routine.

While client-side A/B testing is often managed and centralized by your marketing team, server-side A/B testing is decentralized at the product team or project level. While client-side A/B testing is often managed and centralized by your marketing team, server-side A/B testing is decentralized at the product team or project level.

Should you stop using client-side A/B tests?

The answer is no. Client and server-side A/B testing aren’t contradictory, they’re complementary. The highest performing businesses use both in tandem according to their needs and the teams involved.

  • Client-side A/B testing is easy to start using, and ideal for marketing teams that want to stay autonomous and not involve their head of IT. The keyword here is AGILITY. You can quickly test a lot of ideas.
  • Server-side A/B testing is more oriented towards product teams, whose needs involve more business rules and which are tightly linked to product features. The keyword here is FLEXIBILITY.

By offering you the best of both worlds, AB Tasty become an indispensable partner for all of your testing and data-driven, decision-making needs.

Don’t hesitate to get in touch to discuss your testing projects – even the craziest ones!

Article

6min read

How to Avoid Flickering in A/B Tests

Flickering, also called FOOC (Flash of Original Content) is when an original page is briefly displayed before the alternative appears during an A/B test. This happens due to the time it takes for the browser to process modifications. There is no miracle fix to this problem, and those claiming to be quick fixes have limited effectiveness. The good news is that there are several best practices to accelerate the application of your modifications, effectively masking the flickering effect.

Update: to get rid of flickering, you can switch from Client-Side testing to Server-Side testing. The latter doesn’t involve any kind of Javascript to apply modifications on your pages and completely removes the FOOC. Read more about this feature now available within AB Tasty.

What is flickering, exactly?

Although you may have never heard of flickering, you have undoubtedly experienced it without even knowing: a test page loads and, after a few milliseconds, your modifications show up. In the blink of an eye, you’ve seen two versions of your page—the old and the new. The result is poor user experience, not to mention that your users now know your test is just that: a test.

Flickering is caused by the basic client-side operation of A/B testing solutions that apply a JavaScript overlayer during page loading to ensure elements are modified. In most cases, you will not notice it at all, but if your site takes a while to load or relies on intensive external resources, your modifications can take time to be applied, giving way to a previously unnoticeable flickering.

Is there a miracle cure for flickering?

Some providers claim to use innovative techniques that get rid of flickering. Beware, however, that although the techniques they use are commonplace and available to anyone, they present a certain number of technical limits. By analyzing market leaders’ documentation, it is also clear that such “miracle” methods are only implemented as a last resort, when no other options have worked for a lasting period of time. This is because flickering can be different for each site and depends a great deal on initial performance.

So how does the method work? For starters, displayed content is temporarily masked using CSS properties such as visibility: hidden or display: none for the body element. This property masks page content as quickly as possible (since the solution’s tag is located in the page’s <head> element), before redisplaying it again once the modifications have had enough time to be applied. This effectively eliminates the “before/after” flicker effect, but replaces it with a “blank page/after” effect.

The risk of using such a method is that if the page encounters any loading problems or there are implementation problems, users might end up with a blank page for a few seconds, or they could even be stuck with a blank screen with nowhere to click. Another drawback of this solution is that it gives off the impression that site performance is slow. That’s why it is important to ensure that rendering is not delayed for more than a few milliseconds at most—just enough for the modifications to be applied. And of course, for valid results, you’ll need to apply this delayed rendering to a control group to prevent bias in your analysis of behaviors linked to the various rendering speeds.

So there you have it. If your modifications take time to apply, you won’t want a blank page to greet your users. When it comes down to it, you should always adhere to the best practices listed below. Among other things, they aim to ensure modifications are applied at an accelerated rate.

That’s why we here at AB Tasty don’t recommend the above method for most of our users and why we don’t suggest it by default. Nonetheless, it is easy to implement with just a few lines of JavaScript.

How can flickering be limited?

If you don’t want to use the aforementioned method, what are your options? Here are some best practices you can use to reduce flickering and maybe even eliminate it:

  • Optimize your site’s loading time by all means possible: page caching, compression, image optimization, CDNs, parallel query processing with the HTTP/2 protocol, etc.
  • Place the A/B testing solution tag as high as possible in the source code, inside the <head> element and before intensive external resources (e.g. web fonts, JavaScript libraries, etc.) are called.
  • Use the synchronous version of the AB Tasty script, since the asynchronous version increases flickering odds
  • Don’t use a tag manager to call your solution’s tags (e.g. Google Tag Manager). This might not be as convenient, but you’ll have an easier handle on your tag’s firing priority.
  • Do not insert a jQuery library in the tag if your site provider already uses one. Most client-side A/B testing solutions use jQuery. AB Tasty nonetheless makes it so you don’t have to integrate the infamous JavaScript framework if you already use it elsewhere, so you can cross a few kb off your transfer list.
  • Reduce the size of your solution’s script by removing inactive tests. Some solutions include the entirety of your tests in their script, whether they are suspended or in draft mode. AB Tasty includes only active tests by default. If, however, you have a high number of ongoing customizations, it might be appropriate to make them permanently operational and deactivate them on AB Tasty.
  • Pay attention to the nature of modifications. Adding several hundred lines of code to obtain your modification will cause more flickering than a minor change to CSS styles or wording.
  • Rely as much as possible on style sheets. It is usually possible to obtain the desired visual effect using style sheets. For example, you can simply implement a JavaScript instruction that adds a CSS class to an element, letting the class modify its aspect, rather than writing lines of script to manipulate its style.
  • Optimize your modified code. When fiddling around with the WYSIWYG editor to try and implement your changes, you may add several unnecessary JavaScript instructions. Quickly analyze the generated code in the “Edit Code” tab and optimize it by rearranging it or removing needless parts.
  • Ensure that your chosen solution uses one (or many) CDNs so the script containing your modifications can be loaded as quickly as possible, wherever your user is located.
  • For advanced users: Add jQuery selectors to the cache as objects so they don’t need to be reorganized in the DOM multiple times. You can also make modifications in JavaScript rather than in jQuery, particularly when dealing with elements by class or ID.
  • Use redirect tests where possible and if useful after an evaluation of the relation between the modification’s nature and the time required to put the test into place.

If you still see flickering after performing these optimizations, you may want to use the content-masking technique detailed above. If you’re not comfortable doing this alone, contact our support team.

Article

6min read

What Does a Data Scientist Think of Google Optimize?

Note: This article was written by Hubert Wassner, Chief Data Scientist at AB Tasty.

Some of you may have noticed Google’s recent release of a free version of Google Optimize and asked yourselves if it will change the market for SaaS A/B testing tools, such as AB Tasty?

Well, history tells us that when Google enters a market, the effects are often disruptive – especially when the tool is free, like with Google Analytics or Google Tag Manager. To be clear, this new offer will be a free version of Google Optimise, with the premium version starting at around $150,000 per year. Also, note that neither the free nor the paid-for version of Google Optimize offer multi-page testing (i.e. test consistency across a funnel for example) and that Google Optimise is not compatible with native applications.

Before going any further, a disclaimer: I’m the chief data scientist at AB Tasty, the leading European solution for A/B testing and personalization and, therefore, in direct competition with Google Optimize. Nevertheless, I’ll do my best to be fair in the following comparison. I’m not going to list and compare all features offered by the two tools. Rather, I’d like to focus on the data side of things – I’m a data scientist after all..!

Let’s dig into it:

To me, Google Optimize’s first and main limitation is that it is based on Google Analytics’ infrastructure and thus doesn’t take the notion of visitor unicity into account. Google looks at sessions. By default, a session duration is fixed to 30 minutes and can be extended to up to 4 hours only. This means that if a visitor visits a website twice with one day between, or visits first in the morning and a second time in the evening, Google Analytics will log 2 different visitors.

This way of counting has two immediate consequences:

  • Conversion rates are much lower than they should be. Perhaps, a little annoying, but we can deal with it
  • Gains are much more difficult to measure. Now, this is a real issue!

Let’s have a closer look


Conversion rates are much lower

People will normally visit a website several times before converting. For one conversion, Google Analytics (and by extension Google Optimize) records several different sessions. Only the visit during which the visitor converted is recorded as a ‘success’. All the others are considered ‘failures’. Consequently, the success rate is lower as the denominator grows. For Google, conversion rate is based on visits instead of visitors.

You can put up with this limitation if you make decisions based on relative values instead of absolute values. After all, the objective of testing is first and foremost to gauge the difference, whatever the exact value. The Bayesian model for statistics used by Google Optimize (and AB Tasty) does this very well.

Say 100 visitors saw each variation, 10 converted on A and 15 on B.

screenshot1

Based on these hypotheses, variation A is 14% more likely to be best. The rate reaches 86% for variation B.

Now say that the above conversions occur after 2 visits on average. It doubles the number of trials and simulates a conversion rate by session instead of visitor.

screenshot2

Results are very similar as there is just a 1% difference between the two experiments. So, if the goal is to see if there is a significant difference between two variations (but not the size of the difference), then taking the session as reference value works just fine.

NB: This conclusion stays true as long as the number of visits per unique visitor is stable across all variations – which is not certain.

It’s impossible to measure confidence intervals for gain with the session approach

Confidence intervals for gain are crucial when interpreting results and in making sound decisions. They predict worst and best case scenarios that could occur once changes are no longer in a test environment.

Here is another tool, also based on Bayesian statistics, that illustrates potential gain distribution: https://making.lyst.com/bayesian-calculator/

See results below for the same sample as previously:

  • 100 visits, 10 successes on variation A
  • 100 visits, 15 successes on variation B

graph1

This curve shows the probability distribution of the real value of the gain linked to variation B.

The 95% confidence interval is [ – 0.05; +0.15 ], which means that with a 95% confidence rate, the actual value of the gain is above -0.05 and below +0.15.

The interval being globally positive, we can draw the same conclusion as previously: B is probably the winning variation but there are doubts.

Now let’s say that there are 2 visits before conversion on average. The number of trials is doubled, like previously – this is the kind of data Google Optimize would have.

Here is the curve showing the probability distribution of the real value of the gain.

graph2

This distribution is much narrower than the other, and the confidence interval is much smaller: [ – 0.025; 0.08 ]. It gives the impression that it’s more precise – but as the sample is the exact same, it’s not! The bigger the number of sessions before conversion, the more striking this effect would be.

The root of the problem is that the number of sessions for a unique visitor is unknown and varies between segments, business models and industries. Calculating a confidence interval is, therefore, impossible – although it’s essential we draw accurate conclusions.

To conclude, the session-based approach promises to identify which variation is best but doesn’t help estimate gain. To me, this is highly limiting.

Then, why has Google made this (bad) choice?

To track a visitor over multiple sessions, Google would have to store the information server-side, and it would represent a huge amount of data. Given that Google Analytics is free, it is very likely that they try to save as much storage space as they can. Google Optimize is based on Google Analytics, so it’s no surprise they made the same decision for Google Optimize. We shouldn’t expect this to change anytime soon.

I’d say Google Optimize is very likely to gain substantial market share with small websites. Just as they chose Google Analytics, they will go for Google Optimize and gratuity. More mature websites tend to see conversion rate optimization as a game changer and generally prefer technology that can provide more accuracy – results based on unique visitors, real customers.

Overall, the introduction of Google Optimize represents a great opportunity for the market as a whole. As the tool is free, it will likely speed up awareness and optimization skills across the digital industry. Perhaps even the general understanding of statistics will increase! As marketers put tests in place and realize results don’t always follow outside the testing environment, they may very well look for more advanced and precise solutions.

Article

9min read

5 A/B Test Case Studies and What You Can Learn From Them

AB Tasty’s note: This is a guest post by Umesh Kumar, digital marketing evangelist at Designhill.

A/B Testing isn’t a rocket science to understand and implement. It is just about testing two different versions of a page on your site to see which one attracts more audience. More than anything else, this test helps you know and understand your consumers better. After you run an A/B test, you will find that a few more have added in your earlier list of customers.

It surely is one of the best ways to improve your conversion rates. In fact, an article published in CrazyEgg.com reveals that using correct testing methods can increase conversion rates up to 300 percent. But it’s shocking that still, the majority of marketers choose not to use A/B test experiments. Don’t believe us? Check out the following stats:

Given these stats, it’s no surprise that many marketers steer clear of A/B testing for optimizing their site. But, how exactly can you optimize your conversions with A/B Testing? The answer is simple! Why not do what smart marketers do? Learn lessons from companies that have emerged as shining examples of A/B testing genius.

No matter what is the nature of your business, there is no harm in taking a step back and learning from others’ achievements. To help you, we have listed 5 classic case studies that will provide you with interesting test hypotheses and give you an insight on what and how visitors think. You can learn a lot from these case studies and use the learning to take on the conversion challenges in your way to success headfirst. These examples are quite simple to implement with any A/B testing tool.

Case Study 1: Conversions improve by 11.5% by Adding FAQs, Statistics and Social Proof on Websites

Test Carried Out By Kiva.org, an innovative non-profit organization, allows people to lend money via the Internet to low-income entrepreneurs and students across countries. Kiva conducted an A/B Test as they wanted to increase the number of donations from first-time visitors to their landing page.

Hypothesis: Giving more information to visitors coming to Kiva’s landing page will help boost the number of donors.

Result: Donations increased by 11.5% after adding an information box at the bottom of the landing page.

Version A – original: (left)

Version B: Addition of information box (FAQ, social proof & statistics)

ab-test-1

What You Can Learn from This Test?

Ensure that your landing page is designed in such a way that it answers all questions that a visitor may have. In this case, the information box at the bottom of the page helped the organization explain about themselves and their services, providing statistics. The information increased their trustworthiness and credibility as a site.

Case Study 2: 2.57% increase in Open Rates 5.84% Higher Click-through Rate (CTR) by Changing the Subject Line of an Email

Test Carried Out By Designhill.com, one of the fastest-growing peer-to-peer crowdsourcing platforms that connect graphic artists with design seekers. They did an email blast a few days before Christmas to promote its content and increase the click-through rate.

Hypothesis: Just mentioning the title of the blog in the subject line of the email would get the majority of click-through rather than requesting recipients to review the post with the blog’s title.

Just writing “Top 10 Off-Page SEO Strategies for Startups in 2015” in the subject line of the email would get the majority of click-through rather than writing “Check out My Recent Post – Top 10 Off-Page SEO Strategies for Startups in 2015”.

Result: The company was able to score 5.84% higher CTR and 2.57% higher open rate by including just the title of the blog in the subject line.

img_56cf0fba1f873

What You Can Learn From This Test:

Your subject line is the first thing the recipient of your email sees. Therefore, your subject line must have the power to entice the readers to open the mail and know more about your products or services. Because after all, it doesn’t really matter what your offer is if it is not opened by your readers. Therefore, choose your words wisely as they will have a higher impact on open rates and click-through. But it’s not only important to ensure great subject lines, but you must also ensure that your logo design is laid out in a way that vital information pop-up. For example, your logo design and contact details must be easily locatable. For another, CTAs and other links must be out of clutter. Read our Beginner’s Guide to A/B Testing your Emails.

Case Study 3:  49% Increase in CTR by Adding Text in the Call-to-Action Button

Test carried out by Fab, an online community whose members can buy and sell apparel, home goods, accessories, collectibles, etc.

Hypothesis: Making the “Add to Cart” button clearer (by adding text) will lead to an increase in the number of people adding items to their shopping carts.

Result: There was an increase of 49% in CTR over the original after the text “Add to Cart” was included in the CTA button rather than just an image or symbol.

In the following image, you’ll see that the original design (on the far left) features a small shopping cart with a “+” sign and no text. The two versions (middle and right) added text-based designs. Version A helped increase cart adds by 49% over the original.

img_56cf0fdd0a773

What You Can Learn From this Test:

Text connects better with visitors than images or symbols which may confuse them. Therefore, try and have a direct and clear CTA which will help consumers know of their actions.

It makes no sense to have a CTA that your visitors don’t understand. They don’t get to know what the button does actually.

Case Study 4: Conversion Rate Improved by 7.46% by Adding an Image Rather than a Blank Background. 

Test Carried Out By A company who wanted to check if customers get attracted to a blank background or one with pictures more.

Hypothesis: Using a photo in the background will lead to more conversions than a blank background.

Result: The conversion rate of the background with a photo was 25.14% as compared to 7.68% for the one without a photo.

img_56cf1044b8de0 img_56cf101ca63db

What you can learn from this test:

You must have heard that a picture is worth a thousand words. People love visuals and there could be no other better place than your site to impress them with the pictures of your products. Having an image of your product or service in the background of your site can drive conversions as they get to see (visualize) what they’ll be getting. Images hold the power to grab the attention of your audience and turn them into customers.

Case Study 5: Leads Increase by 256% after Having a Mobile-Optimized Landing Page

Test Carried Out By Rasmussen College, a for-profit private college and Public Benefit Corporation, who wanted to increase leads from Pay-Per-Click traffic on their mobile site.

Hypothesis: Creating a new mobile-friendly website, featuring a click-through menu, will improve conversions.

Result: Conversions increased by 256% after a new mobile-only (mobile responsive) site was made.

img_56cf10a3b0a5b

What you can learn from this test:

Hammad Akbar, founder of TruConversion.com says that “Unpleasant mobile experiences and a lack of mobile-friendliness makes 48% users believe that the company doesn’t care about their business.” A mobile-responsive website enhances the browsing experience of the site visitors. It is essential if you don’t want to lose customers just because your site took time to load. Keep the design of your site simple with only the basic information on the first page. Try and find different way of improving mobile navigation such as having a drop-down menu.

Conclusion

We hope that after reading this post, you are inspired to hold some amazing A/B tests on your own site. It is actually exciting and amazing to see what your customers like or dislike. But don’t forget that these tests are mere a guiding tool and nothing can replace your own tests and judgments about your visitors as well as the site. Remember, there is always a scope for improvement.

So, happy testing!

Download our guide to learn all there is to know about A/B testing!

Author Bio: Umesh Kumar is a digital marketing evangelist who works with Designhill, the fastest-growing custom design marketplace, to develop and execute their marketing strategies. He started his online marketing career in 2008 and is actively engaged within internet business modeling, website development, social networks, lead generation, search engine optimization, and search engine marketing. In addition, he loves blogging and shares his expertise about tips, tricks, and upcoming trends in the world of digital marketing. Get in touch Facebook | Twitter | Google+