One of the most critical metrics in DevOps is the speed with which you deliver new features. Aligning developers, ops teams, and support staff together, they quickly get new software into production that generates value sooner and can often be the deciding factor in whether your company gains an edge on the competition.
Quick delivery also shortens the time between software development and user feedback, which is essential for teams practicing CI/CD.
One practice you should consider adding to your CI/CD toolkit is the blue-green deployment. This process helps reduce both technical and business risks associated with software releases.
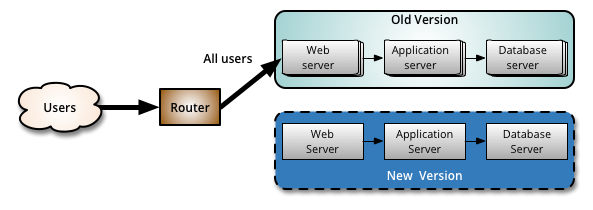
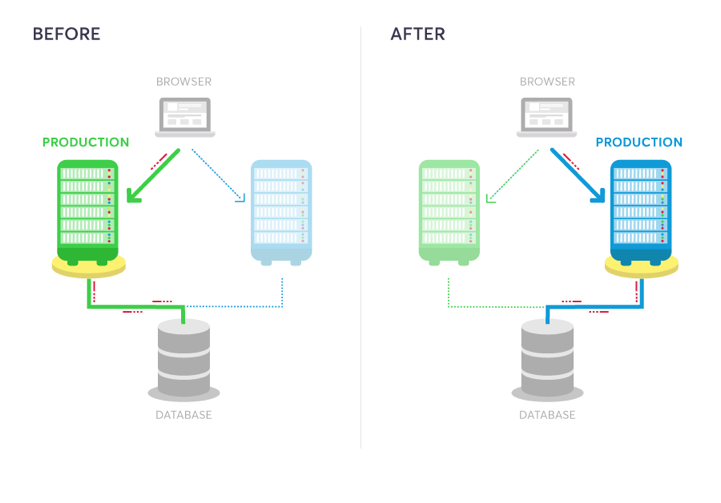
In this model, two identical production environments nicknamed “blue” and “green” are running side-by-side, but only one is live, receiving user transactions. The other is up but idle.
In this article, we’ll go over how blue-green deployments work. We’ll discuss the pros and cons of using this approach to release software. We’ll also compare how they stack up against other deployment methodologies and give you some of our recommended best practices for ensuring your blue-green deployments go smoothly.
[toc]
How do blue-green deployments work?
One of the most challenging steps in a deployment process is the cutover from testing to production. It must happen quickly and smoothly to minimize downtime.
A blue-green deployment methodology addresses this challenge by utilizing two parallel production environments. At any given time, only one of them is the live environment receiving user transactions. In the image below, that would be green. The blue idle system is a near-identical copy.
Your team will use the idle blue system as your test or staging environment to conduct the final round of testing when preparing to release a new feature. Once the new software is working correctly on blue, your ops team can switch routing to make blue the live system. You can then implement the feature on green, which is now idle, to get both systems resynchronized.
Generally speaking, that is all there is to a blue-green deployment. You have a great deal of flexibility in how the parallel systems and cut-overs are structured. For example, you might not want to maintain parallel databases, in which case all you will change is routing to web and app servers. For another project, you may use a blue-green deployment to release an untested feature on the live system, but set it behind a feature flag for A/B user testing.
Example
Let’s say you’re in charge of the DevOps team at a niche e-commerce company. You sell clothing and accessories popular in a small but high-value market. On your site, customers can customize and order products on-demand.
Your site’s backend consists of many microservices in a few different containers. You have microservices for inventory management, order management, customization apps, and a built-in social network to support your customers’ niche community.
Your team will release early and often as you credit your CI/CD model for your continued popularity. But this niche community is global, so your site sees fairly steady traffic throughout any given day. Finding a lull in which to update your production system is always tricky.
When one of your teams announces that their updated customization interface is ready for final testing in production, you decide to release it using a blue-green deployment so it can go out right away.
The next day before lunch, your team decides they’re ready to launch the new customizer. At that moment, all traffic routes to your blue production system. You update the software on your idle green system and ask testers to put it through Q/A. Everything looks good, so your ops team uses a load balancer to redirect user sessions from blue to green.
Once traffic is completely filtered over to green, you make it the official production environment and set blue to idle. Your dev team pushes the updated customizer code to blue, puts in their lunch order, and takes a look at your backlog.
Pros: Benefits & use cases
One of the primary advantages of blue-green deployments over other software release strategies is how flexible they are. They can be beneficial in a wide range of environments and many use cases.
Rapid releasing
For product owners working within CI/CD frameworks, blue-green deployments are an excellent method to get your software into production. You can release software practically any time. You don’t need to schedule a weekend or off-hours release because, in most cases, all that is necessary to go live is a routing change. Because there is no associated downtime, these deployments have no negative impact on users.
They’re less disruptive for DevOps teams too. They don’t need to rush updates during a set outage window, leading to deployment errors and unnecessary stress. Executive teams will be happier too. They won’t have to watch the clock during downtime, tallying up lost revenue.
Simple rollbacks
The reverse process is equally fast. Because blue-green deployments utilize two parallel production environments, you can quickly flip back to the stable one should any issues arise in your live environment.
This reduces the risks inherent in experimenting in production. Your team can easily remove any issues with a simple routing change back to the stable production environment. There is a risk of losing user transactions cutting back—which we’ll get into a little further down—but many strategies for managing that situation are available.
You can temporarily set your app to be read-only during cutovers. Or you could do rolling cutovers with a load balancer while you wait for transactions to complete in the live environment.
Built-in disaster recovery
Because blue-green deployments use two production environments, they implicitly offer disaster recovery for your business systems. A dual production environment is its own hot backup.
Load balancing
Blue-green parallel production environments also make load balancing easy. When the two environments are functionally identical, you can use a load balancer or feature toggle in your software to route traffic to different environments as needed.
Easier A/B testing
Another use case for parallel production environments is A/B testing. You can load new features onto your idle environment and then split traffic with a feature toggle between your blue and green systems.
Collect data from those split user sessions, monitor your KPIs, and then, if analyses of the new feature look good in your management system, you can flip traffic over to the updated environment.
Cons: Challenges to be aware of
Blue-green deployments offer a great deal of value, but integrating the infrastructure and practices required to carry them out creates challenges for DevOps teams. Before integrating blue-green deployments into your CI/CD pipeline, it is worth understanding these challenges.
Resource-intensive
As is evident by now, to perform a blue-green deployment, you will need to resource and maintain two production environments. The costs of this, in money and sysadmin time, might be too high for some organizations.
For others, they may only be able to commit such resources for their highest value products. If that is the case, does the DevOps team release software in a CI/CD model for some products but not others? That may not be sustainable.
Extra database management
Managing your database—or multiple databases—when you have parallel production environments can be complicated. You need to account for anything downstream of the software update you’re making needs in both your blue and green environments, such as any external services you’re invoking.
For example, what if your feature change requires you to rename a database column? As soon as you change the name to blue, the green environment with old code won’t function with that database anymore.
Can your entire production environment even function with two separate databases? That’s often not the case if you’re using your blue and green systems for load balancing, testing, or any function other than as a hot backup.
Product management
Aside from system administration, managing a product that runs on two near-identical environments also requires more resources. Product Managers need reliable tools for tracking how their software is performing, which services different teams are updating, and ways to monitor the KPIs associated with each. A reliable product and feature management dashboard to monitor and coordinate all of these activities becomes essential.
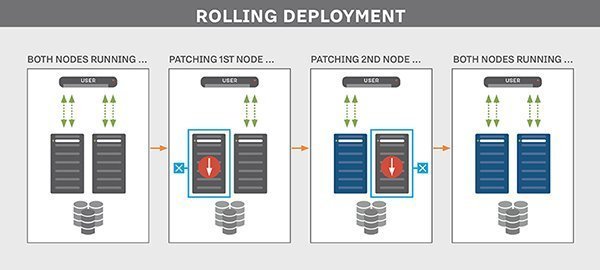
Blue-green deployments vs. rolling deployments
Blue-green deployments are, of course, not the only option for performing rapid software releases. Another popular approach is to conduct a rolling deployment.
Rolling deployments also require a production environment that consists of multiple servers hosting an application, often, but not always, with a load balancer in front of them for routing traffic. When the DevOps team is ready to update their application, they configure a staggered release, pushing to one server after another.
While the release is rolling out, some live servers will be running the updated application, while others have the older version. This contrasts with a blue-green deployment, where the updated software is either live or not for all users.
As users initiate sessions with the application, they might either reach the old copy of the app or the new one, depending on how the load balancer routes them. When the rollout is complete, every new user session that comes in will reach the software’s updated version. If an error occurs during rollout, the DevOps team can halt updates and route all traffic to the remaining known-good servers until they resolve the error.
Rolling deployments are a viable option for organizations with the resources to host such a large production environment. For those organizations, they are an effective method for releasing small, gradual updates, as you would in agile development methodologies.
There are other use cases where blue-green deployments may be a better fit. For example, if you’re making a significant update where you don’t want any users to access the old version of your software, you would want to take an “all or nothing” approach, like a blue-green deployment.
Suppose your application requires a high degree of technical or customer support. In that case, the support burden is magnified during rolling deployment windows when support staff can’t tell which version of an application users are running.
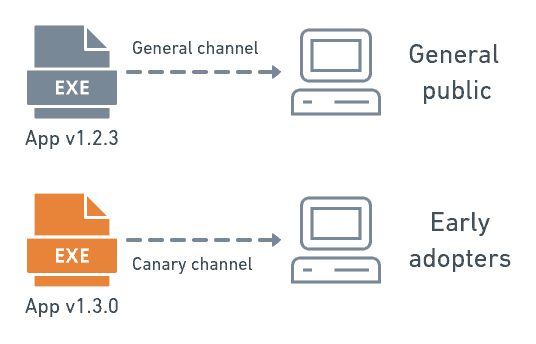
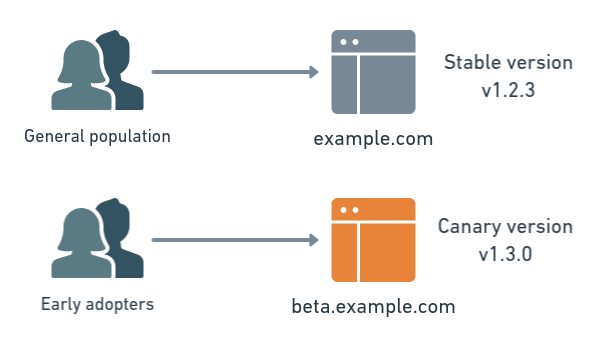
Blue-green deployments vs. canary releasing
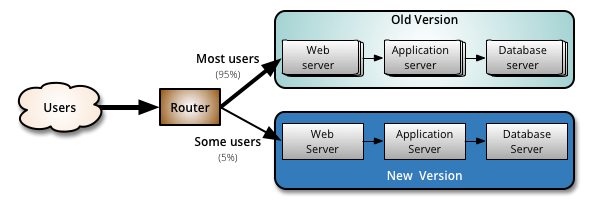
Rolling and blue-green deployments aren’t the only release strategies out there. Canary deployments are another alternative. At first, only a subset of all production environments receives a software update in a canary release. But instead of continuing to roll deploy to the rest, this partial release is held in place for testing purposes. A subset of users is then directed to the new software by a load balancer or a feature flag.
Canary releasing makes sense when you want to collect data and feedback from an identifiable set of users about updated software. Practicing canary releases dovetails nicely with broader rolling deployments, as you can gradually roll the updated software out to larger and larger segments of your user base until you’ve finished updating all production servers.
Best practices
You have many options for releasing software quickly. If you’re considering blue-green deployments as your new software release strategy, we recommend you adopt some of these best practices.
Automate as much as possible
Scripting and automating as much of the release process as possible has many benefits. Not only will the cutover happen faster, but there’s less room for human error. A dev can’t accidentally forget a checklist item if a script or a management platform handles the checklist. If everything is packaged in a script, then any developer or non-developer can carry out the deployment. You don’t need to wait for your system expert to get back to the office.
Monitor your systems
Always make sure to monitor both blue and green environments. For a blue-green deployment to go smoothly, you need to know what is going on in both your live and idle systems.
Both systems will likely need the same set of monitoring alerts, but set to different priorities. For example, you’ll want to know the second there is an error in your live system. But the same error in the idle system may need to be addressed sometime that business day.

Write backward and forward-compatible code
In some cases, new and old versions of your software won’t be able to run simultaneously during a cutover. For example, if you need to alter your database schema, it would help if you structured your updates so that both blue and green systems will be functional throughout the cutover.
One way to handle these situations is to break your releases down into a series of even smaller release packages. Let’s say our e-commerce company is deepening its inventory and needs to update its database by changing a field name from “shirt” to “longsleeve_shirt” for clarity.
They might break this update down by:
- Releasing a feature flag-enabled intermediary version of their code that can interpret results from both “shirt” and “longsleeve_shirt”;
- Running a rename migration across their entire database to rename the field;
- Releasing the final version of the code—or flip their feature flag—so the software only uses “longsleeve_shirt.”
Do more, smaller deployments
Smaller, more frequent updates are already an integral practice in agile development and CI/CD. It is even more important to follow this practice if you’re going to conduct blue-green deployments. Reducing deployment times shortens feedback loops, informing the next release, making each incremental upgrade more effective and more valuable for your organization.
Restructure your applications into microservices
This approach goes hand-in-hand with conducting smaller deployments. Restructuring application code into sets of microservices allows you to manage updates and changes more easily. Different features are compartmentalized in a way that makes them easier to update in isolation.
Use feature flags to reduce risk further
By themselves, blue-green deployments create a single, short window of risk. You’re updating everything, all-or-nothing, but you can cut back if needed should an issue arise.
Blue-green deployments also have a pretty consistent amount of administrative overhead that comes with each cutover. You can reduce this overhead through automation, but still, you’re going to follow the same process no matter whether you’re updating a single line of code or you’re overhauling your entire e-commerce suite.
Feature flags can offer a very granular level of control over how and when users experience newly available software. Feature flags are like powerful “if” statements, from which at least one of two or more different codepaths is followed at runtime depending on a provided condition.
Those conditions can be simple “yes/no” checks, or they can be complex decision trees. Feature flags help make software releases more manageable by controlling what is turned on or off at a feature-by-feature level.
For example, our e-commerce company can perform a blue-green deployment of their customizer microservice but leave the new code turned off behind a feature flag in the live system. Then, the DevOps team can turn on that feature according to whatever condition they wish, whenever it is convenient.
The team might want to do some further A/B testing in production. Or maybe they want to conduct some further fitness tests. Or it might make more sense for the team to do a canary release of the customizer for an identified set of early adopters.
Your feature flags can work in conjunction with a load balancer to manage which users see which application and feature subsets while performing a blue-green deployment. Instead of switching over entire applications all at once, you can cut over to the new application and then gradually turn individual features on and off on the live and idle systems until you’ve completely upgraded. This gradual process reduces risk and helps you track down any bugs as individual features go live one-by-one.
You can manually control feature flags in your codebase, or you can use feature flag services for more robust control. These platforms offer detailed reporting and KPI tracking along with a deep set of DevOps management tools.
We recommend using feature flags in any major application release when you’re doing a blue-green deployment. They’re valuable even in smaller deployments where you’re not necessarily switching environments. You can enable features gradually one at a time on blue, leaving green on standby as a hot backup if a major problem arises. Combining feature flags with blue-green deployments is an excellent way to perform continuous delivery at any scale.
Consider adding blue-green deployments to your DevOps arsenal
Blue-green deployments are an excellent method for managing software releases of any size, no matter whether they’re a whole application, major updates, a single microservice, or a small feature update.
It is essential to consider how well blue-green deployments will integrate into your existing delivery process before adopting them. This article detailed how blue-green deployments work, the pros and cons of using them in your delivery process, and how they stack up against other possible deployment methods. You should now have a better sense of whether blue-green deployments might be a viable option for your organization.
Want to see other ways to improve your delivery process? Request a demo of our feature flagging platform today.