Article

8min read

Great Value Proposition Examples

A value proposition is a clear statement of the fundamentals that define your brand.

To create a value proposition, you need to clearly define your product or service and showcase how you are different from competitors. This is often referred to as a Unique Selling Point (USP).

So, how can you define and present your company’s USP? By crafting a value proposition canvas.

A value proposition canvas is a visual display that maps out your product or service and how it can meet the specific needs of your customers.

It’s essentially an extension of the frequently-used business model canvas and has become a widely popular method of presentation in all corners of the business world.

In this article, we will dive into the specifics of a value proposition, give you tips for creating your own and advice on how to develop it further with a value proposition canvas.

What is a value proposition?

At first glance, a value proposition seems like a very simple and broad concept. However, a particularly effective value proposition is exceptionally complex and loaded with details.

Here are some common questions at the heart of each value proposition:

  • Why should a customer use your service or buy your product over a competitor’s?
  • What are you offering that no one else can?
  • How can you serve the needs of each individual customer?

A value proposition is not a positioning statement designed to appeal to as many customers as possible, rather it’s very specific. To meet the specific needs of a specific customer, you need to be as niche as possible.

For example, a business might be looking for software that comes with customer support packages that are more encompassing than usual due to the fact that they have little experience with a particular product.

Suppose a software company highlights its top-rated customer service team and affordable ongoing support options that their competitors are unable to provide. In that case, it will likely attract businesses that will profit from (and be in need of) this type of support.

Let’s look at another example: Uber – a travel service provider that meets low-cost and on-demand needs. Immediacy, convenience and simplicity are at the heart of their value proposition.
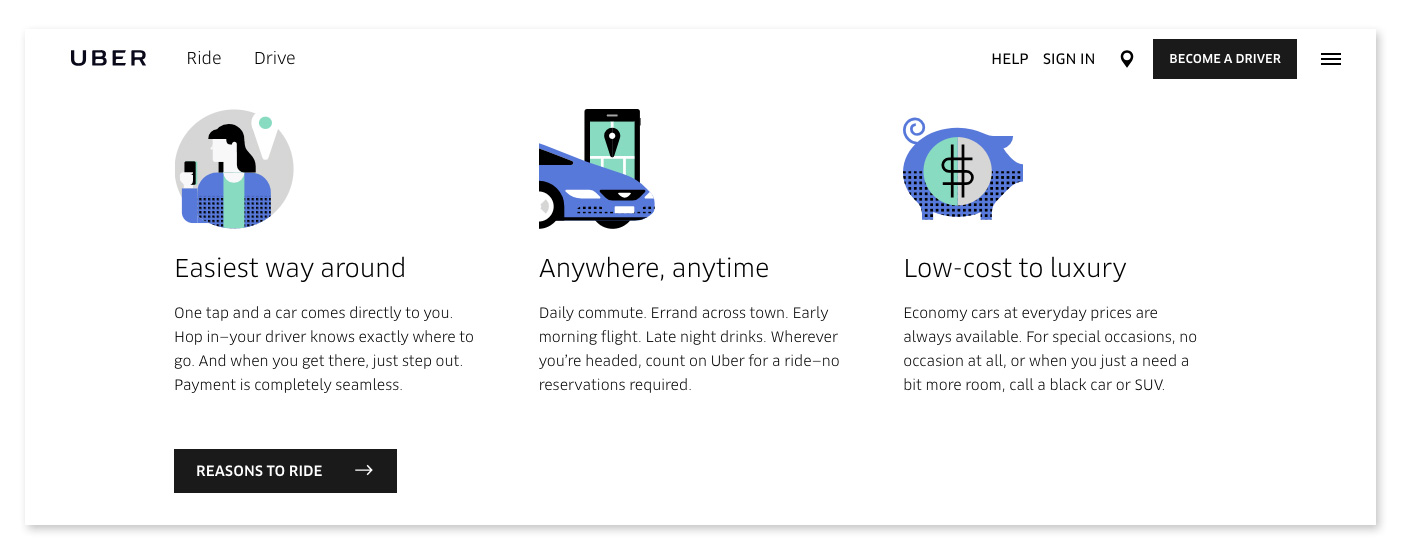
Uber value proposition

Think about the unique benefit that you are providing. If you can define this simply, concisely and accurately, you have a value proposition of worth to your audience.

How to create a value proposition

Now that we’ve defined what a value proposition is, let’s move on to how you can start brainstorming to transform your thoughts and ideas into a clear statement.

Before we get too intense, start by drafting up a few phrases with this template: We help (Customer) to (Goal) by (Unique value proposition).

We should also keep in mind that value propositions don’t need to be subtle. In fact, they can be rather blunt instruments used to draw in new customers or clients.

Value propositions should not be loaded with jargon or complexities. They should be thought of more like a well-researched advertising jingle than a dissertation.

Let’s discuss a few points to keep in mind when developing your value proposition:

  • Define your target audience
  • Know your competition
  • Tell your customers how you meet their needs
  • Be prepared to combat stereotypes

Define your target audience

As value propositions are highly dependent on those that are being sold to, it’s essential to define your target audience.

This requires a great deal of research, but will undoubtedly pay off in the long run. Age, demographics, marital status, economic status and personal interests can all inform how a value proposition is designed.

Your message needs to be clearly personalized for your audience.

Know the competition

It’s hard to stand out from the crowd if you have little concept of what the crowd is offering.

If a larger competitor offers the same USP (Unique Selling Points), it’s likely that they will get a hold of your potential customers since they will rely on your differences: brand size and reputation.

This requires extensive research to define new and fertile ground. You need to know your competition well – not only to be aware of your similarities but also to let your audience know how you stand out.

Tell your customer how you meet their needs

To start with, it’s best to define exactly what your product or service offers. Then, you can move into what makes it unique:

  • Customer service?
  • Affordability?
  • A simpler design than the competitors?

Once you have defined what you will highlight, it’s time to get more specific with your word choice. Remember: specificity does not mean complexity.

  • If the customer service is highly rated, why?
  • Affordability is great, but does the quality of the product match or even improve on your competitor?
  • Simplicity is admirable, but how does this improve customer satisfaction?

If you can define this in simple, but effective terms, you will have a highly effective value proposition.

Be prepared to combat stereotypes

Every sector has its own negative stereotype that can be harmful even before they get started.

Delivery services are known for not turning up when agreed upon, car salesmen are known for being notoriously pushy and fast food is known for being convenient but unhealthy. These are all examples of initial reactions, or cognitive biases, that most people have before using a product or service.

One of the most powerful kinds of value propositions are those that go against the grain of expectations.

If your particular sector is known for a negative practice, ensuring that your brand is above the stereotype can provide a concise and enticing positioning statement.

Value proposition canvas

A value proposition canvas is a focused way of structuring the main components of the value proposition in order to provide the most concise solutions for potential customers.

Value proposition canvas segments

The value proposition canvas is made up of two segments: the customer segment and the value proposition.

Inside each segment are three sections. The customer segment (shown below in red) has the specific needs of the customer, while the value proposition segment (shown in green) has the corresponding solutions.
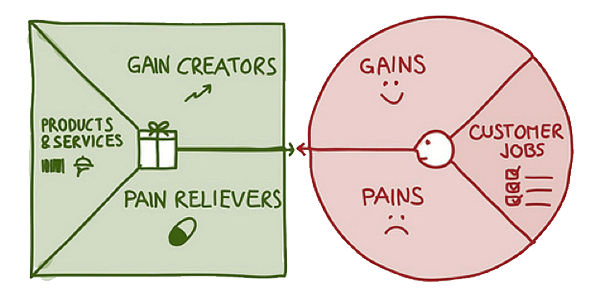
value proposition canvas

The three sections of the customer segment (red) in the value proposition canvas are:

  • Customer jobs – what tasks can your customer accomplish by using your product or service?
  • Customer pains – what problems, risks or negative experiences can the customer eliminate when using your product or service?
  • Customer gains – what unique benefit does the customer gain when
    using your product or service?

The value proposition map (green) on the other side of the canvas seeks to address these factors while presenting unique solutions and unexpected gains.

  • Gain creators – this is where you detail the unique improvements and benefits that your product or service offers to your customers
  • Pain relievers – this is the area to address elements that eliminate a current frustration or pain point (such as undesired costs, accessibility, or negative stereotypes)
  • Products and services – this is the spot to list all of your products and service

How to create a value proposition canvas

Let’s start with the customer segment.

The first thing to consider when creating a value proposition canvas is the customer. The customer is the central part of the entire premise. Be sure to speak carefully to your specific audience and avoid making generalizations.

Customer pains are generally more straightforward; therefore, pain relievers are often easier to define.

It’s tempting to focus solely on the functional factors, such as how to get from A to B. However, while the function is important, the emotional and social aspects also need deep consideration when developing your value proposition canvas.

Customer gains are a more complex element of the value proposition canvas as they can be slightly more difficult to define. In essence, these cannot be discovered without a substantial understanding of the uniqueness of the business itself. Not only will you list what the customer will gain from your product, but also what the customer will gain by choosing you over the competition.

Now let’s move on to the value proposition portion of the canvas.

Listing the potential jobs, or tasks, that customers want to accomplish with the help of your product or service is a good place to start.

Once completed, you will move on to the pain relievers and gains.

The pain relievers will specifically target the pains listed in the customer segment and should remain consistent. Meanwhile, the gain creators will show where your product or service adds value.

It’s important to remember that gains aren’t the opposite of pains. They are different factors that ultimately encourage consumers to adopt the product or service.

In the gains section, you will address the lesser-known desires of the customers – these are things that the customer themselves may not even be aware of. The lesser-known customer needs can be considered the “bonuses” that your brand offers potential customers.

Let’s go back to Uber as an example. Uber’s customers need quick, accessible and affordable transportation. These are the customer’s first thoughts. In addition, their customers also need safety during their rides. Uber offers insurance during trips to their drivers and passengers to cover them in the case of an accident. Furthermore, they can provide passengers with more comfort by including driver ratings from previous passengers. Customers may not immediately think of these factors, but they address very important human needs.

After development, each part of the right side of the canvas should be balanced with solutions and gains on the left. Ultimately, a value proposition canvas seeks perfect alignment.

Finding your fit in the market

Creating a value proposition canvas is a great tool to help understand your product, where you fit in the market, how you stand against competitors and the best way to market your brand successfully.

Drawing conclusions from this canvas and analyzing your value proposition can help you improve your strategies, messaging and overall product. A unique and profound value proposition is the core of a strong business.

Subscribe to
our Newsletter

bloc Newsletter EN

We will process and store your personal data to respond to send you communications as described in our  Privacy Policy.

Article

12min read

Understanding Bounce Rate to Improve It

Bounce rate is one of the most important metrics used to understand how well your website is performing. It’s a type of web analytics metric that measures the behavior of visitors to a website or page within the website.

In this article, we will cover everything about bounce rates: how they are calculated, bounce rates vs exit rates, what is considered a good bounce rate, how to use web analytics for tracking and tips for improving this metric.

Let’s get started.

What is bounce rate on a website?

The definition of bounce rate is relatively easy to understand compared to other web analytics concepts. However, that is not to say that the data is somehow superficial or unimportant, as there are many insights that a bounce rate analysis can provide.

The bounce rate yields information on the behavior of a website’s visitors and how well the website is engaging them.

To “bounce” from a website simply means to leave before interacting with the page in some way such as leaving a comment, clicking on something, scrolling or visiting another page on the site.

In other words, to enter and to leave without engaging beyond the initial entrance of the website is a bounce. However, a bounce is not always a bad thing or a sign that the website is not performing well.

Each visitor to a website can be seen as a drop of water with the website presenting a surface that is either porous or waterproof. The goal of a website is to be as porous as possible, absorbing each visitor to the site with as relevant and interesting information as possible. Non-porous websites “bounce” visitors immediately, often indicating that the website is not performing as required and flagging issues that can be addressed with further web analytics.

How to calculate bounce rate

A bounce rate analysis is a very straightforward formula that can be summed up in a simple equation.

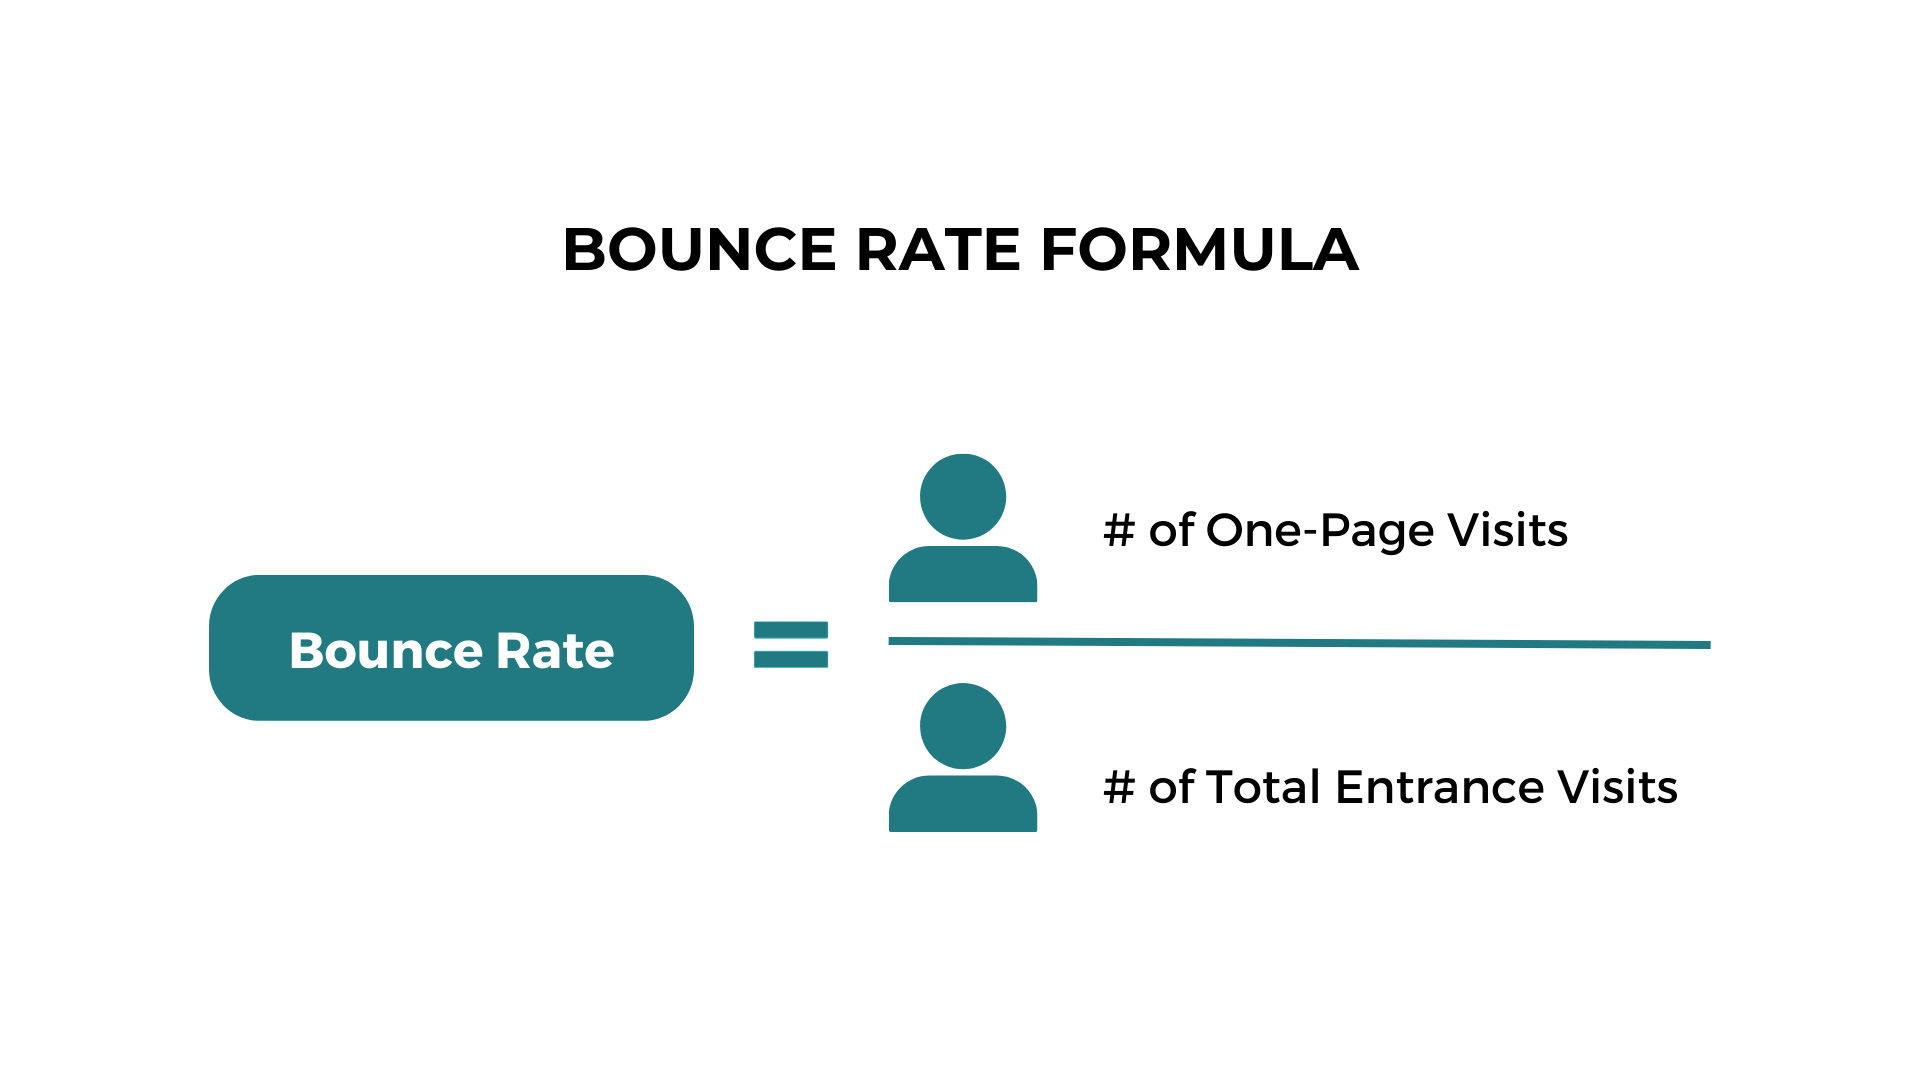
The number of visitors who leave a website after only visiting the landing page (the page that led them to the website) and not interacting in any way, is divided by the total number of visitors to the site.

Bounce Rate Formula

For example, if 40 visitors leave without being “absorbed” into further interaction with a site and there have been 100 visitors overall, the bounce rate will be 40%.

There are a few main ways that a visitor may bounce. For example:

  • Clicking on a link to another website
  • Clicking the back arrow that takes them to the previous page
  • Entering a new URL and hitting enter
  • Closing the browser or tab

One other way in which a visitor may bounce is if they stop interacting entirely, causing the session to time out.

Anything over half an hour of idle time is considered a bounce. Any further interaction after this time, even if it occurs within the site, is considered a new session.

Bounce rate vs exit rate

Bounce rate and exit rate are often thought to be synonyms, or at the very least that they ultimately provide the same data.

This is a huge error and can lead to false bounce rate analysis and poor decision-making.

The confusion is understandable, as both concepts seemingly measure similar things on the surface. However, the difference is quite profound and requires an understanding of what both metrics measure.

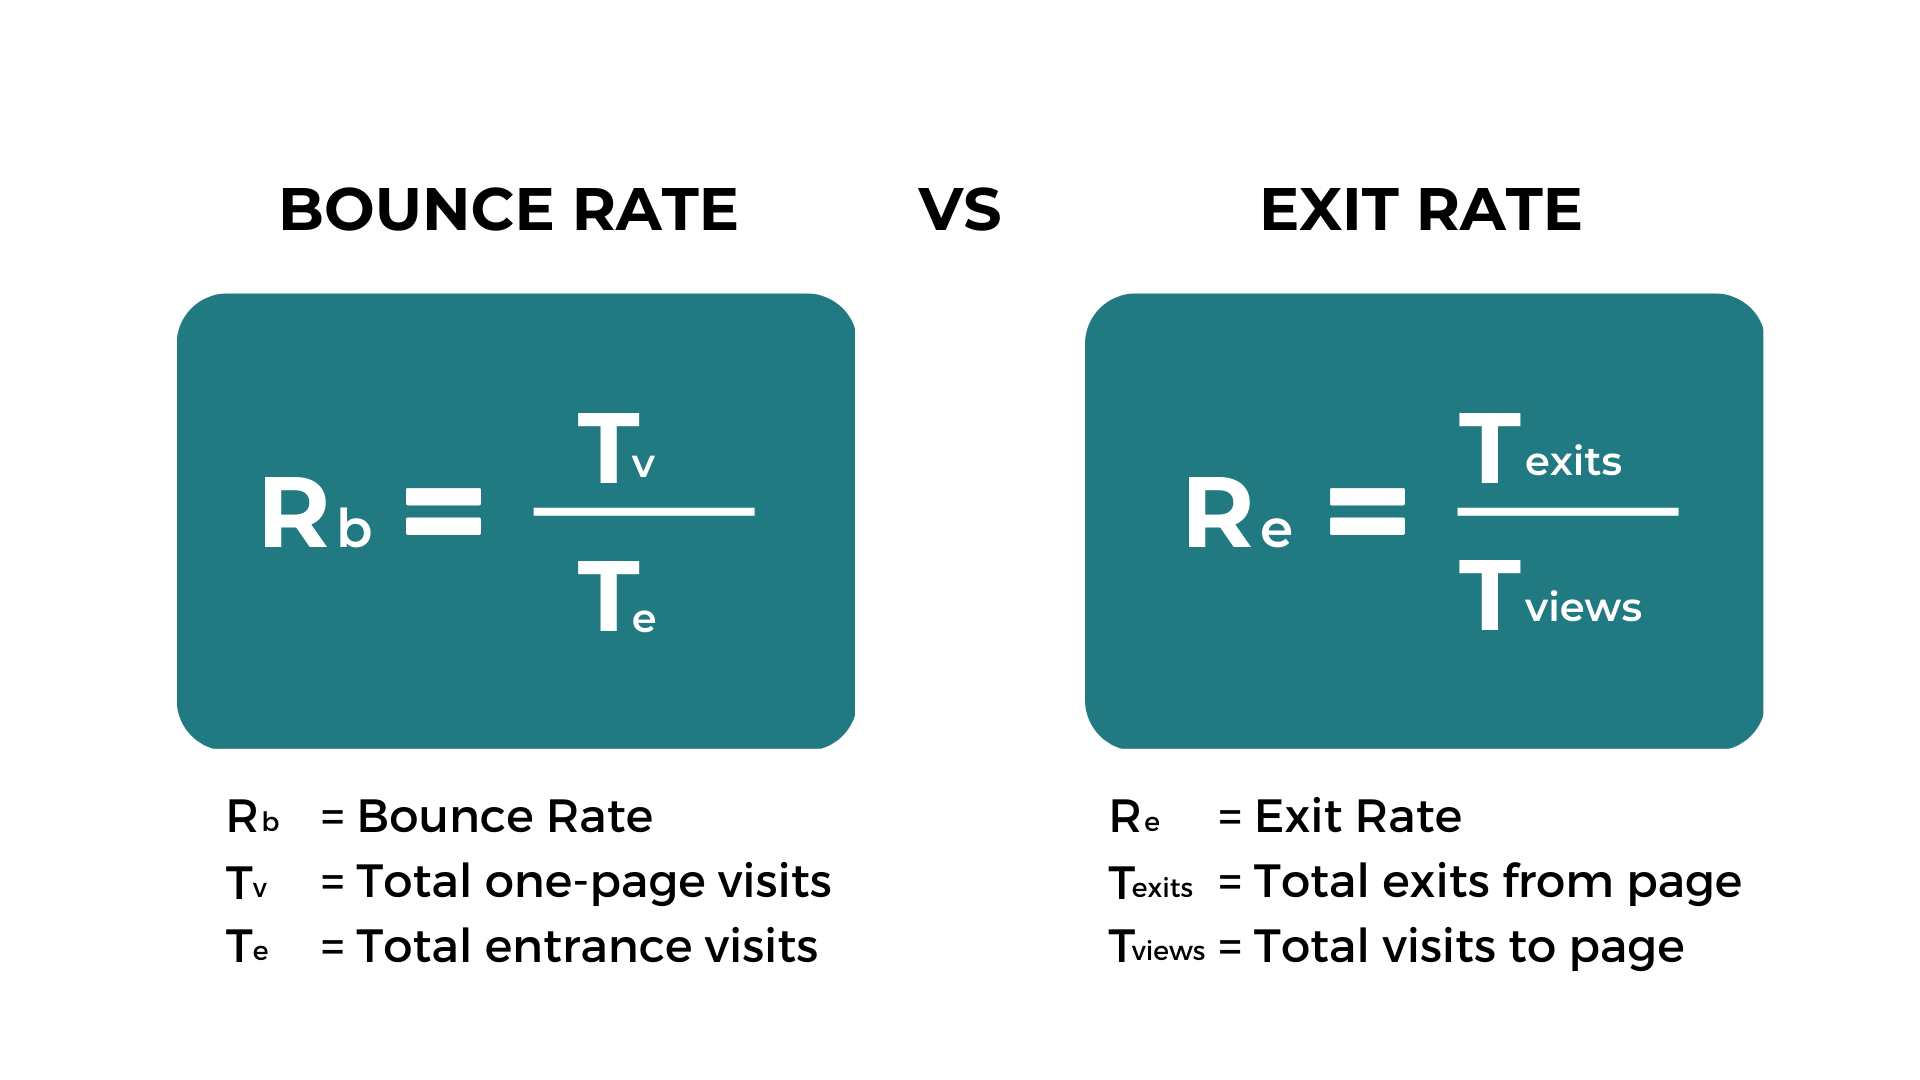
As previously described, bounce rate measures the percentage of visitors that leave a website before interacting with it in any way.

Exit rates provide information on specific pages of the website, measuring the percentage of visitors that left the site after viewing a specific page, no matter how many pages they have visited before in the session.

In other words, all bounces are exits, but not all exits are bounces.

Bounce rates are based on only sessions that start and end with one page. While exit rates calculate the last page visited in the user’s journey, regardless of the number of pages a user has visited during one session.

Bounce Rate vs Exit Rate

For example, let’s say a site has three pages named Page X, Page Y and Page Z. From Monday to Friday, the interaction might look something like this:

  • Monday – Page Y > Exit
  • Tuesday – Page Y >Page Z > Page X >Exit
  • Wednesday – Page X > Page Z > Page Y >Exit
  • Thursday – Page Z >Exit
  • Friday – Page Y > Page X > Page Z > Exit

The analysis would show:

Page X has an exit rate of 33% and a bounce rate of 0%.

  • Three sessions included Page X and one session exited from Page X.
  • There was no single-page session for Page X.
  • One session began on Page X, but it was not a single-page session, so the bounce rate is zero.
  • No visitor entered and left without any other interaction on this page.

Page Y has an exit rate of 50% and a bounce rate of 33%.

  • Four sessions included Page Y.
  • Two of those four total sessions exited directly from Page Y, so the exit rate is 50%.
  • The bounce rate is less than the exit rate because three sessions started with Page Y and only the single-page session led to a bounce.

Page Z has an exit rate of 50% and a bounce rate of 100%.

  • Just like Page Y, the exit rate of Page Z is 50% because four sessions included Page Z, and two sessions exited from Page Z.
  • The bounce rate is 100% because the only session that started with Page Z was a single-page session that led to a bounce.

High exit rates of some pages can be a good sign. For example, within e-commerce, leaving a page after completing a purchase is a good sign as it points towards a satisfactory outcome of a transaction.

Define average bounce rates

Defining average bounce rates can be a complex task. This is largely due to the fact that a high bounce rate for some pages, might be considered low for others.

Each case can be highly subjective due to the industry and purpose of the webpage. Certainly, bounce rate can only provide some information about a website’s performance and it remains highly important to use other metrics to fully understand visitor behavior.

Industry-standard bounce rates consider anything over 50% as high and anything between 20% and 50% as low, but it’s essential to go beyond this broad definition of what is an acceptable bounce rate.

Anything under 20% is likely an error and should be looked into.

What is a healthy bounce rate?

Rather than being concerned with an all-encompassing good bounce rate, a better goal would be finding a healthy bounce rate for each specific site and its unique goals.

The goal of 20% to 50% is not without merit, but it can be a superficial reading of behavior or almost impossible to attain depending on your type of page.

For an e-commerce landing page, browsing is often encouraged because it can lead to sales later on. Lower bounce rates will indicate that visitors decided to continue to look around rather than leave.

For other sites, like online recipe sites or information-specific sites, browsing is not likely. Therefore, a high bounce rate on these types of pages can be an indication that the visitor is satisfied having found the information they needed and bounced after.

Some websites are designed to be only one page, so it’s impossible to know what a “bad” bounce rate is when the design itself ensures it remains at 100%. In these circumstances, and those where a lot of information is presented on the landing page, other metrics can provide more relevant insights.

For example, it is always a bad sign if the visitor leaves within a matter of seconds. However, if they remain on the page for multiple minutes, the bounce rate might not be the best indicator that the site is not performing as desired.

To determine a high or low bounce rate, it’s important to consider the site’s purpose, the average bounce rate in your sector and typical user behavior. From there it will be easier to gain the appropriate insight that the data is providing.

Want to lower bounce rates by testing different aspects of your website? AB Tasty’s best-in-class customer experience optimization platform offers you an A/B testing tool that allows you to quickly set up tests with low code implementation of front-end or UX changes on your web pages. Go further by gathering insights via an ROI dashboard, and determining which route will attract customers and ultimately increase your revenue.

How to check the bounce rate of your website

Once you have defined what you consider to be your desired website bounce rate, the next step is to understand where to find the data.

Thankfully this data is very easy to find and comprehend in Google Analytics, which also provides a multitude of other data to help understand how well your website is performing.

Not being particularly familiar with Google Analytics should not deter you from using it. It is fairly self-explanatory once you have a grasp of the terms and purpose of the data.

Where to find the bounce rate on Google Analytics?

First, sign into the website’s Google Analytics page. Once there, select the “Audience Overview” tab, which also provides a variety of other metrics that can be of great use. From here you will need to choose whether you want to read the entire website’s or individual pages’ bounce rate.

For the entire website, simply click on the bounce rate metric, which will also provide a graph for the defined time period. The time period can be changed as required by the calendar at the top right of the screen and includes a customizable option.

For individual pages, click “Behavior” followed by “All Pages”, which will then provide a list of your website’s pages and their specific bounce rate. Much like understanding the website’s unique bounce rate context, this is also the case for individual pages.

Do all analytic software measure bounce rates the same way?

Google Analytics measures a bounce as a single-page session that has a duration of 0 seconds. Clearly, a visitor will not make any other actions during a 0-second time frame.

If you’re using another analytics software to do your website tracking, keep in mind that they may score it slightly differently.

Some analytics software do not have a time frame that they use to count a bounce. Rather,  they rely strictly on the interaction of the visitor during their session. Both ways will calculate a bounce rate for your website, but it’s important to know the specifics.

The key takeaway here is not to compare results from one analytic software to another. Consistency is key to tracking your performance.

How to reduce website bounce rate

Once you have an understanding of the concept of bounce rate, the next question is “Why is my bounce rate so high?” And more importantly, “how do I lower the bounce rate?

There are many methods that can help reduce your bounce rate, including simpler things like seeing which page is performing best and implementing some of its elements on other pages that have higher bounce rates.

Some other ideas will become self-explanatory, while others might require a little trial and error.

Here are a few ideas to try out:

Improve content

One of the simplest ways to decrease the bounce rate of a page or the entire site is to improve the content itself.

In some ways this should be self-explanatory: the more interesting and higher quality the content, the more likely the reader will stick around to explore what else the site has to offer.

Relevancy is also key. If your website is primarily about camping, publishing unrelated content, such as politics, is likely to be met with disinterest and repel visitors instantly. This will undoubtedly lead to a high bounce rate.

Content requires some planning and forethought if a site is going to “absorb” visitors.

Readability

Content isn’t just related to interesting posts or entertaining media, readability is also key.

Text-heavy websites might be full of amazing information, but unless the page is formatted to draw the reader in, the first impression might be a bit overwhelming.

Be sure to use some mixture of imagery, bullet points, subheadings, and bolded words. This creates a balance to attract and retain visitors.

Avoid the use of excessive pop-ups

Nothing cheapens the feel of a site like the dreaded pop-up, and this isn’t just the case for ads.

Pop-ups are distracting, appear pushy and ruin the flow of the experience for a user. There is nothing quite as infuriating as having to click away one or several flashing online forms while trying to read something else.

Pop-ups do have their place, and when used at a minimum. They can help grow a subscriber list with a degree of effectiveness. If you like the idea of pop-ups but want to try something different, there are more effective measures such as email campaigns or personalized banners. By implementing one of these campaigns, visitors have the option to interact with an element after they’ve had a chance to engage with the content.

Targeted keywords

Lowering the bounce rate will always require a mixture of tactics, but one of the most reliable ways to do it is by targeting keywords.

The key to using keywords effectively is relevancy, so it is not just a matter of throwing as many keywords at the problem as possible. There is nothing more likely to lead to a high bounce rate than keywords that draw in visitors that are not interested in a website’s content.

The best place to begin is the use of high-value traffic/low-competition keywords. But, how do you find out what these are for your site? Well, it isn’t as complex as you might think. Google Keyword Planner is the perfect tool to implement targeted keywords for your site, and it’s free to use for Google account holders.

Lowering bounce rate with meta descriptions

Meta descriptions are the information that appears under the title of a website in a Google search. They add some depth to the description of a website presence on a search page and are therefore essential in garnering relevant traffic.

Meta descriptions do not rank by keyword, but they filter out traffic that will likely bounce, while also drawing in those more likely to interact. Remember that meta descriptions only show up to 155 characters. Target them to get the right information across to users who aren’t as likely to bounce.

Understanding bounce rates

As you can see, bounce rates can provide a lot of insight into your website’s performance.

Although there is no magic number to indicate a “good” or “bad” webpage bounce rate performance, you can determine your own baseline metrics based on each page’s purpose and past performance.