Anaïs Levy shares how luxury brands use experimentation to balance brand image with business performance, plus why removing prices can actually boost conversions.
Anaïs Levy knows the secret behind what drives luxury digital experiences. As the E-commerce & Omnichannel Services Insights Manager at the Kering Group, the powerhouse group behind iconic luxury brands such as Gucci, Balenciaga, and Saint Laurent to name a few, she leverages over ten years in conversion rate optimization to help some of the largest luxury brands build dazzling digital experiences.
Before joining Kering, Anaïs worked across various industries, from travel giant Expedia to luxury group LVMH. Her unique position involves analyzing business performance across multiple luxury brands, helping them make data-driven decisions while respecting their distinct artistic visions. As a long-term AB Tasty customer and frequent speaker at industry events, Anaïs brings a rare perspective on how luxury brands navigate the delicate balance between brand image and business optimization.
Anaïs Levy spoke with AB Tasty’s Head of Marketing and host of “The 1000 Experiments Club” podcast, John Hughes, about navigating creative constraints in luxury experimentation, leveraging cross-brand benchmarking to drive results, and how omnichannel thinking is revolutionizing conversion rate optimization in the luxury space.
Here are some of the takeaways from their conversation.
Beyond the website: Luxury’s omnichannel reality
The numbers tell a story that completely reframes how we should think about luxury e-commerce: “Among all our visitors, if we sum up visitors in the stores and visitors on our websites, the majority, like 90% is coming to the website and 10% is our traffic in store,” Anaïs shares.
But here’s the twist—most purchases still happen offline. This flips traditional CRO thinking on its head.
“When you have this overview of understanding the business, understanding how luxury websites fit into the whole customer journey, conversion rate optimization is about understanding how you make the most of each asset you have,” she explains.
For luxury brands, websites serve multiple purposes beyond direct sales. Customers use them for research and discovery, to prepare for store visits, for aspirational browsing, and to access omnichannel services like click-and-collect or appointment booking.
“We know we have aspirational customers, but we were not treating them as a specific segment. So everybody coming to the website should in the end convert. And I guess now with the rise of omnichannel and services… we have come to this conclusion that a significant amount of traffic is not going to purchase online,” Anaïs notes.
The takeaway? Stop measuring luxury e-commerce success purely on online conversion rates. Instead, it’s about thinking bigger. How does your digital experience drive overall brand engagement and omnichannel revenue?
Discover the luxury industry’s glittering guide to all things optimization.
Working with luxury brands means constant negotiation between artistic vision and business performance. “It’s a lot of compromise,” Anaïs admits. “The brand image, the design is really the voice of the artistic director.”
But here’s where persistence pays off. When faced with a creative “no,” Anaïs doesn’t give up—she waits, gathers more data, and asks again. “You have to be stubborn because it could be a no. But two months, three months, six months after you ask again and one day you would have a yes,” she explains.
Her secret weapon? Benchmark data across sister brands. When one Kering brand achieves better checkout completion rates than another, it becomes harder to argue against proven improvements.
“If your sister brands can achieve these figures and they have kind of the same backbone, the same services, same offer, it means that there is something that we are not doing right,” she points out.
This creates a unique advantage where luxury brands can iterate on proven concepts while maintaining their distinct identities. Anaïs’s team has built AB test catalogs shared across all brands and runs group-wide experimentation events to facilitate this knowledge sharing.
Think global, analyze local with segmentation
Anaïs’s team runs experiments globally but analyzes results with surgical precision. “The tip I would give to people who would listen to this podcast is really think global, because then if you make it work for most of your users, your gains are way higher,” she advises.
But the magic happens in the analysis. “When you analyze, don’t forget to try looking at some important segments. So countries could be some… We are using a lot EmotionsAI segmentation to analyze the results because it gives you ideas about why the ‘Competition’ segment didn’t like these experiments,” she explains.
This granular approach reveals opportunities for personalization. By breaking down results by country, device, and behavioral and emotional segments, teams uncover insights that would be invisible in aggregate data.
The strategy works because it balances efficiency with insight: global rollouts maximize impact and streamline development, while segmented analysis reveals why certain groups respond differently, creating opportunities for follow-up experiments that target specific segments with tailored experiences.
What else can you learn from our conversation with Anaïs Levy?
The surprising price experiment: How removing prices from product listing pages actually increased conversions by focusing attention on products rather than cost
AI’s luxury future: From productivity tools to conversational search that mimics in-store personal shopping experiences
The newsletter discovery: How a failed lazy-loading test accidentally revealed hidden engagement opportunities in page footers
Cross-brand collaboration: The internal tools and processes that help luxury brands share learnings while maintaining their unique identities
About Anaïs Levy
Anaïs Levy has over ten years of experience in conversion rate optimization, spanning industries from travel (Expedia) to luxury (LVMH, Kering). At Kering Group, she manages business performance and insights across multiple luxury brands, including Gucci, Saint Laurent, and Balenciaga. Her unique role involves balancing data-driven optimization with the creative constraints of luxury brand management, making her a sought-after speaker on experimentation in highly regulated creative industries.
About 1,000 Experiments Club
The 1,000 Experiments Club is an AB Tasty-produced podcast hosted by John Hughes, Head of Marketing at AB Tasty. Join John as he sits down with the experts in the world of experimentation to uncover their insights on what it takes to build and run successful experimentation programs.
Building a culture of experimentation requires an appetite for iteration, a fearless approach to failure and a test-and-learn mindset. The 1000 Experiments Club podcast digs into all of that and more with some of the most influential voices in the industry.
From CEOs and Founders to CRO Managers and more, these experts share the lessons they’ve learned throughout their careers in experimentation at top tech companies and insights on where the optimization industry is heading.
Whether you’re an A/B testing novice or a seasoned pro, here are some of our favorite influencers in CRO and experimentation that you should follow:
Ronny Kohavi
Ronny Kohavi, a pioneer in the field of experimentation, brings over three decades of experience in machine learning, controlled experiments, AI, and personalization.
He was a Vice President and Technical Fellow at Airbnb. Prior to that, he was Technical Fellow and Corporate Vice President at Microsoft, where he led the analysis and experimentation team (ExP). Before that, he was Director of Personalization and Data Mining at Amazon.
Ronny teaches an online interactive course on Accelerating Innovation with A/B Testing, which was attended by over 800 students
Ronny’s work has helped lay the foundation for modern online experimentation, influencing how some of the world’s biggest companies approach testing and decision-making.
He advocates for a gradual rollout approach over the typical 50/50 split at launch:
“One thing that turns out to be really useful is to start with a small ramp-up. Even if you plan to go to 50% control and 50% treatment, start at 2%. If something egregious happens—like a metric dropping by 10% instead of the 0.5% you’re monitoring for—you can detect it in near real time.”
This slow ramp-up helps teams catch critical issues early and protect user experience.
Talia Wolf is a conversion optimization specialist and founder & CEO of Getuplift, where she helps businesses boost revenue, leads, engagement, and sales through emotional targeting, persuasive design, and behavioral data.
She began her career at a social media agency, where she was introduced to CRO, then served as Marketing Director at monday.com before launching her first agency, Conversioner, in 2013.
Talia teaches companies to optimize their online presence using emotionally-driven strategies. She emphasizes that copy and visuals should address customers’ needs rather than focusing solely on the product.
For Talia, emotional marketing is inherently customer-centric and research-based. From there, experiments can be built into A/B testing platforms using a clear North Star metric—whether checkouts, sign-ups, or add-to-carts—to validate hypotheses and drive growth.
Elissa Quinby is the Head of Product Marketing at e-commerce acceleration platform Pattern, with a career rooted in retail, marketing, and customer experience.
Before joining Pattern, she led retail marketing as Senior Director at Quantum Metric. She began her career as an Assistant Buyer at American Eagle Outfitters, then spent two years at Google as a Digital Marketing Strategist. Elissa went on to spend eight years at Amazon, holding roles across marketing, program management, and product.
Elissa emphasizes the importance of starting small to build trust with new customers. “The goal is to offer value in exchange for data,” she explains, pointing to first-party data as the “secret sauce” behind many successful companies.
She encourages brands to experiment with creative ways of gathering customer information—always with trust at the center—so they can personalize experiences and deepen customer understanding over time.
Lukas Vermeer, Director of Experimentation at Vista, is an expert in designing, implementing, and scaling experimentation programs. He previously spent over eight years at Booking.com, where he held roles as a product manager, data scientist, and ultimately Director of Experimentation.
With a background in machine learning and AI, Lukas specializes in building the infrastructure and processes needed to scale testing and drive business growth. He also consults with companies to help them launch and accelerate their experimentation efforts.
Given today’s fast-changing environment, Lukas believes that roadmaps should be treated as flexible guides rather than rigid plans: “I think roadmaps aren’t necessarily bad, but they should acknowledge the fact that there is uncertainty. The deliverable should be clarifications of that uncertainty, rather than saying, ‘In two months, we’ll deliver feature XYZ.’”
Instead of promising final outcomes, Lukas emphasizes embracing uncertainty to make better, data-informed decisions.
Jonny Longden is the Chief Growth Officer at Speero, with over 17 years of experience improving websites through data and experimentation. He previously held senior roles at Boohoo Group, Journey Further, Sky, and Visa, where he led teams across experimentation, analytics, and digital product.
Jonny believes that smaller companies and startups—especially in their early, exploratory stages—stand to benefit the most from experimentation. Without testing, he argues, most ideas are unlikely to succeed.
“Without experimentation, your ideas are probably not going to work,” Jonny says. “The things that seem obvious often don’t deliver results, and the ideas that seem unlikely or even a bit silly can sometimes have the biggest impact.”
For Jonny, experimentation isn’t just a tactic—it’s the only reliable way to uncover what truly works and drive meaningful, data-backed progress.
Ruben de Boer is a Lead CRO Manager at Online Dialogue and founder of Conversion Ideas, with over 14 years of experience in data and optimization.
At Online Dialogue, he leads the team of Conversion Managers—developing skills, maintaining quality, and setting strategy and goals. Through his company, Conversion Ideas, Ruben helps people launch their careers in CRO and experimentation by offering accessible, high-quality courses and resources.
Ruben believes experimentation shouldn’t be judged solely by outcomes. “Roughly 25% of A/B tests result in a winner, meaning 75% of what’s built doesn’t get released—and that can feel like failure if you’re only focused on output,” he explains.
Instead, he urges teams to shift their focus to customer-centric insights. When the goal becomes understanding the user—not just releasing features—the entire purpose of experimentation evolves.
David Mannheim is a digital experience strategist with over 15 years of expertise helping brands like ASOS, Sports Direct, and Boots elevate their conversion strategies.
He is the CEO and founder of Made With Intent, focused on advancing innovative approaches to personalization through AI. Previously, he founded User Conversion, which became one of the UK’s largest independent CRO consultancies.
David recently authored a book exploring what he calls the missing element in modern personalization: the person. “Remember the first three syllables of personalization,” he says. “That often gets lost in data.”
He advocates for shifting focus from short-term gains to long-term customer value—emphasizing metrics like satisfaction, loyalty, and lifetime value over volume-based wins.
“More quality than quantity,” David explains, “and more recognition of the intangibles—not just the tangibles—puts brands in a much better place.”
Marianne Stjernvall has over a decade of experience in CRO and experimentation, having executed more than 500 A/B tests and helped over 30 organizations grow their testing programs.
Marianne is the founder of Queen of CRO and co-founder of ConversionHub, Sweden’s most senior CRO agency. As an established CRO consultant, she helps organizations build experimentation-led cultures grounded in data and continuous learning.
Marianne also teaches regularly, sharing her expertise on the full spectrum of CRO, A/B testing, and experimentation execution.
She stresses the importance of a centralized testing approach:
“If each department runs experiments in isolation, you risk making decisions based on three different data sets, since teams will be analyzing different types of data. Having clear ownership and a unified framework ensures the organization works cohesively with tests.”
Ben Labay is the CEO of Speero, blending academic rigor in statistics with deep expertise in customer experience and UX.
Holding degrees in Evolutionary Behavior and Conservation Research Science, Ben began his career as a staff researcher at the University of Texas, specializing in data modeling and research.
This foundation informs his work at Speero, where he helps organizations leverage customer data to make better decisions.
Ben emphasizes that insights should lead to action and reveal meaningful patterns. “Every agency and in-house team collects data and tests based on insights, but you can’t stop there.”
Passionate about advancing experimentation, Ben focuses on developing new models, applying game theory, and embracing bold innovation to uncover bigger, disruptive insights.
André Morys, CEO and founder of konversionsKRAFT, has nearly three decades of experience in experimentation, digital growth, and e-commerce optimization.
Fueled by a deep fascination with user and customer experience, André guides clients through the experimentation process using a blend of data, behavioral economics, consumer psychology, and qualitative research.
He believes the most valuable insights lie beneath the surface. “Most people underestimate the value of experimentation because of the factors that are hard to measure,” André explains.
“You cannot measure the influence of experimentation on your company’s culture, yet that impact may be ten times more important than the immediate uplift you create.”
This philosophy is central to his “digital experimentation framework,” which features his signature “Iceberg Model” to capture both measurable and intangible effects of testing.
Jeremy Epperson is the founder of Thetamark and has dedicated 14 years to conversion rate optimization and startup growth. He has worked with some of the fastest-growing unicorn startups in the world, researching, building, and implementing CRO programs for more than 150 growth-stage companies.
By gathering insights from diverse businesses, Jeremy has developed a data-driven approach to identify testing roadblocks, allowing him to optimize CRO processes and avoid the steep learning curves often associated with new launches.
In his interview, Jeremy emphasizes focusing on customer experience to drive growth. He explains, “We will do better as a business when we give the customer a better experience, make their life easier, simplify conversion, and eliminate the roadblocks that frustrate them and cause abandonment.”
His ultimate goal with experimentation is to create a seamless process from start to finish.
Chad Sanderson is the CEO and founder of Gable, a B2B data infrastructure SaaS company, and a renowned expert in digital experimentation and large-scale analysis.
He is also a product manager, public speaker, and writer who has lectured on topics such as the statistics of digital experimentation, advanced analysis techniques, and small-scale testing for small businesses.
Chad previously served as Senior Program Manager for Microsoft’s AI platform and was the Personalization Manager for Subway’s experimentation team.
He advises distinguishing between front-end (client-side) and back-end metrics before running experiments. Client-side metrics, such as revenue per transaction, are easier to track but may narrow focus to revenue growth alone.
“One set of metrics businesses mess up is relying only on client-side metrics like revenue per purchase,” Chad explains. “While revenue is important, focusing solely on it can drive decisions that overlook the overall impact of a feature.”
With a background in Global Business Management and Marketing, Computer Science, and Industrial Engineering, Carlos founded Floqq—Latin America’s largest online education marketplace.
In 2014, he founded Product School, now the global leader in Product Management training.
Carlos believes experimentation has become more accessible and essential for product managers. “You no longer need a background in data science or engineering to be effective,” he says.
He views product managers as central figures at the intersection of business, design, engineering, customer success, data, and sales. Success in this role requires skills in experimentation, roadmapping, data analysis, and prototyping—making experimentation a core competency in today’s product landscape.
Bhavik Patel is the Data Director at Huel, an AB Tasty customer, and the founder of CRAP Talks, a meetup series connecting CRO professionals across Conversion Rate, Analytics, and Product.
Previously, he served as Product Analytics & Experimentation Director at Lean Convert, where he led testing and optimization strategies for top brands. With deep expertise in personalization, experimentation, and data-driven decision-making, Bhavik helps teams evolve from basic A/B testing to strategic, high-impact programs.
With a focus on experimentation, personalization, and data-driven strategy, Bhavik leads teams in creating better digital experiences and smarter testing programs.
His philosophy centers on disruptive testing—bold experiments aimed at breaking past local maximums to deliver statistically meaningful results. “Once you’ve nailed the fundamentals, it’s time to make bigger bets,” he says.
Bhavik also stresses the importance of identifying the right problem before jumping to solutions: “The best solution for the wrong problem isn’t going to have any impact.”
Rand Fishkin is the co-founder and CEO of SparkToro, creators of audience research software designed to make audience insights accessible to all.
He also founded Moz and co-founded Inbound.org with Dharmesh Shah, which was later acquired by HubSpot in 2014. Rand is a frequent global keynote speaker on marketing and entrepreneurship, dedicated to helping people improve their marketing efforts.
Rand highlights the untapped potential in niche markets: “Many founders don’t consider the power of serving a small, focused group of people—maybe only a few thousand—who truly need their product. If you make it for them, they’ll love it. There’s tremendous opportunity there.”
A strong advocate for risk-taking and experimentation, Rand encourages marketers to identify where their audiences are and engage them directly there.
Shiva Manjunath is the Senior Web Product Manager of CRO at Motive and host of the podcast From A to B. With experience at companies like Gartner, Norwegian Cruise Line, and Edible, he’s spent years digging into user behavior and driving real results through experimentation.
Shiva is known for challenging the myth of “best practices,” emphasizing that optimization requires context, not checklists. “If what you believe is this best practice checklist nonsense, all CRO is just a checklist of tasks to do on your site. And that’s so incorrect,” he says.
At Gartner, a simplified form (typically seen as a CRO win) led to a drop in conversions, reinforcing his belief that true experimentation is about understanding why users act, not just what they do.
Through his work and podcast, Shiva aims to demystify CRO and encourage practitioners to think deeper, test smarter, and never stop asking questions.
Think of heatmaps as your website’s truth-teller. They’re visual snapshots showing exactly where visitors click, scroll, and linger. No guesswork required.
Here’s how they work: Warm colors (reds, oranges) highlight the hotspots where users engage most. Cool colors (blues, greens) reveal the overlooked zones that might need attention.
The best part? Your visitors do all the heavy lifting. They show you what’s working and what’s not, so your team can make changes that actually move the needle.
Spot the signals: When to bring heatmaps into play
Heatmaps aren’t just pretty pictures—they’re your optimization toolkit’s MVP. Here’s how they deliver the biggest impact:
Measuring real engagement
Writing content that no one reads? Heatmaps show you exactly where readers drop off. If only 10% of visitors reach your CTA, it’s time to shake things up.
Tracking what matters: Actions
Are people clicking where you want them to? Heatmaps reveal if visitors complete your desired actions—or where they’re getting stuck instead.
Highlighting where attention sticks (and slips)
What grabs your attention first? What images distract from your main message? Heatmaps answer these questions so you can double down on what works.
Once you have these insights, bigger questions become easier to tackle:
Where should we place our most important content?
How can we use images and videos more effectively?
What’s pulling attention away from our goals?
The essential heatmap lineup every team needs
Most modern heatmap tools offer multiple views of user behavior. We partner closely with some of the major players already. Let’s break down the most common ones you’ll come across.
Click Heatmaps: The Action Tracker
These maps show every click on your page, with dense concentrations appearing as bright white areas surrounded by warm colors. Think of them as your conversion reality check.
What it tells you: Whether people click where you want them to—or if they’re trying to click non-clickable elements that look interactive.
How to use it: Look for clicks scattered around non-interactive text or images. These “frustrated clicks” signal design problems. If users are clicking on underlined text that isn’t a link, or images they expect to be clickable, you need to either make those elements functional or redesign them to look less interactive.
Pro tip: Compare click density on your primary CTA versus other page elements. If secondary elements are getting more clicks than your main conversion button, it’s time to redesign your visual hierarchy.
Scroll Heatmaps: The Attention Meter
See how far down visitors scroll and what percentage of users reach each section of your page. This is crucial for understanding whether your important content is actually being seen.
What it tells you: If users actually see your important content or bail before reaching your CTA. Most importantly, it shows you the “fold line”—where 50% of users stop scrolling.
How to use it: Identify the scroll percentage where you lose half your audience, then ensure all critical elements (value propositions, CTAs, key benefits) appear above that line. If your main CTA is only seen by 20% of visitors, move it higher or add secondary CTAs above the fold.
Pro tip: Use scroll maps to optimize content length. If 80% of users stop reading halfway through your blog post, either shorten the content or add more engaging elements (images, subheadings, interactive elements) to keep them scrolling.
Click Percentage Maps: The Element Analyzer
This view breaks down clicks by specific elements, showing exactly how many people clicked each button, image, or link as a percentage of total visitors.
What it tells you: Which elements deserve prime real estate and which ones are dead weight. You’ll see precise engagement rates for every clickable element on your page.
How to use it: Rank your page elements by click percentage to understand what’s actually driving engagement. If your newsletter signup gets 15% clicks but your main product CTA only gets 3%, you might need to redesign your primary call-to-action or reconsider your page goals.
Pro tip: Use this data to inform A/B tests. If one button consistently outperforms others, test applying its design (color, size, copy) to underperforming elements.
Confetti Maps: The Individual Click Tracker
Instead of showing click density, these maps display each individual click as a colored dot. Perfect for spotting users trying to click non-clickable areas or understanding click patterns in detail.
What it tells you: Where to add functionality or remove confusion. Each dot represents a real user’s intent to interact with something on your page.
How to use it: Look for clusters of dots over non-interactive elements—these represent frustrated users trying to click things that don’t work. Also watch for dots scattered far from any actual buttons or links, which might indicate responsive design issues or accidental clicks.
Pro tip: Filter confetti maps by traffic source or user segment. Mobile users might have different click patterns than desktop users, and organic traffic might behave differently than paid traffic.
Mobile-Specific Heatmaps: The Touch Tracker
Modern tools capture mobile-specific actions like taps, swipes, pinches, and multi-touch gestures—because mobile behavior is fundamentally different from desktop.
How to use it: Create separate heatmaps for mobile and desktop traffic. Mobile users typically scroll faster, have shorter attention spans, and interact differently with buttons and forms. Use this data to optimize button sizes, reduce form fields, and adjust content layout for mobile-first experiences.
Pro tip: Pay special attention to thumb-reach zones on mobile heatmaps. Elements that are easy to tap with a thumb (bottom third of screen, right side for right-handed users) typically get higher engagement rates.
Learn more about best practices for designing for mobile experiences with our Mobile Optimization Guide.
Eyes vs. clicks: Understanding the key differences
While heatmaps track mouse movements and clicks, eye-tracking follows actual gaze patterns. Eye-tracking gives deeper insights but requires specialized equipment most teams don’t have.
The good news? AI-powered tools like Feng-Gui and EyeQuant now simulate eye-tracking through algorithms, making this technology more accessible.
Bottom line: Start with heatmaps. They’re easier to implement and give you actionable insights right away.
Features that make or break your heatmapping game
Not all heatmap tools are created equal. Here’s what your team should prioritize:
Must-have features:
Audience Segmentation: Create maps for specific user groups (new vs. returning visitors, mobile vs. desktop)
Map Comparison: Easily compare results across different segments
Page Templates: Aggregate data for similar page types (crucial for e-commerce sites)
Mobile Optimization: Track touch, scroll, and swipe behaviors
Export Capabilities: Share results with your team effortlessly
Dynamic Element Tracking: Capture interactions with dropdowns, sliders, and AJAX-loaded content
Historical Data: Preserve old heatmaps even after design changes
Test smarter with heatmap insights
Here’s where things get exciting. Heatmaps show you the problems, but how do you know if your fixes actually work?
Enter A/B testing.
This three-step approach turns insights into results:
Identify problems with heatmaps
Test potential solutions with A/B testing
Choose the highest-performing solution based on data
Real Example:
Nonprofit UNICEF France wanted to better understand how visitors perceived its homepage ahead of a major redesign.
Their move: UNICEF France combined on-site surveys with heatmapping to gather both qualitative feedback and visual behavioral data.
The result: Heatmaps showed strong engagement with the search bar, while surveys confirmed it was seen as the most useful element. Less-used features, like social share icons, were removed in the redesign—resulting in a cleaner, more user-focused homepage.
Ready to put heatmaps to work? Here’s your game plan:
Start small. Pick one high-traffic page and run your first heatmap analysis.
Look for patterns. Are users clicking where you expect? Scrolling to your key content? Getting stuck somewhere?
Test your hunches. Use A/B testing to validate any changes before rolling them out site-wide.
Iterate forward. Heatmaps aren’t a one-and-done tool but part of your ongoing optimization process.
Remember: every click tells a story. Every scroll reveals intent. Your visitors are already showing you how to improve—you just need to listen.
Ready to see what your visitors are really doing? Heatmaps give you the insights. A/B testing helps you act on them. Together, they’re your path to better conversions and happier users.
Transaction testing, which focuses on increasing the rate of purchases, is a crucial strategy for boosting your website’s revenue.
To begin, it’s essential to differentiate between conversion rate (CR) and average order value (AOV), as they provide distinct insights into customer behavior. Understanding these metrics helps you implement meaningful changes to improve transactions.
In this article, we’ll delve into the complexities of transaction metrics analysis and introduce our new tool, the “Report Copilot,” designed to simplify report analysis. Read on to learn more.
Transaction Testing
To understand how test variations impact total revenue, focus on two key metrics:
Conversion Rate (CR): This metric indicates whether sales are increasing or decreasing. Tactics to improve CR include simplifying the buying process, adding a “one-click checkout” feature, using social proof, or creating urgency through limited inventory.
Average Order Value (AOV): This measures how much each customer is buying. Strategies to enhance AOV include cross-selling or promoting higher-priced products.
By analyzing CR and AOV separately, you can pinpoint which metrics your variations impact and make informed decisions before implementation. For example, creating urgency through low inventory may boost CR but could reduce AOV by limiting the time users spend browsing additional products. After analyzing these metrics individually, evaluate their combined effect on your overall revenue.
Revenue Calculation
The following formula illustrates how CR and AOV influence revenue:
Revenue=Number of Visitors×Conversion Rate×AOV
In the first part of the equation (Number of Visitors×Conversion Rate), you determine how many visitors become customers. The second part (×AOV) calculates the total revenue from these customers.
Consider these scenarios:
If both CR and AOV increase, revenue will rise.
If both CR and AOV decrease, revenue will fall.
If either CR or AOV increases while the other remains stable, revenue will increase.
If either CR or AOV decreases while the other remains stable, revenue will decrease.
Mixed changes in CR and AOV result in unpredictable revenue outcomes.
The last scenario, where CR and AOV move in opposite directions, is particularly complex due to the variability of AOV. Current statistical tools struggle to provide precise insights on AOV’s overall impact, as it can experience significant random fluctuations. For more on this, read our article “Beyond Conversion Rate.”
While these concepts may seem intricate, our goal is to simplify them for you. Recognizing that this analysis can be challenging, we’ve created the “Report Copilot” to automatically gather and interpret data from variations, offering valuable insights.
Report Copilot
The “Report Copilot” from AB Tasty automates data processing, eliminating the need for manual calculations. This tool empowers you to decide which tests are most beneficial for increasing revenue.
Here are a few examples from real use cases.
Winning Variation:
The left screenshot provides a detailed analysis, helping users draw conclusions about their experiment results. Experienced users may prefer the summarized view on the right, also available through the Report Copilot.
Complex Use Case:
The screenshot above demonstrates a case where CR and OAV have opposite trends and need a deeper understanding of the context.
It’s important to note that the Report Copilot doesn’t make decisions for you; it highlights the most critical parts of your analysis, allowing you to make informed choices.
Conclusion
Transaction analysis is complex, requiring a breakdown of components like conversion rate and average order value to better understand their overall effect on revenue.
We’ve developed the Report Copilot to assist AB Tasty users in this process. This feature leverages AB Tasty’s extensive experimentation dashboard to provide comprehensive, summarized analyses, simplifying decision-making and enhancing revenue strategies.
What is the future of experimentation? Bhavik Patel highlights the importance of strategic planning and innovation to achieve meaningful results.
A thought leader in the worlds of CRO and experimentation, Bhavik Patel founded popular UK-based meetup community, CRAP (Conversion Rate, Analytics, Product) Talks, seven years ago to fill a gap in the event market – opting to cover a broad range of optimization topics from CRO,data analysis, and product management to data science, marketing, and user experience.
After following his passion throughout the industry from acquisition growth marketing to experimentation and product analytics, Bhavik landed the role of Product Analytics & Experimentation Director at product measurement consultancy, Lean Convert, where his interests have converged. Here he is scaling a team and supporting their development in data and product thinking, as well as bringing analytical and experimentation excellence into the organization.
AB Tasty’s CMO Marylin Montoya spoke with Bhavik about the future of experimentation and how we might navigate the journey from the current mainstream approach to the potentialities of AI technology.
Here are some of the key takeaways from their conversation.
The evolution of experimentation: a scientific approach.
Delving straight to the heart of the conversation, Bhavik talks us through the evolution of A/B testing, from its roots in the scientific method, to recent and even current practices – which involve a lot of trial and error to test basic variables. When projecting into the future, we need to consider everything from people, to processes, and technology.
Until recently, conversion rate optimization has mostly been driven by marketing teams, with a focus on optimizing the basics such as headlines, buttons, and copy. Over the last few years, product development has started to become more data driven. Within the companies taking this approach, the product teams are the recipients of the A/B test results, but the people behind these tests are the analytical and data science teams, who are crafting new and advanced methods, from a statistical standpoint.
Rather than making a change on the homepage and trying to measure its impact on outcome metrics, such as sales or new customer acquisition, certain organizations are taking an alternative approach modeled by their data science teams: focusing on driving current user activity and then building new products based on that data.
The future of experimentation is born from an innovative mindset, but also requires critical thinking when it comes to planning experiments. Before a test goes live, we must consider the hypothesis that we’re testing, the outcome metric or leading indicators, how long we’re going to run it, and make sure that we have measurement capabilities in place. In short, the art of experimentation is transitioning from a marketing perspective to a science-based approach.
Why you need to level up your experiment design today.
While it may be a widespread challenge to shift the mindset around data and analyst teams from being cost centers to profit-enablement centers, the slowing economy might have a silver lining: people taking the experimentation process a lot more seriously.
We know that with proper research and design, an experiment can achieve a great ROI, and even prevent major losses when it comes to investing in new developments. However, it can be difficult to convince leadership of the impact, efficiency and potential growth derived from experimentation.
Given the current market, demonstrating the value of experimentation is more important than ever, as product and marketing teams can no longer afford to make mistakes by rolling out tests without validating them first, explains Bhavik.
Rather than watching your experiment fail slowly over time, it’s important to have a measurement framework in place: a baseline, a solid hypothesis, and a proper experiment design. With experimentation communities making up a small fraction of the overall industry, not everyone appreciates the ability to validate, quantify, and measure the impact of their work, however Bhavik hopes this will evolve in the near future.
Disruptive testing: high risk, high reward.
On the spectrum of innovation, at the very lowest end is incremental innovation, such as small tests and continuous improvements, which hits a local maximum very quickly. In order to break through that local maximum, you need to try something bolder: disruptive innovation.
When an organization is looking for bigger results, they need to switch out statistically significant micro-optimizations for experiments that will bring statistically meaningful results.
Once you’ve achieved better baseline practices – hypothesis writing, experiment design, and planning – it’s time to start making bigger bets and find other ways to measure it.
Now that you’re performing statistically meaningful tests, the final step in the evolution of experimentation is reverse-engineering solutions by identifying the right problem to solve. Bhavik explains that while we often focus on prioritizing solutions, by implementing various frameworks to estimate their reach and impact, we ought to take a step back and ask ourselves if we’re solving the right problem.
With a framework based on quality data and research, we can identify the right problem and then work on the solution, “because the best solution for the wrong problem isn’t going to have any impact,” says Bhavik.
What else can you learn from our conversation with Bhavik Patel?
The common drivers of experimentation and the importance of setting realistic expectations with expert guidance.
The role of A/B testing platforms in the future of experimentation: technology and interconnectivity.
The potential use of AI in experimentation: building, designing, analyzing, and reporting experiments, as well as predicting test outcomes.
The future of pricing: will AI enable dynamic pricing based on the customer’s behavior?
About Bhavik Patel
A seasoned CRO expert, Bhavik Patel is the Product Analytics & Experimentation Director at Lean Convert, leading a team of optimization specialists to create better online experiences for customers through experimentation, personalization, research, data, and analytics. In parallel, Bhavik is the founder of CRAP Talks, an acronym that stands for Conversion Rate, Analytics and Product, which unites CRO enthusiasts with thought leaders in the field through inspiring meetup events – where members share industry knowledge and ideas in an open-minded community.
About 1,000 Experiments Club
The 1,000 Experiments Club is an AB Tasty-produced podcast hosted by John Hughes, Head of Marketing at AB Tasty. Join John as he sits down with the experts in the world of experimentation to uncover their insights on what it takes to build and run successful experimentation programs.
In the fast-paced world of digital marketing, settling for anything less than the best user experience is simply not an option.
Every marketing strategy has room for improvement and unlocking more comes from recognizing hidden opportunities.
With analytics data and a little bit of creativity, you can uncover some valuable insights on how to optimize your conversion rate on your website or campaign landing pages. However, achieving structured and streamlined data from your assumptions requires diligent testing.
Marketing professionals have steadily used different testing methodologies such as A/B testing, split testing, multivariate testing and multipage testing to increase conversion rates and enhance digital performance.
Experimenting and testing are essential as they eliminate opinions and bias from the decision-making process, ensuring data-driven decisions.
With the availability of many diverse testing options, it can be challenging to find your starting point. In this article, we’ll dive into the specifics of different forms of testing to help you navigate this testing landscape.
What is A/B testing?
A/B testing is a method of website optimization where you are comparing two versions of the same page: variation A and variation B. For the comparison, it’s common to look at the conversion rates and metrics that matter to your business (clicks, page views, purchases, etc) while using live traffic.
It’s also possible to do an A/B/C/D test when you need to test more than two content variations. The A/B/C/D method will allow you to test three or more variations of a page at once instead of testing only one variation against the control version of the page.
When to use A/B tests?
A/B tests are an excellent method to test radically different ideas for conversion rate optimization or small changes on a page.
A/B testing is the right method to choose if you don’t have a large amount of traffic to your site. Why is this? A/B tests can deliver reliable data very quickly, without a large amount of traffic. This is a great approach to experimentation to maximize test time to achieve fast results.
If you have a high-traffic website, you can evaluate the performance of a much broader set of variations. However, there is no need to test 20 different variations of the same element, even if you have adequate traffic. It’s important to have a strategy when approaching experimentation.
Want to start testing?AB Tasty is the best-in-class experience optimization platform that empowers you to create a richer digital experience – fast. From experimentation to personalization, this solution can help you activate and engage your audience to boost your conversions.
Split testing vs A/B testing
A/B tests and split tests are essentially the same concept.
“A/B” refers to the two variations of the same URL where changes are made “live” using Javascript on the original page. SaaS tools that provide you with a visual editor, like AB Tasty, allow you to create these changes quickly without technical knowledge.
Meanwhile, “split” refers to the traffic redirection towards one variation or another, each hosted on its own URL and fully redesigned in the code.
You can consider A/B tests to work the same as split tests.
The variation page may differ in many aspects depending on the testing hypothesis you put forth and your industry goals (layout, design, pictures, headlines, sub-headlines, calls to action, offers, button colors, etc.).
In any case, the number of conversions on each page’s variation is compared once each variation gets enough visitors.
In A/B tests, the impact of the design as a whole is tracked, not individual elements – even though many design elements might be changed on variations simultaneously.
TIP:Keep in mind that testing is all about comparing the performances of variations. It’s recommended not to make too many changes between the control and variation versions of the page at the same time. You should limit the number of changes to better understand the impact of the results. In the long term, a continuous improvement process will lead to better and lasting performance.
What is multivariate testing?
Multivariate tests or multi-variant tests are the same as A/B tests in their core mechanism and philosophy. The difference is that multivariate testing allows you to compare a higher number of variables and the interactions between each other. In other words, you can test and track changes to multiple sections on a single page.
For multivariate testing, you need to identify a few key page sections and then create variations for those sections specifically. You aren’t creating variations of a whole page as you do while A/B testing.
TIP:Use multivariate testing when several element combinations on your website or landing page are called into question.
Multivariate testing reveals more information about how these changes to multiple sections interact with one another. In multivariate tests, website traffic is split into each possible combination of a page – where the effectiveness of the changes is measured.
It’s very common to use multivariate testing to optimize an existing website or landing page without making a significant investment in redesign.
Although this type of testing can be perceived as an easier way of experimentation – keep in mind that multivariate testing is more complicated than traditional A/B testing.
Multivariate tests are best suited for more advanced testers because they give many more possibilities of combinations for visitors to experience on your website. Too many changes on a page at once can quickly add up. You don’t want to be left with a very large number of combinations that must be tested.
Multivariate test example
Let’s say that you’ve decided to run a multivariate test on one of your landing pages. You choose to change two elements on your landing page. On the first variation, you swap an image for a video, and on the second variation, you swap the image for a slider.
For each page variation, you add another version of the headline. This means that now you have three versions of the main content and two versions of the headline. This is equal to six different combinations of the landing page.
Image
Video
Slider
Headline 1
Combination 1
Combination 2
Combination 3
Headline 2
Combination 4
Combination 5
Combination 6
After only changing two sections, you quickly have six variations. This is where multivariate testing can get tricky.
When to use multivariate testing?
Multivariate tests are recommended for sites with a large amount of daily traffic. You will need a site with a high volume of traffic to test multiple combinations, and it will take a longer time to obtain meaningful data from the test.
AB Tasty’s reporting allows you to weigh up each element’s impact on the conversion rate
The multivariate testing method will allow you to incrementally improve an existing design, while the test results can be used to apply to a larger website or landing page redesign.
What is multipage testing?
Multipage testing is an experimentation method similar to standard A/B testing. As we’ve discussed, in A/B testing, changes can be made to one specific page or to a group of pages.
If the changed element appears on several pages, you can choose whether or not to change it on each page. However, if the element is on several pages but it’s not identical, appears at a different place or has a different name, you’ll have to set up a multipage test.
Multipage tests allow you to implement changes consistently over several pages.
This means that multipage tests allow you to link together variations of different pages and are especially useful when funnel testing.
In multipage tests, site visitors are funneled into one funnel version or the other. You need to track the way visitors interact with the different pages they are shown so you can determine which funnel variation is the most effective.
You must ensure that the users see a consistent variation of changes throughout a set of pages. This is key to getting usable data and allows one variation to be fairly tested against another.
Multipage test example
Let’s say you want to conduct a multipage test with a free shipping coupon displayed in the funnel at different places. You want to run the results of this test against the original purchase funnel without a coupon.
For example, you could offer visitors a free shipping coupon on a product category page – where they can see “Free shipping over €50” as a static banner on the page. Once the visitor adds a product to the shopping cart, you can show them a new dynamic message according to the cart balance – “Add €X to your cart for free shipping”.
In this case, you can experiment with the location of the message (near the “Proceed to checkout” button, near the “Continue shopping” button, near the shipping cost for his order or somewhere else) and with the call-to-action variations of the message.
This kind of test will help you understand visitors’ purchase behavior better – i.e. how does the placement of a free shipping coupon reduce shopping cart abandonment and increase sales? After enough visitors come to the end of the purchase funnel through the different designs, you will be able to compare the effect of design styles easily and effectively.
How to test successfully?
Remember that the pages being tested need to receive substantial traffic so the tests will give you some relevant data to analyze.
Whether you use A/B testing, split testing, multivariate testing or multipage testing to increase your conversion rate or performance, remember to use them wisely.
Each type of test has its own requirements and is uniquely suited to specific situations, with advantages and disadvantages.
Using the proper test for the right situation will help you get the most out of your site and the best return on investment for your testing campaign. Even though testing follows a scientific method, there is no need for a degree in statistics when working with AB Tasty.
Incomplete, irrelevant or poorly formulated A/B test hypotheses are at the root of many neutral or negative tests.
Often we imagine that doing A/B tests to improve your e-commerce site’s performance means quickly changing the color of the “add to cart” button will lead to a drastic increase in your conversion rate, for example. However, A/B testing is not always so simple.
Unfortunately, implementing random changes to your pages won’t always significantly improve your results – there should be a reason behind your web experiments.
This brings us to the following question: how do you know which elements to experiment with and how can you create an effective AB test hypothesis?
Determine the problem and the hypothesis
Far too few people question the true origins of the success (or failure) of the changes they put in place to improve their conversion rate.
However, it’s important to know how to determine both the problem and the hypothesis that will allow you to obtain the best results.
Instead of searching for a quick “DIY” solution, it’s often more valuable in the long term to take a step back and do two things:
Identify the real problem – What is the source of your poor performance? Is it a high bounce rate on your order confirmation page, too many single-page sessions, a low-performing checkout CTA or something more complex?
Establish a hypothesis – This could show the root of the problem. For example, a great hypothesis for A/B testing could be: “Our customers do not immediately understand the characteristics of our products when they read the pages on our e-commerce site. Making the information more visible will increase the clicks on the “add-to-cart” button.”
The second step may seem very difficult because it requires a capacity for introspection and a critical look at the existing site. Nevertheless, it’s crucial for anyone who wants to see their KPIs improve drastically.
If you’re feeling a bit uncomfortable with this type of uncertainty around creating an effective hypothesis, know that you’ve come to the right place.
What is an A/B test hypothesis?
Technically speaking, the word hypothesis has a very simple definition:
“A proposal that seeks to provide a plausible explanation of a set of facts and which must be controlled against experience or verified in its consequences.”
The first interesting point to notice in this definition is “the set of facts to be explained.” In A/B testing, a hypothesis must always start with a clearly identified problem.
A/B tests should not be done randomly, or you risk wasting time.
Let’s talk about how to identify the problem:
Web analytics data – While this data does not explain digital consumers’ behavior exactly, it can highlight conversion problems (identifying abandoned carts, for example) and help prioritize the pages in need of testing.
Heuristic evaluation and ergonomic audit – These analyses allow you to assess the site’s user experience at a lower cost using an analysis grid.
User tests – This qualitative data is limited by the sample size but can be very rich in information that would not have been detected with quantitative methods. They often reveal problems understanding the site’s ergonomics. Even if the experience can be painful given the potential for negative remarks, it will allow you to gather qualified data with precise insights.
Eye tracking or heatmaps – These methods provide visibility into how people interact with items within a page – not between pages.
Customer feedback – As well as analyzing feedback, you can implement tools such as customer surveys or live chats to collect more information.
The tactics above will help you highlight the real problems that impact your site’s performance and save you time and money in the long run.
A/B test hypothesis formula
Initially, making an A/B test hypothesis may seem too simple. At the start, you mainly focus on one change and the effect it produces. You should always respect the following format: If I change this, it will cause that effect. For example:
Changing (the element being tested) from ___________ to ___________ will increase/decrease (the defined measurement).
At this stage, this formula is only a theoretical assumption that will need to be proven or disproven, but it will guide you in solving the problem.
An important point, however, is that the impact of the change you want to bring must always be measurable in quantifiable terms (conversion rate, bounce rate, abandonment rate, etc.).
Here are two examples of hypotheses phrased according to the formula explained above and that can apply to e-commerce:
Changing our CTA from “BUY YOUR TICKETS NOW” to “TICKETS ARE SELLING FAST – ONLY 50 LEFT!” will improve our sales on our e-commerce site.
Shortening the sign-up form by deleting optional fields such as phone and mailing address will increase the number of contacts collected.
In addition, when you think about the solution you want to implement, include the psychology of the prospect by asking yourself the following:
What psychological impact could the problem cause in the digital consumer’s mind?
For example, if your problem is a lack of clarity in the registration process which impacts the purchases, then the psychological impact could be that your prospect is confused when reading information.
With this in mind, you can begin to think concretely about the solution to correct this feeling on the client side. In this case, we can imagine that one fix could be including a progress bar that shows the different stages of registration.
Be aware: the psychological aspect should not be included when formulating your test hypothesis.
Once you have gotten the results, you should then be able to say whether it is true or false. Therefore, we can only rely on concrete and tangible assumptions.
Best practice for e-commerce optimization based on A/B hypotheses
There are many testable elements on your website. Looking into these elements and their metrics can help you create an effective test hypothesis.
We are going to give you some concrete examples of common areas to test to inspire you on your optimization journey:
HOMEPAGE
The header/main banner explaining the products/services that your site offers can increase customers’ curiosity and extend their time on the site.
A visible call-to-action appearing upon arrival will increase the chance visitors will click.
A very visible “about” section will build prospects’ trust in the brand when they arrive on the site.
PRODUCT SECTIONS
Filters save customers a lot of time by quickly showing them what they are looking for.
Highlighting a selection of the most popular products at the top of the sections is an excellent starting point for generating sales.
A “find out more” button or link under each product will encourage users to investigate.
PRODUCT PAGES
Product recommendations create a more personal experience for the user and help increase their average shopping cart
A visible “add to cart” button will catch the prospect’s attention and increase the click rate.
An “add to cart and pay” button saves the customer time, as many customers have an average of one transaction at a time.
Adding social sharing buttons is an effective way of turning the product listing into viral content.
Want to start A/B testing elements on your website?AB Tasty is the best-in-class experience optimization platform to help you convert more customers by leveraging intelligent search and recommendations to create a richer digital experience – fast. From experimentation to personalization, this solution can help you achieve the perfect digital experience with ease.
CART PAGE
The presence of logos such as “Visa certified” enhances customer confidence in the site.
A very visible button/link to “proceed to payment” greatly encourages users to click.
PAYMENT
A single page for payment reduces the exit rate.
Paying for an order without registration is very much appreciated by new prospects, who are not necessarily inclined to share their personal information when first visiting the site.
Having visibility over the entire payment process reassures consumers and will nudge them to finalize their purchase.
These best practices allow you to build your A/B test hypotheses by comparing your current site with the suggestions above and see what directly impacts conversion performance.
The goal of creating an A/B test hypothesis
The end goal of creating an A/B test hypothesis is to identify quickly what will help guarantee you the best results. Whether you have a “winning” hypothesis or not, it will still serve as a learning experience.
While defining your hypotheses can seem complex and methodical, it’s one of the most important ways for you to understand your pages’ performance and analyze the potential benefits of change.
Have you been dreaming of an email marketing campaign to generate more revenue? If so, you’ve come to the right place.
Whether you’re in B2B or B2C marketing, it’s no secret that email marketing is a super effective way to communicate with your customers on your terms.
In fact, according to EMarketer, 80% of retail professionals quote email marketing as their greatest driver of customer retention.
However, email marketing has evolved so much over the years.
In order to connect with your customers, increase sales, onboard customers, move buyers down the purchasing funnel, or achieve other goals, you have to get personal.
Consumers want personalized content; therefore, they’re likely to react better to all personalized forms of communication – specifically, email remarketing campaigns.
In other words, email remarketing campaigns are a great resource for you to connect with your consumer and generate more revenue.
Email remarketing defined
Email remarketing consists of capturing and using information about your customers in order to achieve better marketing results through personalized email marketing campaigns.
When a visitor browses a website, marketers can access navigation information using a browser cookie. A browser cookie is a small file that tracks behavior and actions for each visit.
Similar to retargeted ads, email retargeting campaigns use behavioral and action-based information to help tailor personalized email campaigns. However, email retargeting can also be used to generate retargeted ads on social media and display networks.
Now let’s discuss why you should use email remarketing.
Why you should start email remarketing
Email remarketing campaigns allow marketers to produce highly targeted, highly converting campaigns.
Because they work on the same principles found in retargeted ads, email remarketing can achieve better marketing results compared to traditional digital advertising like Facebook Ads and Google AdWords campaigns.
Let’s see what email remarketing can do.
1. Re-engage your customers
Let’s take a look at a typical situation: Most visitors visit one or two product pages before leaving your website altogether.
So, how can you re-engage these visitors?
Email remarketing can use tracked information to display relevant ads in emails. You can re-engage visitors by showing them special offers related to the product they just saw.
If used wisely, email retargeting helps your company re-engage inactive customers and increase customer retention among active users.
2. Achieve better clickthrough rates
Email remarketing allows for personalized and relevant ads.
According to data collected by SuperOffice, emails that are segmented, or targeted to a specific group of people, perform almost 40% better than a general email.
Imagine what you could do with a 40% increase in your open rate.
3. Drive more sales
With increased clickthrough rates and more chances to convert, your retargeted customers are likely to bring in more revenue for your company.
In fact, Hal Open Science reports that email remarketing conversions can help you increase your overall conversions by 10%.
That’s because your campaigns target just the right person at the right time.
4. Reduce shopping cart abandonment
One could say that email remarketing was basically invented to reduce cart abandonment.
According to the Baymard Institute, nearly 70% of shoppers abandon their carts. Email remarketing is a huge opportunity to remind shoppers of what they’ve been browsing and to recover this “lost sale.”
At the same time as you remind your customers about their desired products, email remarketing produces a fear of missing out (FOMO) effect. Your customer will feel light pressure as this might just be their last chance to buy that product at a discounted price.
5 examples of email remarketing campaigns
1. FOODPANDA: FoodTech
FoodPanda knows that hunger cannot wait. In the image above you can see that they retarget with two magical words: “FREE+DELIVERY”
A simple free delivery offer could be all it takes to convince your customer to try a new restaurant that they’re already been looking at.
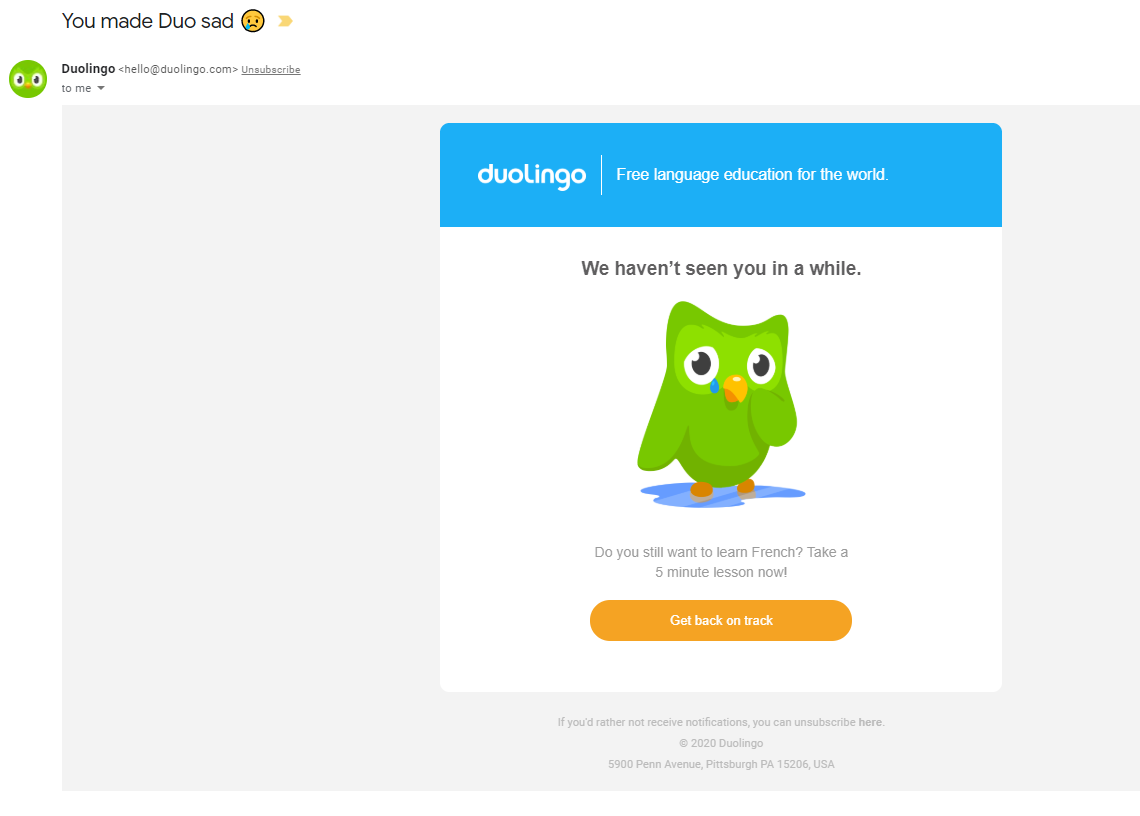
2. DUOLINGO: EducationalTech
Duolingo, a language-learning app, applies a different approach in its remarketing campaign: emotion.
If you haven’t used the app recently, they let you know that you haven’t been seen in a while and that it’s time to get back on track with your learning.
They even take it to another level by mentioning that you’ve made Duo the owl, the face of their app, sad because of your absence.
This is a great way to apply human emotion to a remarketing campaign to re-engage users.
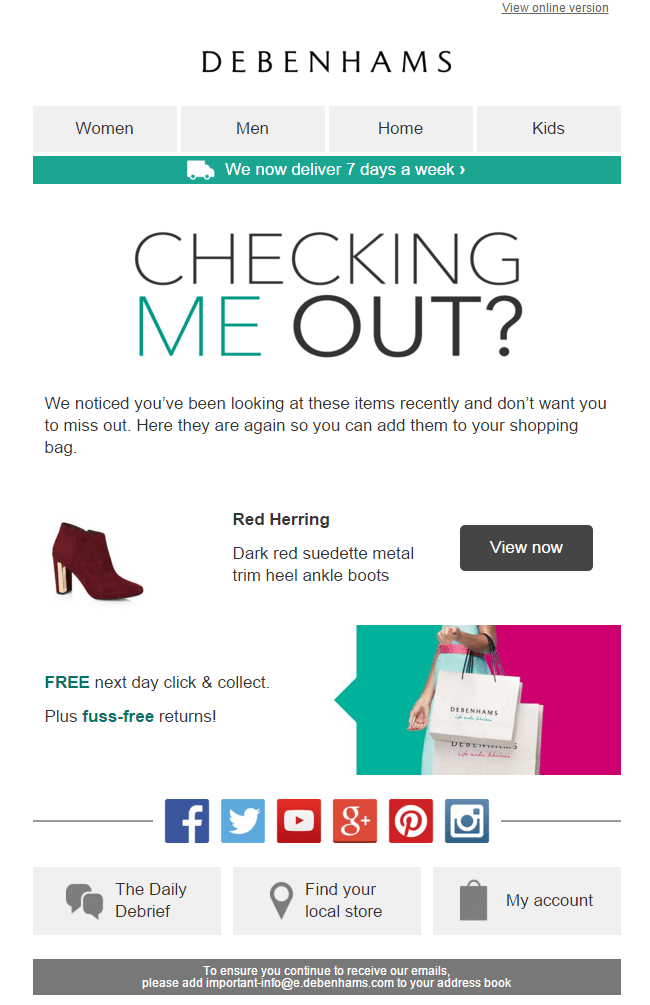
3. DEBENHAMS: Fashion
In Debenhams’ email remarketing campaign, they point out items a customer was browsing but that they haven’t added to their cart.
This email also includes enticing CTAs for buyers: FREE next-day click & collect and fuss-free returns. What more could you ask for?
Interestingly enough, this email doesn’t mention the customer’s name, but it still feels personal as it is targeted directly at customers viewing the product.
4. NIKE: Sportswear
In a similar fashion, Nike triggers a retargeted email after you’ve left some items in your cart.
While they don’t display your abandoned items, they insist on having you talk with a sales representative over the phone or through their online chat.
Finally, they also heavily highlight their “FREE SHIPPING – FREE RETURNS” policy in order to convince undecided customers.
This is especially important to highlight considering that shipping cost is one of the main reasons for cart abandonment.
5. FRESHBOOOKS: Saas
Want to retarget your own customers to upgrade to a new plan? Take a look at FreshBooks’ email campaign as an example.
With 19 days left in a free trial, they offer 60% off any plan for your upgrade. This not only entices the user with a discount but also reminds them that this offer is time sensitive according to how much of their free trial they have used.
Email retargeting best practices
Now that you have a few examples to start your retargeting campaigns, here are some best practices to keep in mind while you set them up.
Timing is everything: The sooner you can start your campaigns, the better. If you contact website visitors shortly after they’ve clicked off your page, they’ll be more likely to return and reconsider your products/services.
Keep it relevant: To be sure you’re targeting the right users, email segmentation is the best way to go. Segmentation is the process of separating the subscribers in your email list into smaller groups. This will help you be sure that you’re sending the right emails to the right people.
A/B test your campaigns: An A/B test will compare two versions of your email to test which one produces the best results. After a few tests, your team should start to identify trends and common patterns that lead to higher open and click-through rates.
Whether you’re looking to personalize your email content to capture customer attention or A/B test your subject lines to determine the best-performing phrase, choosing the right software will help you transform your ideas into reality.
AB Tasty is the complete experience optimization platform to help you create a richer digital experience for your customers — fast. From email remarketing to A/B testing your subject lines, this solution can help you achieve personalization with ease.
Connect with your website visitors
Whether an email remarketing campaign will be a new tactic for your team or you’re looking for some best practices to employ, these campaign examples will change the way you communicate with your consumers.
Relevant and personalized content sent at just the right time is key to generating more revenue with your email campaigns.
When you hear ‘A/B Testing’, do you think straight away of revenue gain? Uplift? A dollars and cents outcome?
According to David Mannheim, CEO of the Conversion Rate Optimization (CRO) agency User Conversion, you probably do – and shouldn’t. Here’s why:
Unfortunately, it’s just not that simple.
Experimentation is more than just a quick strategy to uplift your ROI.
In this article we will discuss why we experiment, the challenges of assessing return on investment (ROI), prioritization, and what A/B testing experimentation is really about.
Why do we experiment?
Technically speaking, experimentation is performed to support or reject a hypothesis. Experimentation provides you with valuable insights into cause-and-effect relationships by determining the outcome of a certain test when different factors are manipulated in a controlled setting.
In other words, if there is no experiment, there is no way to refute a hypothesis and reduce the risk of losing business or negatively impacting metrics.
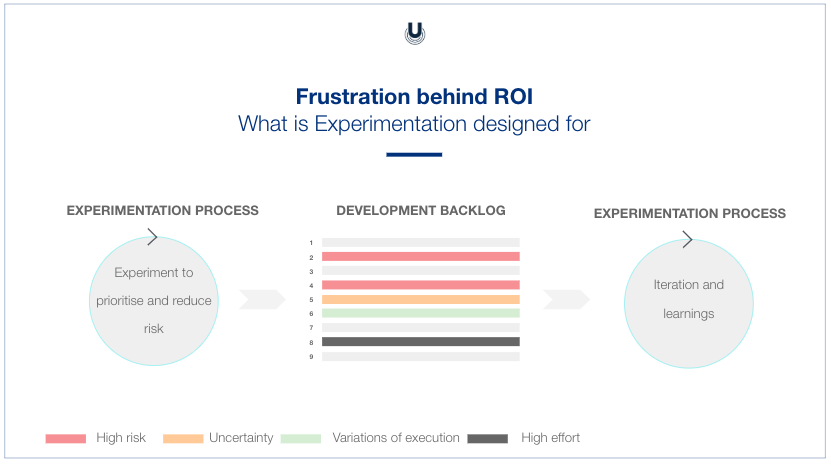
Experimentation is about prioritization, minimizing risk and learning from the outcome. The tests you choose to implement should be developed accordingly. It’s not necessarily about making the “right” or “wrong” decision, experimentation helps you make better decisions based on data.
In visual terms, experimentation will look something like this:
Online experiments in the business world must be carefully designed to learn, accomplish a specific purpose, and/or measure a key performance indicator that may not have an immediate financial effect.
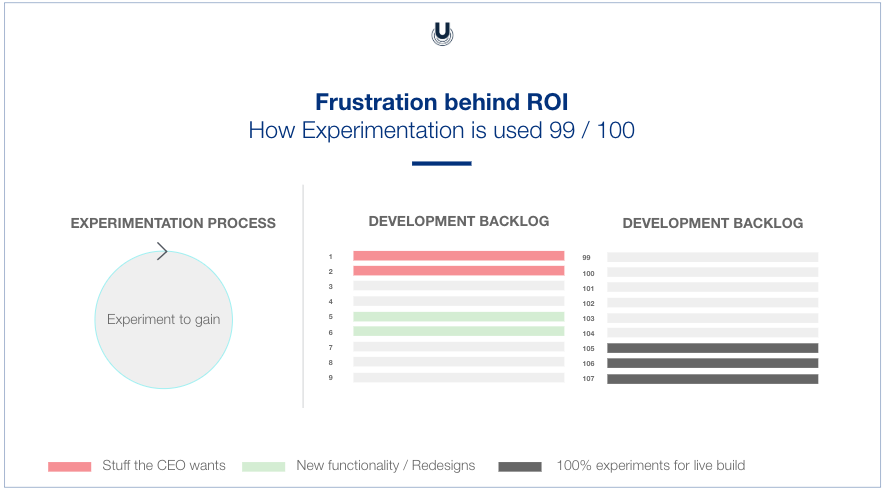
However, far too often it’s the key stakeholders (or HIPPOs) who decide what tests get implemented first. Their primary concern? The amount of time it will take to see a neat revenue uplift.
This tendency leads us to the following theory:
The ROI of experimentation is impossible to achieve because the industry is conditioned to think that A/B testing is only about gain.
Frustrations and challenges of ROI expectations
You may be asking yourself at this point, What’s so bad about expecting revenue uplift from A/B tests? Isn’t it normal to expect a clear ROI?
It is normal, however, the issue isn’t just that simple.
We’ve been conditioned to expect a neat formula with a clean-cut solution: “We invested X, we need to get Y.”
This is a misleading CRO myth that gets in the way.
Stakeholders have come to erroneously believe that every test they run should function like this – which has set unrealistic ROI expectations for conversion optimization practitioners.
As you can imagine, this way of thinking creates frustration for those implementing online experimentation tests.
What people often overlook is the complexity of the context in which they are running their experimentation tests and assessing their ROI.
It’s not always possible to accurately measure everything online, which makes putting an exact number on it next to impossible.
Although identifying the impact of experiments can be quite a challenge due to the complexity of the context, there are some online tools that exist to measure your ROI efforts as accurately as possible.
AB Tasty is an example of an A/B testing tool that allows you to quickly set up tests with low-code implementation of front-end or UX changes on your web pages, gather insights via an ROI dashboard, and determine which route will increase your revenue.
Aside from the frustration that arises from the ingrained ROI expectation to be focused on immediate financial improvement, three of the biggest challenges of the ROI of experimentation are forecasting, working with averages, and multiple tests at once.
Challenge #1: Forecasting
The first challenge with assessing the ROI of experimentation is forecasting. A huge range of factors impacts an analyst’s ability to accurately project revenue uplift from any given test, such as:
Paid traffic strategy
Online and offline marketing
Newsletters
Offers
Bugs
Device traffic evolution
Season
What your competitors are doing
Societal factors (Brexit)
In terms of estimating revenue projection for the following year from a single experiment– it’s impossible to predict an exact figure. It’s only possible to forecast an ROI trend or an expected average.
Expecting a perfectly accurate and precise prediction for each experiment you run just isn’t realistic – the context of each online experimentation test is too complex.
Challenge #2: Working with averages
The next challenge is that your CRO teamisworking with averages – in fact, the averages of averages.
Let’s say you’ve run an excellent website experiment on a specific audience segment – and you experienced a high uplift in conversion rate.
If you then take a look at your global conversion rate for your entire site, there’s a very good chance that this uplift will be swallowed up in the average data.
Your revenue wave will have shrunk to an undetectable ripple. And this is a big issue when trying to assess overall conversion rate or revenue uplift – there are just too many external factors to get an accurate picture.
With averages, the bottom line is that you’re shifting an average. Averages make it very difficult to get a clear understanding.
On average, an average customer, exposed to an average A/B test will perform… averagely.
Challenge #3: Multiple tests
The third challenge of ROI expectations happens when you want to run multiple online experiments at one time and try to aggregate the results.
Again, it’s tempting to run simple math equations to get a clear-cut answer for your gain, but the reality is more complicated than this.
Grouping together multiple experiments and the results of each experiment will provide you will blurred results.
This makes ROI calculations for experimentation a nightmare for those simultaneously running tests. Keeping experiments and their respective results separate is the best practice when running multiple tests.
Should it always be “revenue first”?
Is “revenue first” the best mentality? When you step back and think about it, it doesn’t make sense for conversion optimizers to expect revenue gain, and only revenue gain, to be the primary indicator of success driving their entire experimentation program.
What would happen if all businesses always put revenue first?
That would mean no free returns for an e-commerce site (returns don’t increase gain!), no free sweets in the delivery packaging (think ASOS), the most inexpensive product photographs on the site, and so on.
If you were to put immediate revenue gain first – as stakeholders so often want to do in an experimentation context – the implications are even more unsavory.
Let’s take a look at some examples: you would offer the skimpiest customer service to cut costs, push ‘buy now!’ offers unendingly, discount everything, and forget any kind of brand loyalty initiatives. Need we go on?
In short, focusing too heavily on immediate, clearly measurable revenue gain inevitably cannibalizes the customer experience. And this, in turn, will diminish your revenue in the long run.
What should A/B testing be about?
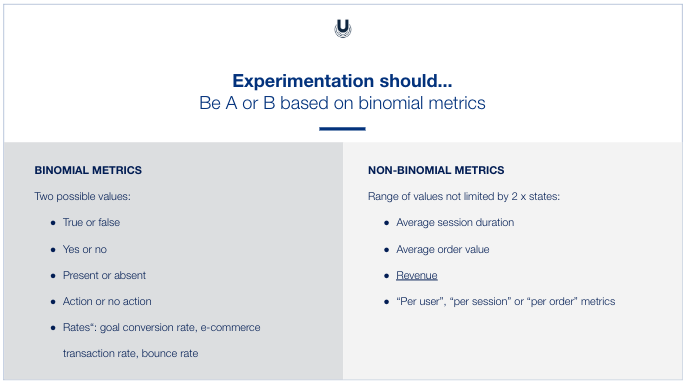
One big thing experimenters can do is work with binomial metrics.
Avoid the fuzziness and much of the complexity by running tests that aim to give you a yes/no, black or white answer.
Likewise, be extremely clear and deliberate with your hypothesis, and be savvy with your secondary metrics: Use experimentation to avoid loss, minimize risk, and so on.
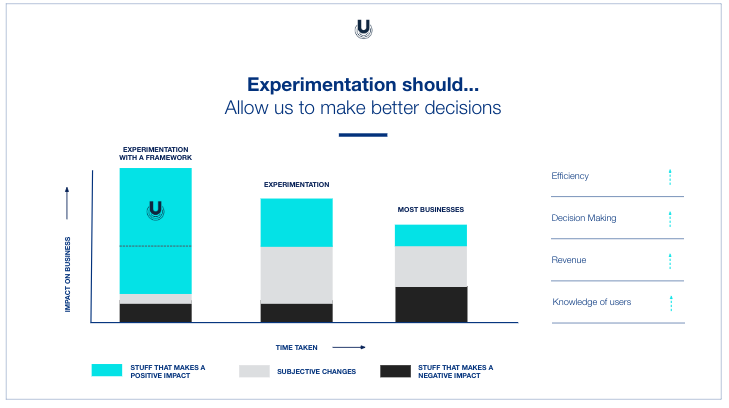
But perhaps the best thing you can do is modify your expectations.
Instead of saying, experimentation should unfailingly lead to a clear revenue gain, each and every time, you might want to start saying, experimentation will allow us to make better decisions.
These better decisions – combined with all of the other efforts the company is making – will move your business in a better direction, one that includes revenue gain.
The ROI of experimentation theory
With this in mind, we can slightly modify the original theory of the ROI of experimentation:
The ROI of experimentation is difficult to achieve and should be contextualized for different stakeholders and businesses. We should not move completely away from a dollar sign way of thinking, but we should deprioritize it. “Revenue first” is not the best mentality in all cases- especially in situations as complex as calculating the ROI of experiments.
Once upon a time, driving digital customer experience optimization (EXO) meant having a competitive edge. You went the extra mile, you won. Nowadays, everyone is focused on EXO to the point where it’s the minimum necessary to stay in the game.
“Experience” encompasses the entire user journey across all touchpoints that a consumer encounters when interacting with your brand. Be it website, app, tablet, mobile, bot-generated or in-store, the quality of these interactions will impact your customers’ purchasing decisions and their loyalty.
Customer experience optimization can greatly influence buyers’ purchasing decisions and loyalty (Source)
Deliver solid experiences and it will shape your brand reputation and increase your conversion rates – the key is to never stop moving. Remain stagnant, and you’ll be overtaken; but if you can figure out what your customers want, find the line between what they’re looking for and what you can offer, and then evolve your interactions on an ongoing basis, you can deliver superior experiences and business success.
Here at AB Tasty we believe that optimization is the bare minimum you should be delivering. In order to stay competitive and stay ahead, the work should never stop. Establishing a continuous feedback loop through experimentation and data gathering and analysis are what it takes to maximize customer experience and keep your competitive edge.
In this article, we’ll cover:
[toc]
Why is customer experience optimization so relevant?
At the base, no matter what the product or sales channel, any business will try to satisfy their customers. Customer centricity has been around longer than we might think, but customer experience optimization really started to take flight as technology advanced and brand touchpoints and interactions diversified.
Throw in the fact that data is more readily available, collectible and collected, and suddenly the means to understand your customers better than they understand themselves is out there for the taking.
Use the data you collect to take your customer experience to the next level (Source)
Not convinced that it really matters? Think again. PwC’s Future of CX report found that one in three consumers will walk away from a brand after just one negative experience. Furthermore, 73% of consumers nominate their experience in brand interactions as an important factor in making purchasing decisions.
Is customer experience optimization truly essential?
Think about your own experiences when shopping online. How does it feel? Which brands do you gravitate towards and which ones just don’t seem to tickle your fancy? Do they see you as an individual, a real person, or are you just another transaction to them? It only takes a moment’s pause to consider your own experiences to understand why optimizing customer experiences is not just important, but essential.
As consumers, we make decisions about where to shop, which products to buy and which ones to keep buying based on our past experience of acquiring and consuming them. What’s more: the aforementioned Future of CX report from PwC found that customers are more likely to try additional products and services from a brand they trust, and that they’re even willing to pay more, too – up to 16% more depending on the product category. It’s also less expensive to encourage repeat business (customer loyalty) than to acquire new customers, so leveraging customer experience optimization to drive long-term brand affinity and customer lifetime value will pay for itself.
The three key ingredients to supercharge your customer experience optimization
When a customer arrives on your site – whether they’re searching for products, comparing different options or just looking to learn more about your products – there are a number of steps they’ll go through to achieve their end goal. All of these add up to a path that they’ve taken through your website, and one that presents both opportunities and pitfalls when it comes to optimizing your site and meeting your customers’ needs. The more you can understand your user journey and implement improvements while removing frictions along the purchase funnel, the better your site will perform.
Gathering data about your customers’ behavior and preferences will give you the information you need to run experiments to discern the optimal setup using A/B testing. Not sure if your CTAs have the best wording? Test them! Trying to understand the best configuration for your landing page? Run an experiment! Have doubts about whether product images should be cropped or full body? We can examine that too!
Ultimately, you’re aiming to ensure that all roads lead to an increase in conversions – and driving UX optimization on an ever-changing customer pathway is necessary to keep you ahead of the game.
Continuously optimizing your user experience is essential for staying ahead of the curve (Source)
2. Improve your personalization efforts
Know your customers and tailor to their needs!
Tailoring a digital brand interaction to the unique needs of the person behind the screen builds customer loyalty and drives repeat business. In the experience economy, you’re selling your product plus the interaction with the brand and the purchase itself alongside it. The user experience when acquiring and consuming the product is just as important as the utility it performs. Accordingly, personalizing these digital exchanges with your consumers is key to long-term customer retention.
To better understand your customers on a personal level, building a solid data foundation allows you to best understand your users, identify their needs and deliver personalized experiences that will keep your shoppers returning again and again. After all, personalization is about getting to the root of what customers have shown you that they want and delivering against that.
Use the data you gather to tailor each user’s experience on your site (Source)
As with your customer journey, responding to ever-changing desires can be challenging, so knowing your customers intimately is crucial for personalization success. Get it right and the impact is high so don’t leave any stone unturned when exploring improvement opportunities.
3. Implement server-side testing and feature management
Bring in the tech teams to expand your optimization activities!
Server-side testing is where we bring in the heavy hitters. While A/B testing can be rapidly implemented by marketing teams, server-side experimentation requires the buy-in and expertise of tech teams and developers.
Collaboration between the two groups is essential to deliver seamless customer experiences where the front-end (client-side) lures in your customers and the back-end (server-side) runs smoothly to ensure an effortless shopping experience. For instance, presenting a promotional offer (front-end) will only deliver results if the payment gateway runs glitch-free and the page loading times are fast (back-end).
Lukas Vermeer, director of experimentation at Vista, champions the value of testing both sides. “A lot of the value from experimentation…comes from two things: One is not shipping the bad stuff – a huge value point for experimentation. The other amount of value [comes from] figuring out strategically, going forward, what you should invest in.”
Lukas Vermeer, a guest speaker in the “1000 Experiments Club” podcast, champions the value of testing both sides (Source)
If your business has reached a certain level of maturity and sophistication, maximizing both client- and server-side testing will ensure that your optimization approaches are working the hardest they possibly can to deliver improved business outcomes.
How can customer experience optimization apply to different sectors?
E-commerce
Delivering digital customer experience optimization through experimentation can drive transactions, increase conversion rates and optimize user experience as you test your site in an effort to offer a smoother purchasing experience that caters to your users’ every need.
B2B
Not every website is for purchasing then and there; sometimes site visits are an initial step on a longer journey. You can drive lead generation for purchases in areas like automotive, bedroom furniture or holiday rentals by optimizing site layout, CTAs, and access to product and store information.
Travel
Offering a range of solutions, from individual products (like hotel or transport bookings) right up to comprehensive packages that take care of every step of a holiday, is a particularity of the travel industry. When bundling items together into packages, finding that pricing sweet spot is especially key. Server-side testing is particularly relevant in this field and can give you the tools to both curate your product offering and increase bookings as well.
Conclusion
When it comes to digital customer experience optimization, improving continuously is essential to your strategy; here at AB Tasty, we can’t stress that enough!
With both technology and customer attitudes evolving every second, the only way to keep the pace is by continuously adapting your company’s own optimization practices to respond to customer demands and unlock increased value and continuing loyalty.
Living and breathing such an approach means setting up your marketing, product and technical teams for smooth cross-collaboration and a shared mission and objectives. Ensuring that they’re also sharing the same experimentation and development roadmap to unlock resources and roll out improvements at the right time will keep your business on the road to success.


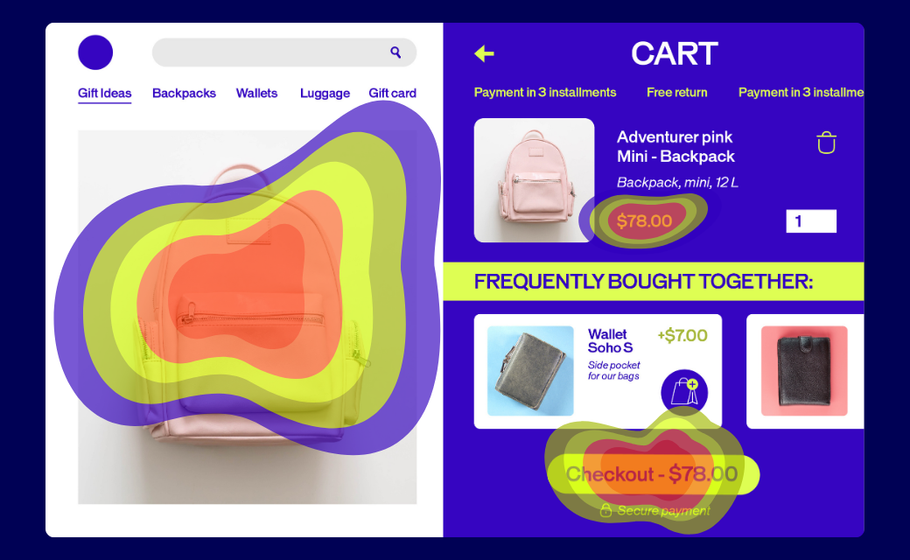
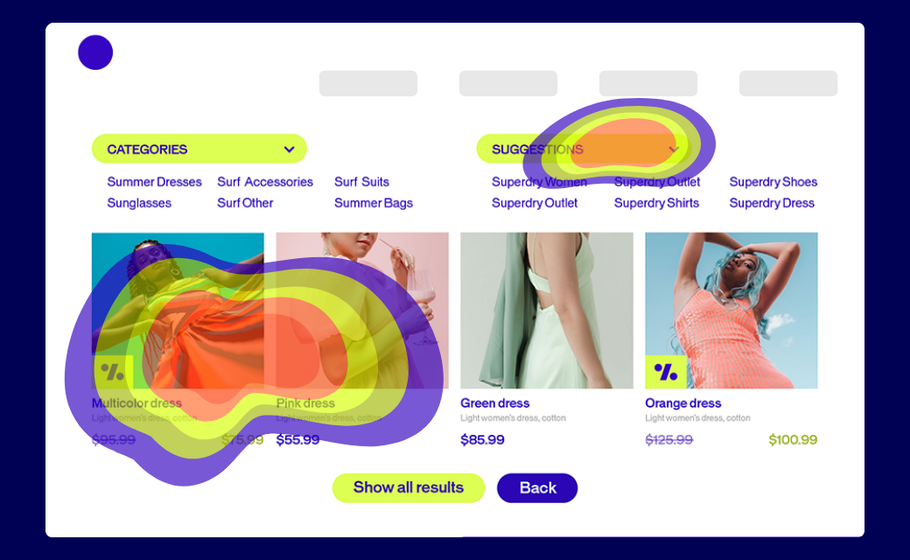
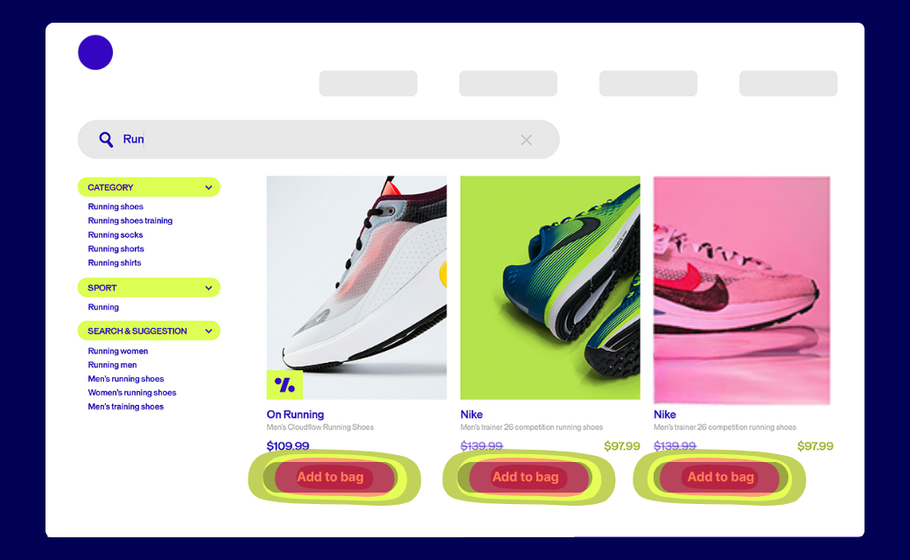

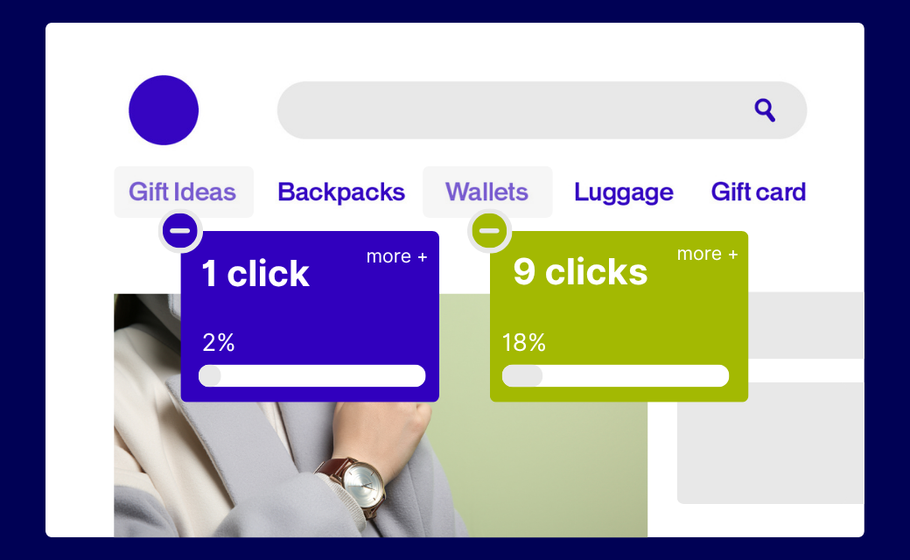


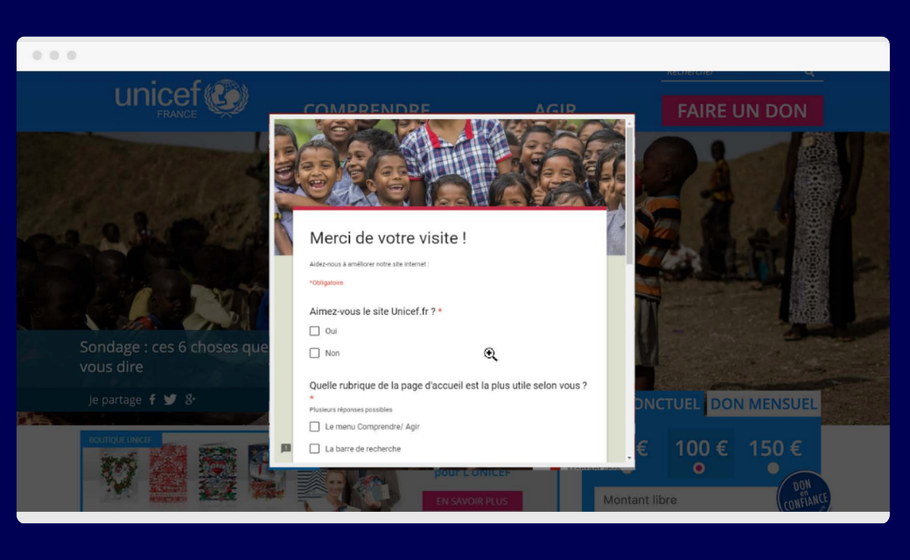
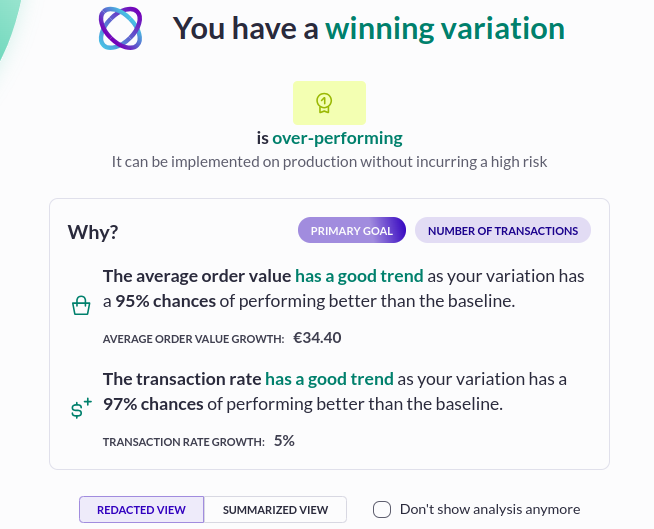
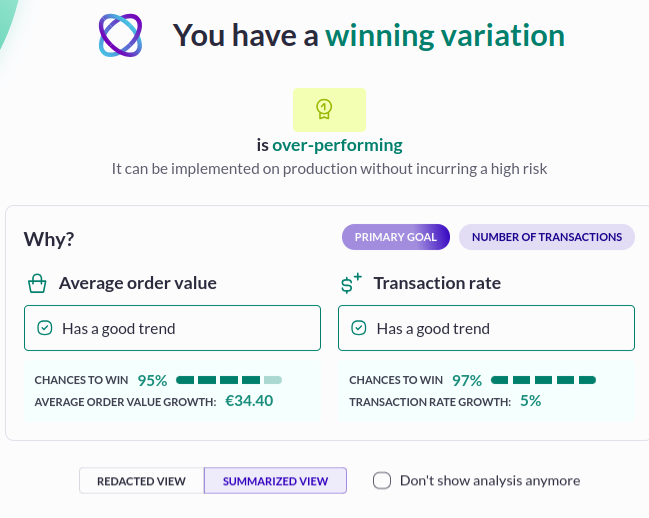
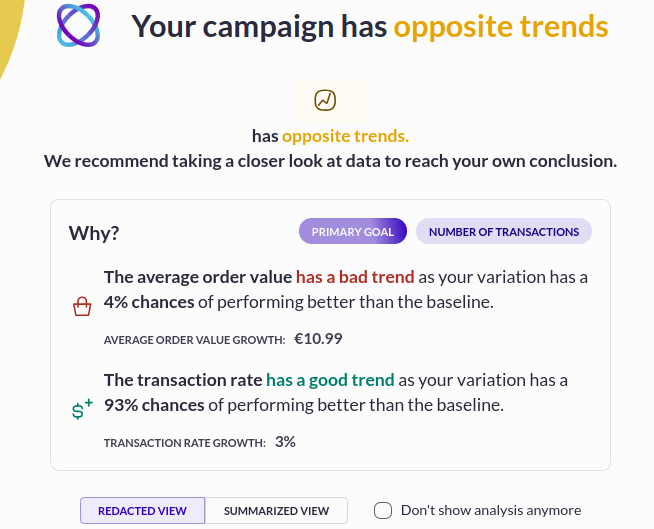
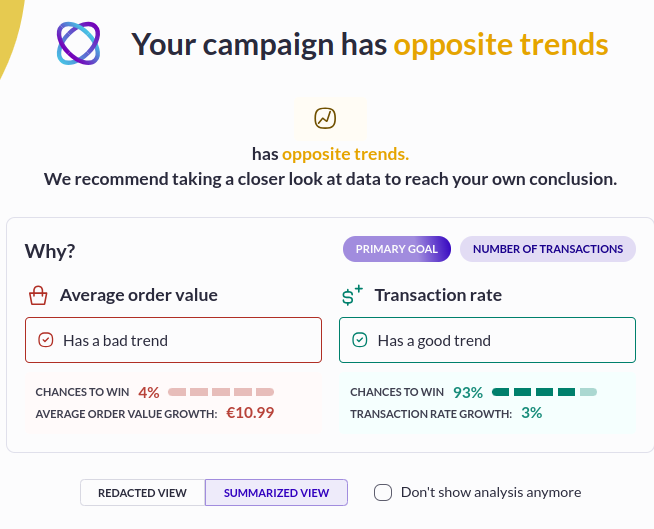


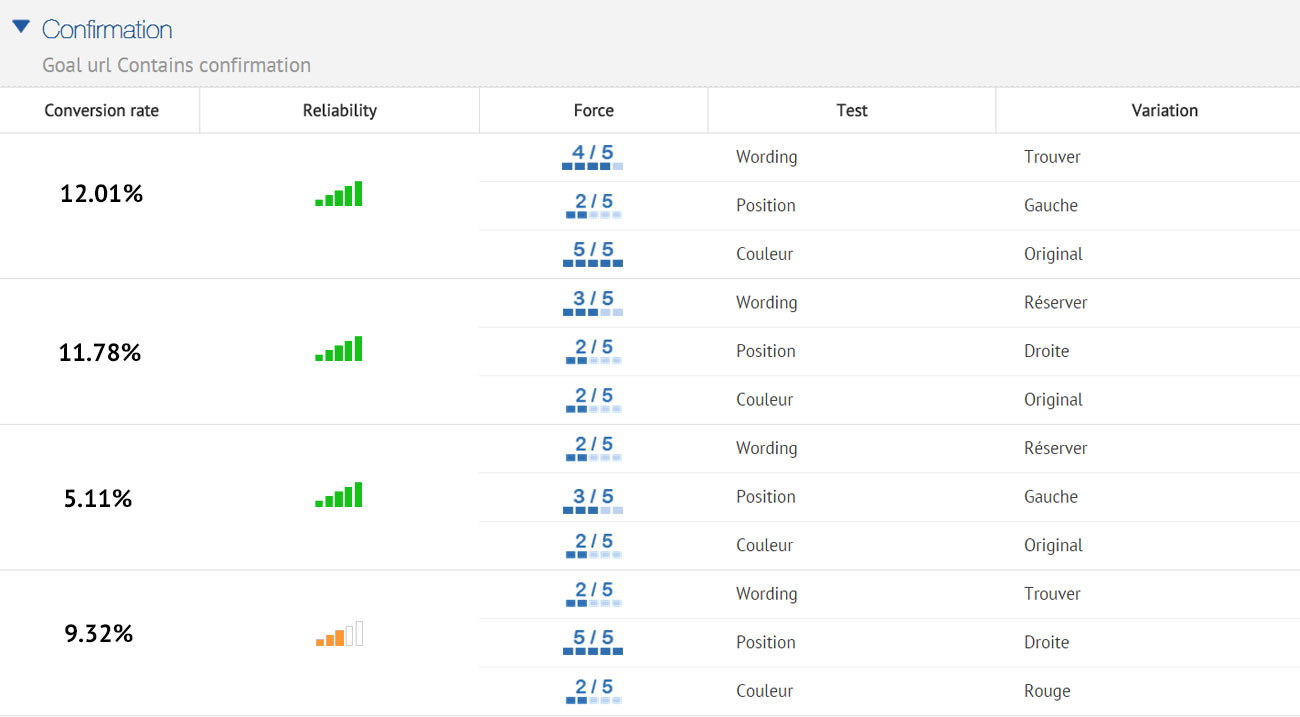

 FoodPanda knows that hunger cannot wait. In the image above you can see that they retarget with two magical words: “FREE+DELIVERY”